. 2024 Jun;19(6):856-866.
doi: 10.1038/s41565-024-01624-2. Epub 2024 Mar 13.

Universal STING mimic boosts antitumour immunity via preferential activation of tumour control signalling pathways

Affiliations

Universal STING mimic boosts antitumour immunity via preferential activation of tumour control signalling pathways

Ying Wang et al. Nat Nanotechnol. 2024 Jun.

Erratum in

Abstract

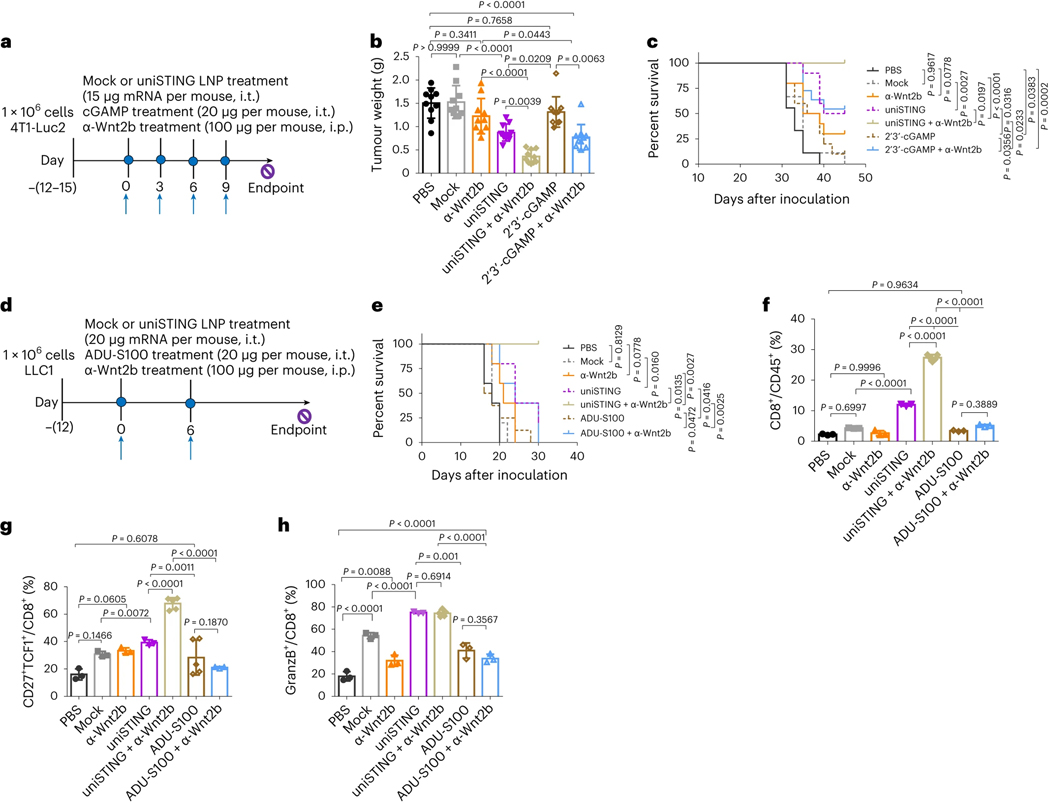
The efficacy of STING (stimulator of interferon genes) agonists is due to various factors, primarily inefficient intracellular delivery, low/lack of endogenous STING expression in many tumours, and a complex balance between tumour control and progression. Here we report a universal STING mimic (uniSTING) based on a polymeric architecture. UniSTING activates STING signalling in a range of mouse and human cell types, independent of endogenous STING expression, and selectively stimulates tumour control IRF3/IFN-I pathways, but not tumour progression NF-κB pathways. Intratumoural or systemic injection of uniSTING-mRNA via lipid nanoparticles (LNPs) results in potent antitumour efficacy across established and advanced metastatic tumour models, including triple-negative breast cancer, lung cancer, melanoma and orthotopic/metastatic liver malignancies. Furthermore, uniSTING displays an effective antitumour response superior to 2'3'-cGAMP and ADU-S100. By favouring IRF3/IFN-I activity over the proinflammatory NF-κB signalling pathway, uniSTING promotes dendritic cell maturation and antigen-specific CD8+ T-cell responses. Extracellular vesicles released from uniSTING-treated tumour cells further sensitize dendritic cells via exosome-containing miRNAs that reduced the immunosuppressive Wnt2b, and a combination of LNP-uniSTING-mRNA with α-Wnt2b antibodies synergistically inhibits tumour growth and prolongs animal survival. Collectively, these results demonstrate the LNP-mediated delivery of uniSTING-mRNA as a strategy to overcome the current STING therapeutic barriers, particularly for the treatment of multiple cancer types in which STING is downregulated or absent.


Conflict of interest statement

Competing interests

The authors declare no competing interests.

Figures

Fig. 1 |
Fig. 1 |. LNP-uniSTING-mRNA induced constitutive STING activation and EV-mediated crosstalk between tumour cells and DCs.
LNP-uniSTING-mRNA treatment resulted in the expression of a universal STING mimic in tumour cells and DC cells, which self-assembled into a tetrameric subunit followed by the formation of a higher-order STING architecture for efficient downstream phosphorylation of IRF3 and subsequent release of type I IFNs and ISG cytokines. EVs released by uniSTING-treated tumour cells further sensitized DCs’ function in the TME by the secretion of miRNAs, including miR-130–3p, miR-15b-5p and miR-16–3p, which targeted Wnt2b and reduced immunosuppressive signalling molecules. P, phosphorylation. Illustration created with BioRender.com.
Fig. 2 |
Fig. 2 |. Characterization of tetramer-based uniSTING as a universal STING agonist independent of cGAMP or endogenous STING.
a, Schema for uniSTING construction by genetically fusing an N-terminal Flag tag and a 52-residue tetramerization motif (green) with the C-terminal cytoplasmic domain of STING (red). b, Immunofluorescence staining revealed TBK1-GFP and IRF3-HA (purple) colocalized with uniSTING-Flag (red) in the cytosol of HEK293T cells. DAPI staining was used to show the nucleus (blue). Scale bars, 10 μm (left); 2 μm (right). A representative of three repeated experiments is shown. c, Coimmunoprecipitation of uniSTING with pTBK1, pIRF3 or Flag in cell lysates from DC2.4 cells. A representative of three repeated experiment is shown. d, Top seven enriched Gene Ontology pathways in uniSTING-treated DC2.4 cells. e, Venn diagram and volcano plot of the percentages of DEGs that were associated with either pIRF3 binding (red) or p-p65 binding (cyan) in uniSTING-treated 4T1 versus the mock group. FC, fold change. f, Selected IRF3-dependent or NF-κB-dependent pathways in 4T1 tumour cells (P < 0.01). IKK, inhibitory-κB kinase; IL-2, interleukin-2; TNF, tumour necrosis factor. g, Transcripts of Ifnb1, Cxcl10, Il6 and Tnf in 4T1 tumour cells 24 h after indicated treatments. n = 6 biologically independent samples. h, Immunoblot analysis of STING signalling in DC2.4 cells, 4T1 or ES-2 tumour cells treated with PBS, mock mRNA (1 μg ml−1), mSTING mRNA (1 μg ml−1), uniSTING mRNA (1 μg ml−1), or 2′3′-cGAMP (5 or 10 μg ml−1). i, ELISA revealed IFNβ production in murine DCs, 4T1 or ES-2 tumour cells 24 h after indicated treatments (mSTING, monomeric STING mRNA; mock, EGFP-mRNA; uniSTING, universal polymeric STING mRNA; 1 μg mRNA or 5 μg/10 μg 2′3′-cGAMP per ml). n = 5 biologically independent samples. j, Fluorescence-activated cell sorting gating strategy of BMDCs (CD11c+F4/80 cells gated on CD45+CD11b). mRNA expression of Ifnb1 and Cxcl10 in BMDCs derived from WT, Tmem173−/−, Irf3−/− and Ifnαr1−/− mice 24 h after PBS, mock mRNA (1 μg ml−1), uniSTING mRNA (1 μg ml−1), or 2′3′-cGAMP (10 μg ml−1) treatment. n = 5 biologically independent samples. Significant differences were assessed by unpaired two-tailed Student’s t-test (df), a one-way ANOVA and Tukey’s multiple-comparisons test (g,i) and two-way ANOVA with multiple comparisons (j). Results are presented as mean ± s.d.
Fig. 3 |
Fig. 3 |. Cytosolic delivery of uniSTING-mRNA based on LNPs intratumourally inhibits tumour growth.
a, Schematic of mRNA-loaded SS-OP LNPs and cryogenic electron microscopy image of LNP-uniSTING-mRNA. Scale bar, 100 nm. Each experiment was repeated three times. b, LNP-mCherry-mRNA expression in tumour cells (4T1-GFP), DCs (CD45+CD11c+), T cells (CD45+CD3+) and macrophages (CD45+CD11cCD11b+F4/80+) following intratumoural injection (i.t.) (mCherry mRNA, 0.5 mg kg−1), quantified by flow cytometry. n = 6 mice per group. c, Representative confocal microscopy images of mCherry+ cells in 4T1-GFP tumour 6 h postinjection (n = 6). 40× magnification (scale bar, 10 μm) and its regional magnification (scale bar, 2 μm) are shown. Immunofluorescence staining with anti-CD11c antibody (white) and DAPI (blue). Each experiment was repeated three times. d, In vivo transfection efficiency of SS-OP LNPs and MC3 LNPs measured by IVIS by intratumoural administration of LNP-luciferase-mRNA (mRNA, 0.5 mg kg−1) in 4T1 models (n = 3). e, In vivo uniSTING protein in tumour tissues, normal organs and serum 6 h following i.t. injection of LNP-uniSTING-mRNA (mRNA, 1 mg kg−1) (n = 8). f, Time course of uniSTING expression in tumours (n = 8). g, Treatment scheme and Kaplan–Meier survival of 4T1-Luc2 tumour-bearing mice treated with the indicated formulations (for PBS, LNP-mock-mRNA, LNP-uniSTING-mRNA, 2′3′-cGAMP, n = 10, 10, 12 and 8, respectively). h, 4T1-Luc2 tumour weight following the indicated treatments (n = 8). i, Spider plots of 4T1-Luc2 growth curves, measured by bioluminescence signals (n = 10). j, Treatment scheme and Kaplan–Meier survival of LLC1 tumour-bearing mice with the indicated formulations (n = 7). k, LLC1 tumour weight following the indicated treatments (n = 8). l, Spider plots of LLC1 tumour growth curves (for PBS, LNP-mock-mRNA, LNP-uniSTING-mRNA and 2′3′-cGAMP, n = 7, 7, 7 and 8, respectively). m, Treatment scheme and Kaplan–Meier survival of B16-F10 tumour-bearing mice treated with the indicated formulations (n = 8). n, Spider plots of individual tumour growth curves (n = 6). Log-rank (Mantel–Cox) test. o, Cured mice were reinoculated with 105 B16-F10 cells. Rechallenging tumour growth and Kaplan–Meier survival curves are shown (n = 5). Significance assessed with one-way ANOVA and Tukey’s multiple comparisons test for tumour growth and log-rank (Mantel–Cox) test for survival. p, Treatment scheme and Kaplan–Meier survival of E0771 tumour-bearing mice (WT, Tmem173−/− and Ifnar−/− mice) treated with the indicated formulations (for PBS and LNP-uniSTING-mRNA in WT, Tmem173−/− and Ifnαr−/− mice, n = 7, 8, 5, 7, 5 and 6, respectively). q, E0771 tumour weight following the indicated treatments (for PBS and LNP-uniSTING-mRNA in WT, Tmem173−/− and Ifnαr−/− mice, n = 6, 8, 7, 8, 5 and 6, respectively). Significant differences were assessed using a one-way ANOVA and Tukey’s multiple-comparisons test (b,d,e,f,h,k), log-rank (Mantel–Cox) test (g,j,m,p), and two-way ANOVA with multiple comparisons (q). Results are presented as mean ± s.d.
Fig. 4 |
Fig. 4 |. Systemic uniSTING treatment exerts potent antitumour effects on orthotopic/metastatic tumours.
a, Treatment scheme for the 4T1-Luc2 liver metastatic tumour model with the indicated formulations. b, Spider plots of individual tumour growth curves measured by bioluminescence intensity. n = 5 in each group. c, In vivo bioluminescence imaging of mice bearing liver metastatic tumours on days 1 and 10 following treatment. n = 5 biologically independent samples. d, Kaplan–Meier survival curves of mice treated with indicated formulations. n = 8 biologically independent samples. e, Treatment scheme for orthotopic Hepa1–6 HCC tumour-bearing mice with the indicated formulations. f, Average tumour weight in HCC tumour models after indicated treatments. n = 7 biologically independent sample. g, Kaplan–Meier survival curves of mice treated with indicated formulations. n = 8 biologically independent samples. For survival studies, 5 × 10⁷ of bioluminescence intensity was used as the endpoint criteria in the 4T1 liver metastatic tumour model and a 30% weight loss was used as the endpoint criteria in the HCC tumour model. Each line represents one survival curve for each group; log-rank (Mantel–Cox) test. Significant differences were assessed using a one-way ANOVA and Tukey’s multiple-comparisons test. Results are presented as mean ± s.d.
Fig. 5 |
Fig. 5 |. Exosomal miRNAs derived from uniSTING-treated tumour cells potentiate DC function by blocking Wnt2b signalling.
a, Left: heatmap of DEGs in EXOmock- or EXOuniSTING-treated DC2.4 cells (n = 2 per group). Upregulated (red) or downregulated (blue) DEGs are shown. Right: GSEA enrichment of the IFNα response signatures in samples shown in the left panel. b, Volcano plot showing fold changes of DEGs between EXOmock-treated and EXOuniSTING-treated DC2.4 cells (log2 FC, >1.5; adjusted P < 0.05). c, Wnt2b mRNA expression in DC2.4 cells pretreated with PBS, mock or uniSTING-mRNA, upon the addition of EXOmock or EXOuniSTING. n = 6 per group. d, Transcripts of Wnt2b, Ifnb1, Cxcl9, Cxcl10, Tgfb and Il10 in DC2.4 cells 48 h after treatment with siRNA against Wnt2b or siRNA negative control, α-Wnt2b antibody and PBS, respectively. n = 6 per group. e, Integrated scores predicting the association between miRNAs with Wnt2b mRNA. Higher scores indicate a stronger association. f, Wnt2b expression in DC2.4 cells after treatment with synthetic miRNA pool (mixture of 25 nM miR-130b-3p, miR-130a-3p and miR-19a-3p mimics) or control miR mimic, upon the addition of EXOmock or EXOuniSTING. n = 5 per group. g, Relative miR-130a-3p and miR-130b-3p expression in mock/uniSTING-treated tumour cells transfected with inhibitory miRiCtr or miRi Pool (miRi 130a-3p, miRi 130b-3p). n = 6 per group. h,i, Wnt2b expression in DC2.4 cells after treatment with EVs collected via ultracentrifugation of the CM from 4T1 tumour cells treated with mock + miRiCtr, mock + miRi Pool, uniSTING + miRiCtr or uniSTING + miRi Pool, analysed by western blotting (h) or qPCR (i). Non-treated DC2.4 cells were used as control. n = 6 per group. j, Transcripts of Ifnb1, Cxcl10, Cd80 and Cd86 in DC2.4 cells after treatment with EVs collected via ultracentrifugation of the CM from 4T1 tumour cells treated with mock + miRiCtr, mock + miRi Pool, uniSTING + miRiCtr and uniSTING + miRi Pool. Non-treated DC2.4 cells were used as control. n = 5 per group. Significant differences were assessed using a one-way ANOVA and Tukey’s multiple-comparisons test and two-way ANOVA with multiple comparisons. Results are presented as mean ± s.d.
Fig. 6 |
Fig. 6 |. α-Wnt2b antibody enhances in vivo antitumour activity of STING activation.
a, Treatment scheme for 4T1-Luc2 tumour-bearing mice with the indicated formulations. b, Average tumour weight in 4T1-Luc2 tumour models after indicated treatments. n = 10 biologically independent sample. c, Kaplan–Meier survival curves of 4T1-Luc2 tumour-bearing mice treated with indicated formulations. For PBS, LNP-mock-mRNA, α-Wnt2b, LNP-uniSTING-mRNA, LNP-uniSTING-mRNA + α-Wnt2b, 2′3′-cGAMP and 2′3′-cGAMP + α-Wnt2b, n = 10, 10, 10, 10, 9, 7 and 11 biologically independent samples, respectively. Each line represents one survival curve for each group; log-rank (Mantel–Cox) test. d, Treatment scheme for LLC1 tumour-bearing mice with the indicated formulations. e, Kaplan–Meier survival curves of LLC1 tumour-bearing mice treated with indicated formulations. n = 5 biologically independent sample. In all the survival analyses, an 800 mm3 tumour volume was used as the endpoint criterion. Each line represents one survival curve for each group; log-rank (Mantel–Cox) test. f, Impact of indicated treatments on CD8+ frequency in CD45+ cells. For PBS, LNP-mock-mRNA, α-Wnt2b, LNP-uniSTING-mRNA, LNP-uniSTING-mRNA + α-Wnt2b, ADU-S100 and ADU-S100 + α-Wnt2b, n = 3, 3, 3, 3, 5, 3 and 3 biologically independent samples, respectively. g, The percentage of CD27+TCF1+ memory CD8+ T cells in lung tumours. For PBS, LNP-mock-mRNA, α-Wnt2b, LNP-uniSTING-mRNA, LNP-uniSTING-mRNA + α-Wnt2b, ADU-S100 and ADU-S100 + α-Wnt2b, n = 3, 3, 3, 3, 5, 5 and 3 biologically independent samples, respectively. h, The percentage of GzmB+ cells in CD8+ T cells. For PBS, LNP-mock-mRNA, α-Wnt2b, LNP-uniSTING-mRNA, LNP-uniSTING-mRNA + α-Wnt2b, ADU-S100 and ADU-S100 + α-Wnt2b, n = 3, 3, 3, 3, 5, 3 and 3 biologically independent samples, respectively. Gating strategies for flow cytometry are shown in Supplementary Fig. 18. Significant differences were assessed using a one-way ANOVA and Tukey’s multiple-comparisons test (b,fh). Results are presented as mean ± s.d.

References

    1. Barber GN STING: infection, inflammation and cancer. Nat. Rev. Immunol 15, 760–770 (2015). - PMC - PubMed
    1. Srikanth S. et al. The Ca2+ sensor STIM1 regulates the type I interferon response by retaining the signaling adaptor STING at the endoplasmic reticulum. Nat. Immunol 20, 152–162 (2019). - PMC - PubMed
    1. Li S. et al. Prolonged activation of innate immune pathways by a polyvalent STING agonist. Nat. Biomed. Eng 5, 455–466 (2021). - PMC - PubMed
    1. Corrales L. et al. Direct activation of STING in the tumor microenvironment leads to potent and systemic tumor regression and immunity. Cell Rep. 11, 1018–1030 (2015). - PMC - PubMed
    1. Li L. et al. Hydrolysis of 2′3′-cGAMP by ENPP1 and design of nonhydrolyzable analogs. Nat. Chem. Biol 10, 1043–1048 (2014). - PMC - PubMed

LinkOut - more resources