. 2024 Mar 13;8(1):68.
doi: 10.1038/s41698-024-00519-8.

Proteogenomic analysis of enriched HGSOC tumor epithelium identifies prognostic signatures and therapeutic vulnerabilities

Collaborators, Affiliations

Proteogenomic analysis of enriched HGSOC tumor epithelium identifies prognostic signatures and therapeutic vulnerabilities

Nicholas W Bateman et al. NPJ Precis Oncol. .

Erratum in

  • Author Correction: Proteogenomic analysis of enriched HGSOC tumor epithelium identifies prognostic signatures and therapeutic vulnerabilities.
    Bateman NW, Abulez T, Soltis AR, McPherson A, Choi S, Garsed DW, Pandey A, Tian C, Hood BL, Conrads KA, Teng PN, Oliver J, Gist G, Mitchell D, Litzi TJ, Tarney CM, Crothers BA, Mhawech-Fauceglia P, Dalgard CL, Wilkerson MD, Pierobon M, Petricoin EF, Yan C, Meerzaman D, Bodelon C, Wentzensen N, Lee JSH; APOLLO Research Network; Huntsman DG, Shah S, Shriver CD, Phippen NT, Darcy KM, Bowtell DDL, Conrads TP, Maxwell GL. Bateman NW, et al. NPJ Precis Oncol. 2024 May 6;8(1):97. doi: 10.1038/s41698-024-00588-9. NPJ Precis Oncol. 2024. PMID: 38710993 Free PMC article. No abstract available.

Abstract

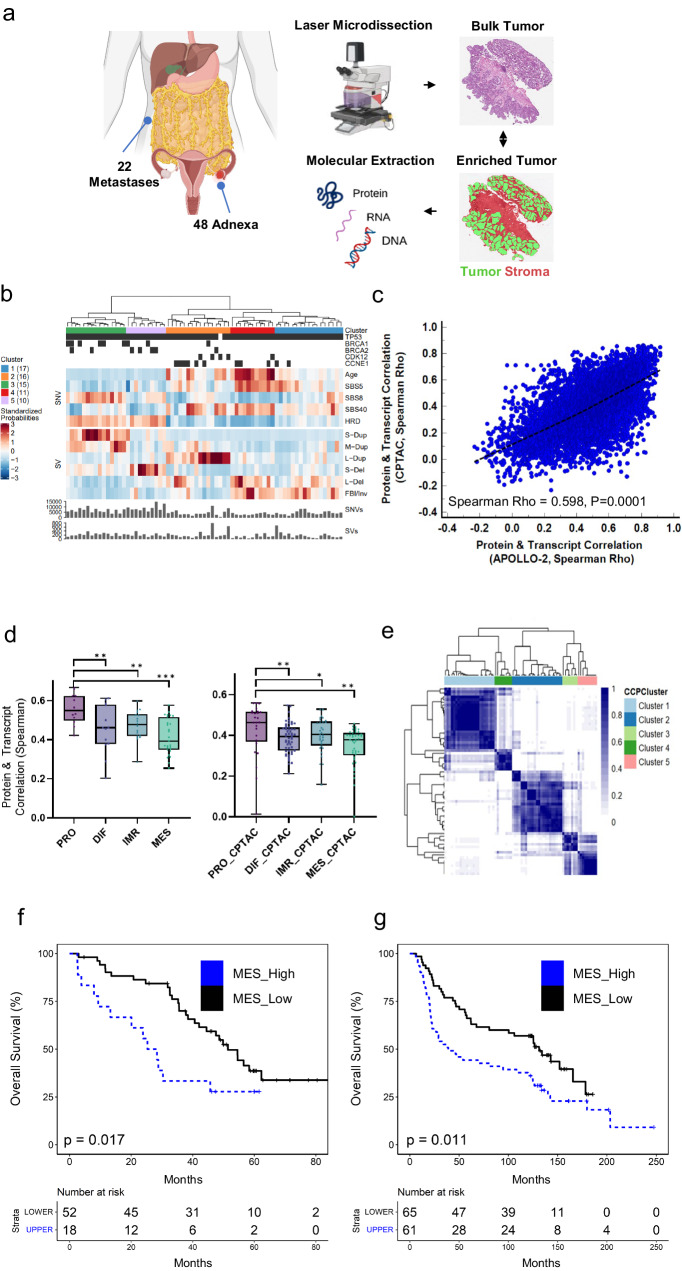
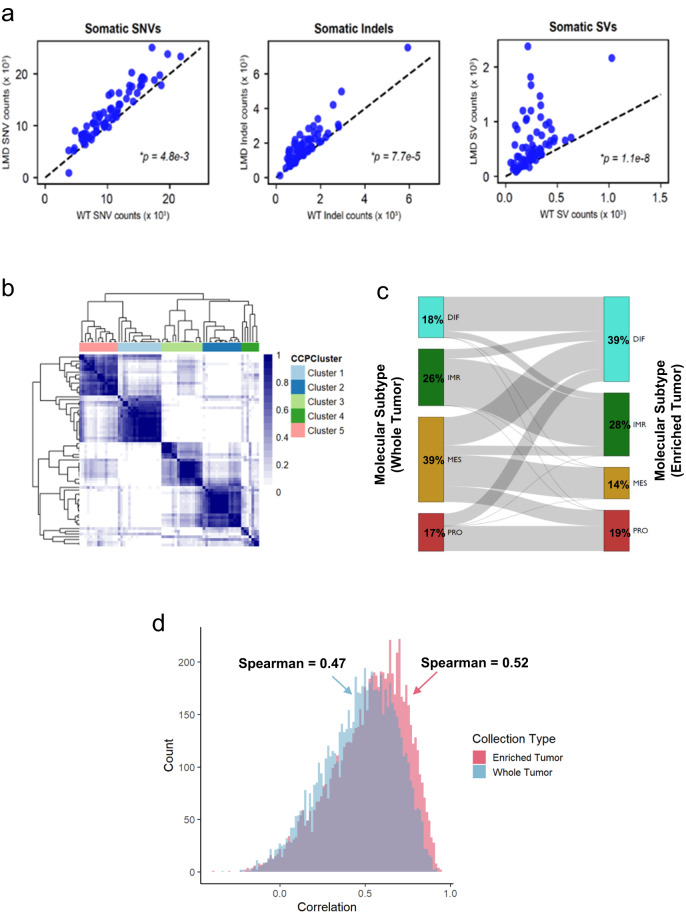
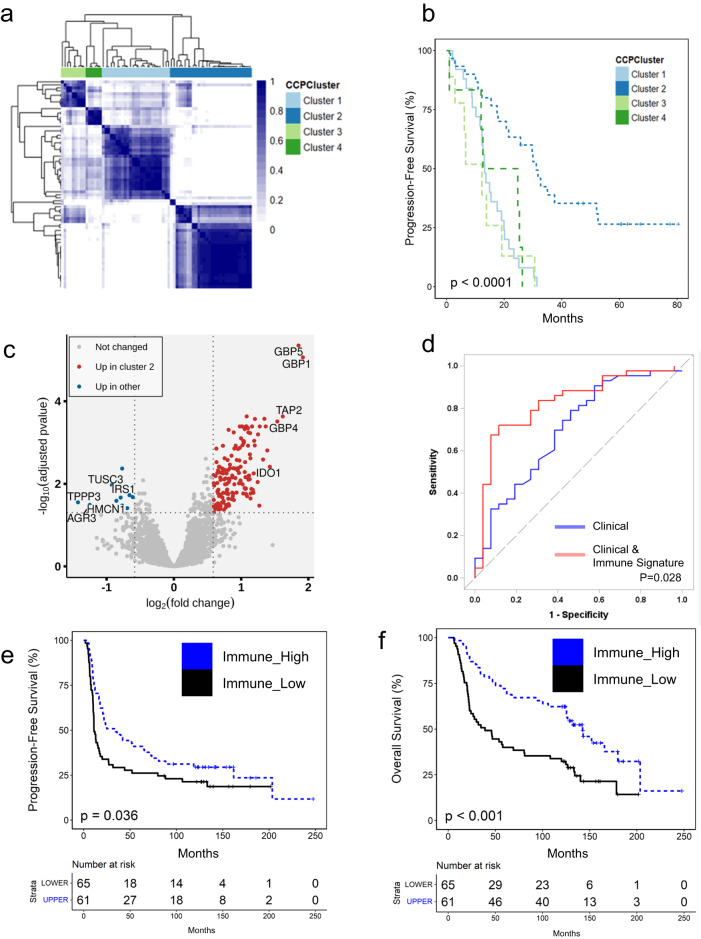
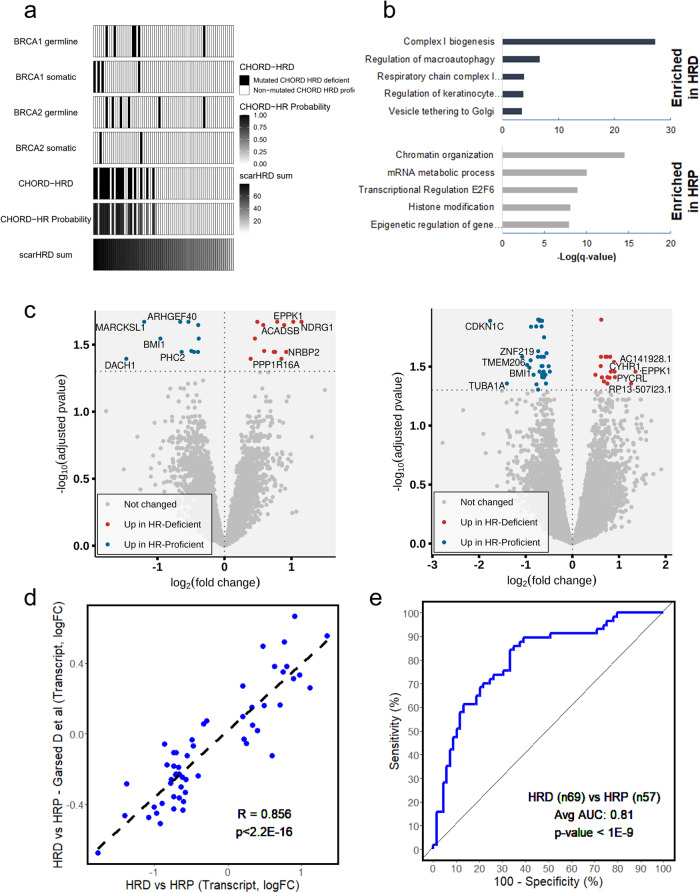
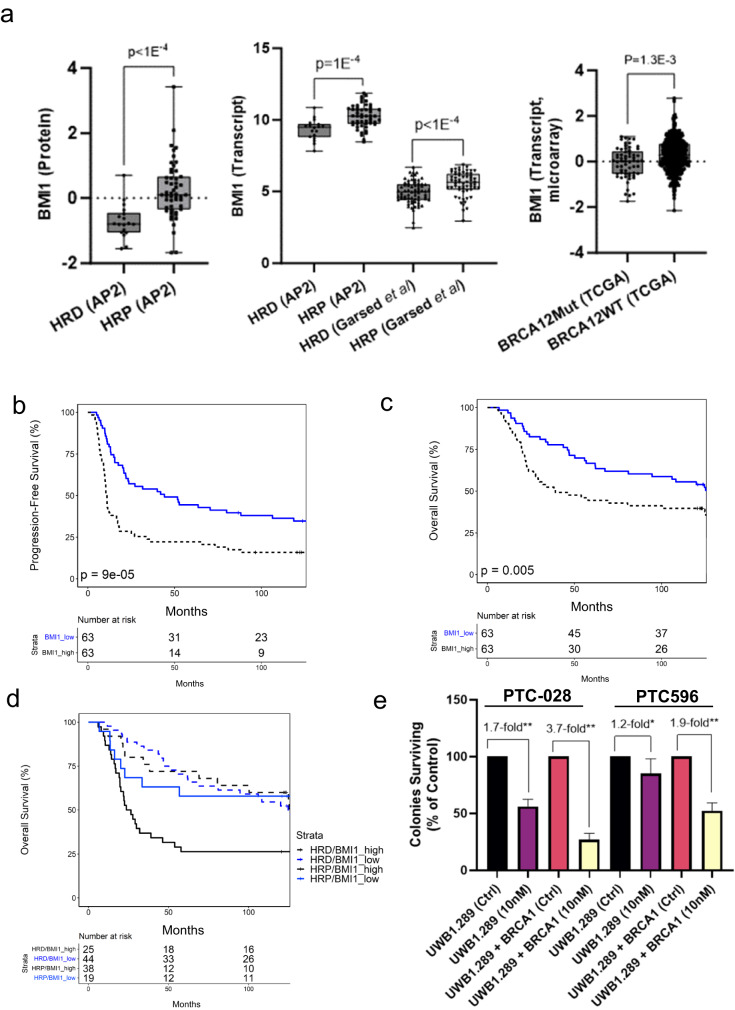
We performed a deep proteogenomic analysis of bulk tumor and laser microdissection enriched tumor cell populations from high-grade serous ovarian cancer (HGSOC) tissue specimens spanning a broad spectrum of purity. We identified patients with longer progression-free survival had increased immune-related signatures and validated proteins correlating with tumor-infiltrating lymphocytes in 65 tumors from an independent cohort of HGSOC patients, as well as with overall survival in an additional 126 HGSOC patient cohort. We identified that homologous recombination deficient (HRD) tumors are enriched in pathways associated with metabolism and oxidative phosphorylation that we validated in independent patient cohorts. We further identified that polycomb complex protein BMI-1 is elevated in HR proficient (HRP) tumors, that elevated BMI-1 correlates with poor overall survival in HRP but not HRD HGSOC patients, and that HRP HGSOC cells are uniquely sensitive to BMI-1 inhibition.


Conflict of interest statement

N.W.B., T.A., D.G., A.P., D.B., T.P.C., and G.L.M. are inventors for a provisional patent application related to findings reported in this manuscript. E.F.P. is a consultant for and shareholder of Perthera, Inc. and a consultant for Theralink Technologies, Inc. M.P. is a consultant for Theralink Technologies, Inc. D.D.L.B. receives grant funding from Genentech-Roche, Astra Zeneca, Beigene, and is a consultant to Exo Therapeutics. G.L.M. is a consultant for Kiyatec, GSK, and Merck. T.P.C. is a ThermoFisher Scientific, Inc SAB member and receives research funding from AbbVie.

Figures

Fig. 1
Fig. 1. Proteogenomic analysis of high-grade serous ovarian cancer (HGSOC).
a Bulk tumor (BT) and laser microdissection (LMD) enriched tumor (ET) epithelium from adnexal (n = 48) and metastatic (n = 22) HGSOC tumor specimens were prepared and DNA, RNA, and protein extracts were profiled by deep whole genome sequencing, RNA sequencing, and proteomics by mass spectrometry and reverse phase protein arrays; LMD was also used to collect stromal cell populations for a subset of cases (n = 48) for proteomics (Created in part with BioRender.com). b Hierarchical cluster analysis of somatic mutations (tumor protein 53, TP53), breast cancer type 1 and 2 susceptibility protein (BRCA1/2), cyclin-dependent kinase 12 (CDK12), copy number variation (cyclin E, CCNE1), SNV, and SV signatures previously investigated in HGSOC, and sum SNV and SV statistics per case in whole genome sequencing (WGS) data from BT collections. c Comparison of gene-wise protein and transcript correlations (5721 protein:transcript pairs) between BT data with HGSOC data from CPTAC HGSOC cohort (Spearman Rho = 0.598, p < 0.0001). d Comparison of protein and transcript correlations by molecular subtypes (ConsensusOV classifications, DIF – differentiated, IMR – immunoreactive, MES – mesenchymal, PRO – proliferative) classified using BT transcriptome data (n = 70) as well as for the CPTAC HGSOC cohort (n = 169); *designates p-values corresponding to Mann–Whitney U (MWU), p < 0.1, ** MWU p < 0.05, *** MWU p < 0.005. e Hierarchical analysis of consensus clusters calculated from the top 25% variably abundant proteins from 70 APOLLO-2 HGSOC BT proteome data. f Kaplan–Meier plot of overall survival in patients with tumors harboring high (MES_Upper: upper quartile, n = 18) versus low (MES_Lower: lower quartile, n = 52) correlation with nine prognostic proteins significantly elevated in MES vs DIF & PRO tumors (Log Rank, p = 0.017). g Kaplan–Meier overall survival curves from a 9-candidate expression signature correlating with differential tumor purity from an independent HGSOC cohort (n = 126) (Log-Rank, p = 0.011).
Fig. 2
Fig. 2. Proteogenomic analysis of high-grade serous ovarian cancers (HGSOC) - characterization of enriched tumor collections.
a Single nucleotide variants (SNVs), insertion/deletion (indel), and structural variants (SVs) identified from whole genome sequencing (WGS) data from laser microdissection (LMD) enriched tumor (ET) cell populations compared to bulk tumor (BT) tissue collections from the same specimen (*p reflects significance of Spearman Rho). b Hierarchical analysis of consensus clusters calculated from top 25% most variably abundant proteins from HGSOC ET proteome data (n = 70). c Sankey plot illustrating the transition of molecular subtypes classified by ConsensusOV in BT and ET transcriptome data. d Correlation analysis of global proteome and transcriptome data (7209 protein:transcript pairs) in BT collections (Spearman Rho = 0.47) is significantly lower (Mann–Whitney U, MWU p = 0.0007) than the correlation (Spearman Rho = 0.52) in ET collections (7598 protein:transcript pairs).
Fig. 3
Fig. 3. Molecular alterations associated with immune cell infiltration, cell heterogeneity, and disease prognosis.
a Hierarchical cluster analysis of 69 proteins and 257 transcripts correlating with progression-free survival (PFS) identified by univariate (continuous Cox and log-rank, p < 0.05) and multivariate analysis, adjusting for patient age, disease stage, and residual disease status (continuous Cox Chi-Square, p < 0.05). b Kaplan–Meier plot of PFS from the four primary patient consensus clusters described in panel (a). c Differential analysis of enriched tumor proteomes in consensus cluster plus (CCP) 2 vs CCP1/3/4 identified 166 significantly altered proteins (LIMMA, adjusted p < 0.05, ±1.5 fold-change). d Classification of disease recurrence risk based on clinical variables, i.e., patient age, disease stage, residual disease status, BRCA1/2 mutation status, and PARP-inhibitor treatment alone (blue line, baseline AUC = 0.701) or in conjunction with exhibiting high correlation with 15 candidate immune signature (AUC = 0.829, P = 0.028). e Kaplan–Meier PFS curves from an analysis of HGSOC long-term survivor tumors with high (n = 61 tumor samples) vs. low (n = 65 tumor samples) correlation with a 15 candidate expression signature of immune cell infiltration (Log Rank, p = 0.036) f Kaplan–Meier overall survival curves from an analysis of HGSOC long-term survivors with high (n = 61) vs. low (n = 65) correlation with a 15 candidate expression signature of immune cell infiltration (Log Rank, p < 0.001).
Fig. 4
Fig. 4. Identification of proteins and transcripts in enriched tumor cell populations associated with homologous recombination deficiency in high-grade serous ovarian cancer.
a Integration of germline and somatic mutation status for breast cancer type 1 and 2 susceptibility protein (BRCA1/2), and classification of tumors as homologous recombination deficient (HRD) or proficient (HRP) by probability of HRD (continuous) by CHORD score and scarHRD. b Top pathways enriched among proteins significantly altered (LIMMA p-value < 0.01) between patient tumors classified as HRD or HRP; default settings in metascape.org. c Differential analysis of enriched tumor cell proteome (left panel) and transcript (right panel) data from HRD (n = 18) vs HRP (n = 51) patients (LIMMA, adjusted p < 0.05). d Correlation analysis of 54 HRD-associated transcripts with an independent cohort of HGSOC patients classified as HRD (n = 69) or HRP (n = 57) by CHORD score (R = Spearman Rho). e Classification of HRD (n = 69) vs HRP (n = 57) tumors using an integrated 54 protein/transcript HRD expression signature in an independent cohort of HGSOC patients (receiver operating characteristic curve, AUC = 0.81, p < 1E−9).
Fig. 5
Fig. 5. Polycomb complex protein BMI-1 is elevated in homologous recombination proficient (HRP) HGSOC tumors and HRP HGSOC cells exhibit increased sensitivity to pharmacologic BMI1 inhibitors.
a BMI1 protein abundance in HRD (n = 18, APOLLO-2, AP2) and HRP (n = 51, AP2) and BMI1 transcript abundance in HRD (AP2 & n = 69, multidisciplinary ovarian cancer outcomes group cohort, MOCOG) and HRP (AP2 & n = 57, MOCOG) as well as in HGSOC tumors with (n = 61, TCGA) or without (n = 391, TCGA) mutations in BRCA1 or BRCA2; p-value reflects Mann–Whitney U rank sum testing. b Progression-free survival curves for HGSOC patients with BMI1 high (BMI1_high, n = 63) versus low (BMI1_low, n = 63) BMI1 transcript levels; p-value reflects Log Rank testing. c Overall survival curves for HGSOC patients with BMI high (BMI1_high, n = 63) versus low (BMI1_low, n = 63) BMI1 transcript levels; p-value reflects Log Rank testing. d Overall survival curves for HGSOC patients with BMI high (BMI1_high) versus low (BMI1_low) BMI1 transcript levels stratified by HRD (n = 69, multivariate p-value = 0.153, log rank p-value = 0.44) and HRP (n = 57, multivariate p-value = 0.02, log-rank p-value = 0.026) status (Supplementary Data 16). e Results from colony survival assays for UWB1.289 and UWB1.289 + BRCA1 treated with BMI1 inhibitors PTC-028 or PTC-596; p-value reflects Mann–Whitney U rank sum testing (**p = 0.0021, *p = 0.04); the results reflect three independent, biological replicate experiments.

References

    1. Siegel RL, Miller KD, Wagle NS, Jemal A. Cancer statistics, 2023. CA Cancer J. Clin. 2023;73:17–48. doi: 10.3322/caac.21763. - DOI - PubMed
    1. Tothill RW, et al. Novel molecular subtypes of serous and endometrioid ovarian cancer linked to clinical outcome. Clin. Cancer Res. 2008;14:5198–5208. doi: 10.1158/1078-0432.CCR-08-0196. - DOI - PubMed
    1. Konecny, G. E. et al. Prognostic and therapeutic relevance of molecular subtypes in high-grade serous ovarian cancer. J. Natl Cancer Inst.10.1093/jnci/dju249 (2014). - PMC - PubMed
    1. Verhaak RG, et al. Prognostically relevant gene signatures of high-grade serous ovarian carcinoma. J. Clin. Invest. 2013;123:517–525. - PMC - PubMed
    1. Bodelon C, et al. Molecular classification of epithelial ovarian cancer based on methylation profiling: evidence for survival heterogeneity. Clin. Cancer Res. 2019;25:5937–5946. doi: 10.1158/1078-0432.CCR-18-3720. - DOI - PMC - PubMed