. 2024 Apr;628(8006):195-203.
doi: 10.1038/s41586-024-07167-9. Epub 2024 Mar 13.

Mitochondrial complex I activity in microglia sustains neuroinflammation

Affiliations

Mitochondrial complex I activity in microglia sustains neuroinflammation

L Peruzzotti-Jametti et al. Nature. 2024 Apr.

Abstract

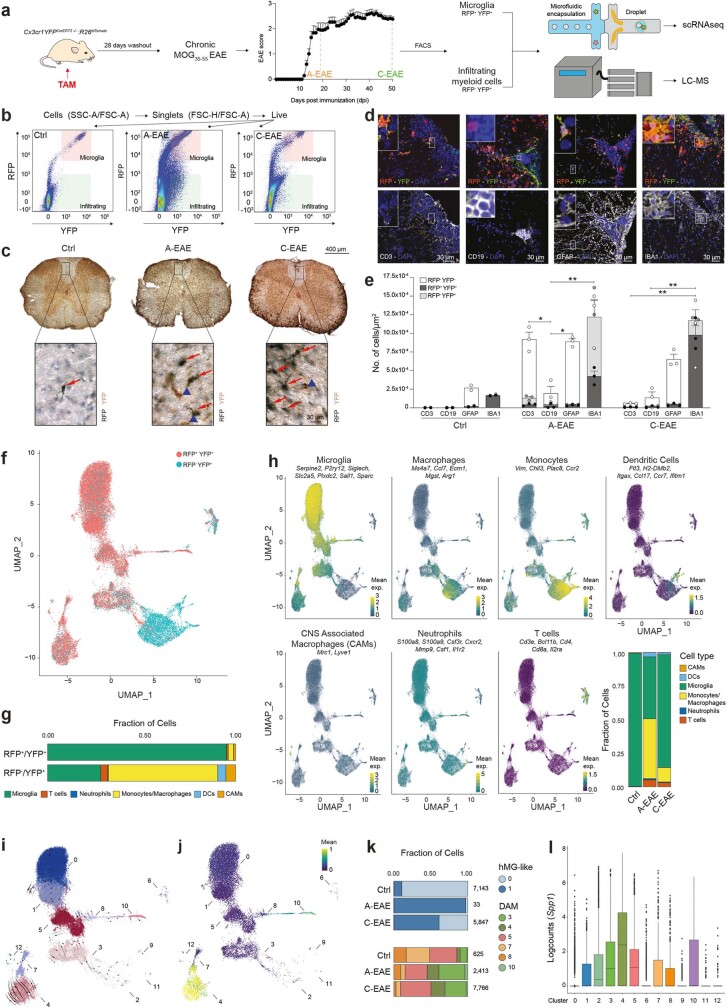
Sustained smouldering, or low-grade activation, of myeloid cells is a common hallmark of several chronic neurological diseases, including multiple sclerosis1. Distinct metabolic and mitochondrial features guide the activation and the diverse functional states of myeloid cells2. However, how these metabolic features act to perpetuate inflammation of the central nervous system is unclear. Here, using a multiomics approach, we identify a molecular signature that sustains the activation of microglia through mitochondrial complex I activity driving reverse electron transport and the production of reactive oxygen species. Mechanistically, blocking complex I in pro-inflammatory microglia protects the central nervous system against neurotoxic damage and improves functional outcomes in an animal disease model in vivo. Complex I activity in microglia is a potential therapeutic target to foster neuroprotection in chronic inflammatory disorders of the central nervous system3.


Conflict of interest statement

S.P. is founder, chief scientific officer and shareholder (>5%) of CITC and chair of the scientific advisory board at ReNeuron. M.P.M. holds a patent for the use of malonate esters to decrease RET in therapeutic situations. Although unrelated to the contents of this Article, A.D. is a founder of Omix Technologies, a founder of Altis Biosciences, a scientific advisory board member for Hemanext and Forma, and a consultant for Rubius. M.P.M. is a founder of Camoxis Therapeutics and a scientific advisory board member for MitoQ. The other authors declare no competing interests.

Figures

Fig. 1
Fig. 1. Microglia show increased mitochondrial CI expression during EAE.
a, scRNA-seq uniform manifold approximation and projection (UMAP) plot obtained from 22,148 cells coloured by EAE stage (6,205 (control), 3,648 (A-EAE), 12,295 (C-EAE)) and fraction of cell types. CAMs, CNS-associated macrophages. b, UMAP plot coloured by clusters and fraction of cells per EAE stage. c, Streamline plot of RNA velocity underlining RNA expression changes within and across different clusters. The arrows indicate the directionality of transcriptional changes. The thickness is proportional to the velocity (that is, amplitude of changes). d, Grouped heat map of the top DEGs for the clusters (plus Siglech and Cx3cr1). The dotted red box highlights DAM cluster 4. e, UMAP plots of the unsupervised subcluster analysis of DAM cluster 4 coloured by subcluster (left) and EAE stage (right). f, The top GO terms (by fold enrichment) of DAM cluster 4 subclusters. g, UMAP analysis of DAM cluster 4 subclusters coloured by the mean counts of mitochondrial CI (left) and CII (right). h, Representative confocal imaging and quantification of EAE lesions, showing the number of SPP1+ cells expressing the NADH ubiquinone oxidoreductase iron-sulfur protein 4 (NDUFS4). From left to right, n = 2, 3 and 3 replicates per group. Data are mean ± s.e.m. Statistical analysis was performed using one-way analysis of variance (ANOVA) with Fisher’s least significant difference (LSD) test; **P < 0.01. Scale bar, 50 μm. i,j, Expression UMAPs of SPP1, P2RY12, and mitochondrial CI and CII genes in human MAMS from two published studies of patients with MS (ref. (i) and ref. (j)). k,l, UMAP and bar chart showing the localization of MAMS in MS lesions and controls from ref. (k) and ref. (l). m, Representative immunofluorescence (out of three) showing rim-specific expression (dotted lines) of NDUFS4+ and SPP1+ myeloid cells (MHC-II+) in consecutive sections of a chronic active lesion from the secondary progressive MS brain. Scale bar, 60 μm. Source Data
Fig. 2
Fig. 2. Ex vivo analysis of myeloid cells shows changes in energy metabolism, oxidative stress and mitochondrial function in EAE.
a, The metabolites significantly altered in A-EAE versus control microglia. n = 5 replicates per group. Statistical analysis was performed using unpaired two-tailed t-tests. b, Corresponding correlation analysis of metabolites indicative of A-EAE versus control microglia. FA, fatty acids; P., phosphate. c, The metabolites significantly altered in C-EAE versus A-EAE microglia. n = 5 replicates per group. Statistical analysis was performed using unpaired two-tailed t-tests. d, Corresponding correlation analysis of metabolites indicative of C-EAE versus A-EAE microglia. GSSG, glutathione disulfide. e, Selected relevant metabolites. a.u., arbitrary units. n = 5 replicates per group. Statistical analysis was performed using one-way ANOVA with Fisher’s LSD test. f, Genes from our scRNA-seq dataset (Fig. 1a) that are involved in itaconate synthesis (Acod1), glycolytic switch (Hif1a), DAM phenotype (Apoe), inflammasome (Nlrp3, Ddx3x, Dhx33, Casp1), antioxidant response (Cybb, Txn1, Sod1) and glutathione (Gsr) in the microglial clusters isolated from control, A-EAE and C-EAE mice. The dotted boxes highlight DAMs. gi, The levels of mitochondrial proteins (g; representative western blot, values are expressed as fold induction over the control), mitochondrial membrane potential (h; Δψm; from left to right, n = 10, 4 and 4 replicates per group) and mitochondrial biogenesis (i; mitochondrial/nuclear DNA ratio; from left to right, n = 3, 4 and 4 replicates per group). Statistical analysis was performed using one-way ANOVA with Fisher’s LSD test. j, Mitochondrial CI and CII activity in ex vivo FACS-isolated microglia and infiltrating myeloid cells. OCR, oxygen consumption rate. From left to right, n = 6, 6, 4, 6 and 5 replicates per group. Statistical analysis was performed using one-way ANOVA with Fisher’s LSD test. k, Quantification of fluorescence intensity of the CellROX probe signal using FACS in isolated microglia and infiltrating myeloid cells treated with rotenone. From left to right, n = 16, 16, 4, 4, 4, 4, 4, 4, 4 and 4 replicates per group. Statistical analysis was performed using one-way ANOVA with Fisher’s LSD test. The box plots in e show the median (centre line), quartiles (box limits), minimum–maximum values (whiskers). The violin plots in hk show the median and quartiles. *P < 0.05, **P< 0.01, ***P < 0.001. Source Data
Fig. 3
Fig. 3. Nd6 mouse point mutation blocks RET and ameliorates EAE.
a, Seahorse metabolic flux analysis of primary microglia derived from wild-type (WT) and Nd6 mice under basal conditions and after stimulation with LPS and IFNγ. n = 4 replicates per group. Statistical analysis was performed using one-way ANOVA with Tukey test. Differences in basal respiration, mitochondrial (mt) ATP production and maximal respiration are reported. b, Quantification of mtROS production in LPS + IFNγ-stimulated (pro-inflammatory) primary WT and Nd6 microglia after RET induction (RET+). From left to right, n = 18, 18, 17, 18, 18 and 18 replicates per group. Statistical analysis was performed using two-way ANOVA with Fisher’s LSD test. c, Quantification of neuronal neurite length after co-culture with RET+ pro-inflammatory primary WT and Nd6 microglia. From left to right, n = 11, 5, 6, 12, 12, 12 replicates per group. Statistical analysis was performed using two-way ANOVA with Fisher’s LSD test. d, EAE scores of WT and Nd6 mice up to 30 days after immunization. n = 17 mice per group. Statistical analysis was performed using two-way ANOVA with Bonferroni correction. e,f, scRNA-seq UMAP plots with each cell coloured according to the genotype, obtained from 13,614 cells (7,501 (WT) and 6,113 (Nd6)). Superimposed cluster numbers and the corresponding fraction of cells are shown for control (e) and EAE (f) mice (30 days after immunization). g, Selected hMG-like and DAM genes in cluster 0 and 1 DAMs. h, The mitochondrial membrane potential (Δψm) in ex vivo FACS-isolated CD45+CD11b+ cells. From left to right, n = 4, 3, 4 and 4 replicates per group. Statistical analysis was performed using one-way ANOVA with Fisher’s LSD test. i,j Representative images and quantifications of perilesional microglial branching (i; n = 12 replicates per group) and IBA1+SPP1+GP91-PHOX+ cells in WT and Nd6 EAE mice (j; n = 4 replicates per group). Statistical analysis was performed using two-tailed unpaired t-tests. For i and j, scale bars, 30 μm. For d, i and j, data are mean ± s.e.m. The violin plots in ac, and h show the median and quartiles. *P < 0.05, **P < 0.01, ***P < 0.001, ****P < 0.0001. Source Data
Fig. 4
Fig. 4. Targeting RET in vivo ameliorates EAE and reduces secondary axonal damage.
a, EAE scores of Ndufs4-WT and Ndufs4-KO mice. n = 10 (WT) and 12 (KO) mice per group. Statistical analysis was performed using two-way ANOVA with Bonferroni correction. b,c, scRNA-seq UMAP plots with each cell coloured according to the genotype, obtained from 10,666 cells (4,180 (Ndufs4 WT) and 6,486 (Ndufs4 KO)). Superimposed cluster numbers and the corresponding fraction of cells are shown for control (b) and EAE (c) mice (50 days after immunization). d, Selected hMG-like and DAM genes in cluster 2 and 6 DAMs. e, Suspension mass cytometry (CyTOF) analysis of immune cell types at 50 days after immunization obtained from 51,177 cells (23,467 (Ndufs4 WT); 27,710 (Ndufs4 KO)). AA, alternatively activated; pro-inflam., pro-inflammatory. f,g, Quantification of CX3CR1+SPP1+ (f; n = 5 replicates per group) and CASPASE3+IBA1+ (g; n = 4 replicates per group) cells in EAE. Statistical analysis was performed using two-tailed unpaired t-tests. hj, In vivo quantification of perilesional microglial branching (h; n = 12 (WT) and 11 (KO) replicates per group; two-tailed unpaired t-test), GP91-PHOX expression in the EAE spinal cords (i; n = 5 (WT) and 6 (KO) replicates per group; two-tailed Mann–Whitney U-test) and IBA1+SPP1+GP91-PHOX+ cells (j; n = 4 replicates per group; two-tailed unpaired t-test). Scale bars, 7 μm (h) and 400 μm (i). k,l, Representative images and quantification of axonal loss (k; n = 5 (WT) and 6 (KO) replicates per group) and axonal degeneration (l; n = 5 replicates per group). Statistical analysis was performed using two-tailed unpaired t-tests. APP, amyloid precursor protein; NHP, neurofilament heavy polypeptide. Insets: merged images. Scale bars, 400 μm (k) and 50 μm (l). m, EAE scores of mice treated with metformin, DMM, DMM + metformin versus saline controls. n = 13 mice per group. Statistical analysis was performed using two-way ANOVA with Bonferroni correction; #P < 0.05 comparing DMM + metformin versus saline. n, CyTOF analysis of immune cell types at 30 days after immunization obtained from 159,110 cells (32,793 (metformin), 40,864 (DMM), 44,143 (DMM + metformin) and 41,310 (saline)). o, Quantification of CX3CR1+SPP1+NDUFS4+ cells, oxidative stress, axonal loss and axonal degeneration in EAE mice. n = 4 replicates per group. Statistical analysis was performed using one-way ANOVA with Tukey test. For a, fm and o, data are mean ± s.e.m. *P < 0.05, **P < 0.01, ***P < 0.001, ***P < 0.0001. Source Data
Extended Data Fig. 1
Extended Data Fig. 1. Characterization of microglia and infiltrating myeloid cells in the Cx3cr1YFPCreERT2:R26tdTomato fate mapping mouse.
a, Experimental design for the ex vivo scRNAseq and LC-MS studies. TAM: tamoxifen. b, Representative flow cytometry plots of RFP+ YFP+ microglia and RFP- YFP+ infiltrating myeloid cells in Ctrl, A-EAE, and C-EAE mice. c, Representative immunohistochemistry of RFP+ YFP+ microglia (black, red arrows) and RFP-YFP+ infiltrating myeloid cells (brown, blue arrowheads) in Ctrl, A-EAE, and C-EAE mice. d, e, Representative (d) images and (e) quantification of the number of CD3+, CD19+, GFAP+ and IBA1+ cells that are RFP YFP, RFP+ YFP+, or RFP- YFP+ in Ctrl, A-EAE, and C-EAE mice (n = 2, 3, 3 replicates per group; mean ± SEM; *P < 0.05, **P < 0.01; one-way ANOVA; Tukey comparing total number of cells). f, UMAP plots from the scRNAseq dataset of cells isolated from the Cx3cr1YFPCreERT2:R26tdTomato mice (see Fig. 1a). Cells (dots) are coloured as RFP+ YFP+ microglia or RFP YFP+ myeloid cells. g, Bar plot showing the fraction of RFP+ YFP+ or RFP YFP+ cells expressing core signature genes of the different cell types. We found that nearly the totality of RFP+ YFP+ cells were transcriptionally microglia. Instead, the majority of RFP- YFP+ cells were transcriptionally infiltrating myeloid cells with only a minority (<25%) expressing microglial marker genes, as described in Jordao et al. and Hamel et al.. h, UMAP plots and quantification of cells expressing core signature genes for microglia, macrophages, monocytes, dendritic cells, CNS associated macrophages (CAMs), neutrophils, and T cells. Cell types were manually assigned based on cluster gene markers and cells are coloured by their mean expression. i, j, k, Unsupervised clustering analysis focused on subpopulations of cells expressing core signature genes for microglia only with (i) RNA directionality, (j) pseudotime, and (k) fraction of cells with a transcriptional signature reminiscent of homeostatic microglia (hMG-like) or disease associated microglia (DAM) in each EAE stage (numbers on the side are total number of cells). l, Spp1 expression in cells isolated ex vivo from Cx3cr1YFPCreERT2:R26tdTomato Ctrl and EAE mice. Box plots of the log2-transformed counts of Spp1 showing its expression in all clusters (median and quartiles from 22,148 cells). Source Data
Extended Data Fig. 2
Extended Data Fig. 2. Glycolysis and oxidative phosphorylation-related genes in myeloid cells isolated from Cx3cr1YFPCreERT2:R26tdTomato Ctrl and EAE mice.
a, Heatmap of the log2-transformed counts of the top 25 differentially expressed genes (rows) involved in glycolysis and oxidative phosphorylation obtained from 22,148 cells (Ctrl = 6,205; A-EAE = 3,648; C-EAE = 12,295). Red text indicates genes of mitochondrial complex I (CI), III (CIII), and IV (CIV). b, c, UMAP plots of the whole scRNAseq dataset coloured by (b) stage of disease and (c) average expression of mitochondrial CI and CII genes (quantification is shown in the bar plots). d, Confocal images and quantification of the number of microglia (RFP+ YFP+) and infiltrating (RFP- YFP+) myeloid cells expressing SPP1 and the marker of oxidative stress GP91-PHOX (n = 2, 3, 3 replicates per group; mean ± SEM; relevant statistical comparisons are shown with *P < 0.05, **P < 0.01, comparing total number of cells, and ##P < 0.01, comparing total number of GP91-PHOX+ cells, two-way ANOVA; Fisher’s LSD). Source Data
Extended Data Fig. 3
Extended Data Fig. 3. ScRNAseq unsupervised subcluster analysis of Cluster 2 isolated from Cx3cr1YFPCreERT2:R26tdTomato Ctrl and EAE mice.
a, Grouped heatmap of the average expression of the top differentially expressed genes for the 5 identified subclusters of Cluster 2. b, ScRNAseq UMAP plots of the subclusters of Cluster 2 coloured by (left) subcluster, (middle) stage, and (right) average expression values of mitochondrial CI genes. c, Top GO terms of the subclusters of Cluster 2.
Extended Data Fig. 4
Extended Data Fig. 4. Human microglia activated in progressive MS (MAMS) display a transcriptional profile reminiscent of mouse Cluster 4 DAM.
a, b, c The transcriptional profile of Cluster 4 DAM was consistent with a population of microglia present in MS patients, as reported in Schirmer et al. . (a) UMAP coloured by the average Cluster 4 DAM gene set expression. (b) Scatter plot comparing log average expressions for shared genes (adjusted R-squared ≈ 0.38; error bands = 0.95 confidence intervals using standard error). Regression coefficient was statistically significant. (c) UMAP showing the cluster of MAMS over the entire microglial population. d, e, f, The transcriptional profile of Cluster 4 DAM was consistent with a population of human microglia present in progressive MS patients, as reported in Absinta et al. . (d) UMAP coloured by the average Cluster 4 DAM gene set expression. (e) Scatter plot comparing log average expressions for shared genes (adjusted R-squared ≈ 0.40; error bands = 0.95 confidence intervals using standard error). Regression coefficient was statistically significant. (f) UMAP showing the cluster of MAMS over the entire microglial population. g, Bubble plot showing the expression of Cluster 4 DAM (and its sub-clusters) genes in human MAMS vs other microglia. h, Bubble plot showing hMG-like, DAM, inflammasome, positive regulation of mitophagy, and antioxidant genes in human MAMS vs other microglia. i, Staging of a representative secondary progressive MS chronic active lesion (also seen in Fig.1n) showing high MHC-II immunoreactivity specific to the lesion rim surrounding a sharply demyelinated plaque (black dotted line), as denoted by PLP staining.
Extended Data Fig. 5
Extended Data Fig. 5. LC-MS analysis of ex vivo isolated microglia and infiltrating myeloid cells and in situ metabolomics.
a, Partial least squares discriminant analysis 3D plot of the intracellular metabolome of microglia and infiltrating myeloid cells (n = 5 replicates per group). b, Heatmap depicting the metabolites (rows) identified via untargeted LC-MS analysis in each biological sample. c, Heatmap showing the 33/121 metabolites found to be significantly differentially regulated when comparing microglia and infiltrating myeloid cells at the different stages of EAE disease (n = 5 replicates per group; P ≤ 0.05, one-way ANOVA). Scale bars are normalized arbitrary units (A.U.). d, Representative haematoxylin and eosin staining (out of 6 spinal cord sections) of Ctrl and A-EAE mice used for LD-REIMS studies. Magnification of infiltrates in α and β is shown on the right. e, Corresponding colorimetric map based on the multivariate analysis of the spatial metabolome of spinal cord sections, as in (d). The infiltrated (I) white matter-WM (defined on haematoxylin and eosin staining) was compared with two areas of normal (N1 and N2) WM. Data in the maps are shown as normalized abundances of the (tissue) spectral component extracted from the multivariate analysis. f, PCA plot of the metabolome of I, N1, and N2 areas (n = 3 replicates per group). g, Heatmap showing the metabolites significantly changed between I, N1, and N2 areas. Data are shown as fold change over the average values of N1 and N2. h, Representative colorimetric maps showing the intensity of the itaconate signal in spinal cord sections as in (d). Data in the maps are shown as normalized abundances. i, Correlation analysis of itaconate with other metabolites (top 5 up/down) from the whole LC-MS dataset. P.: phosphate.
Extended Data Fig. 6
Extended Data Fig. 6. Western blot for mitochondrial proteins, mitophagy genes, and inference of gene regulatory networks (GRNs) using SCENIC.
a, Uncropped and unprocessed scans of the Western blot reported in Fig. 2g (scans are overlayed on the colorimetric pictures to showcase molecular weight markers). b, Bubble plot showing genes positively regulating mitophagy in microglial clusters isolated ex vivo from EAE mice. c, AUC UMAP created on the Cx3cr1YFPCreERT2:R26tdTomato scRNAseq dataset; light blue cells underline the link to the original Cluster 4 DAM (insert). d, AUC UMAP showing scores for the activity of regulons Elf4 (predicted to promote mitophagy and mitobiogenesis by targeting Nrf1, Liu et al. ) and E2f8 (which regulates CI genes by targeting Mybl1, as predicted via g-profiler).
Extended Data Fig. 7
Extended Data Fig. 7. Blocking RET in microglia reduces excessive mtROS production and neurotoxicity in vitro.
a, Experimental design for the in vitro RET studies on LPS/IFNγ stimulated microglia. IMM: inner mitochondrial membrane. b, Qualitative flow cytometry of mtROS production assessed via the MitoSOX probe in unstimulated and LPS/IFNγ stimulated (pro-inflammatory) BV2 microglia after RET induction (RET+). Rotenone is given to block CI activity. c, d, Quantification of (c) mtROS production (n = 18, 18, 10, 18, 18 replicates per group; one-way ANOVA; Tukey) and (d) mitochondrial membrane potential (Δψm) in RET+ pro-inflammatory BV2 microglia (n = 12 replicates per group; one-way ANOVA; Tukey). e, Cytotoxicity assay of BV2 microglia treated with oligomycin or rotenone at the concentrations used for the in vitro experiments (n = 3, 3, 3, 4, 4, 4, 6 replicates per group; mean ± SEM; ***P < 0.001 vs all conditions; one-way ANOVA; Tukey). f, Cytotoxicity assay of BV2 microglia treated with increasing concentrations of the complex I inhibitor S1QEL1.1 in vitro (n = 4, 4, 4, 4, 4, 6 replicates per group; mean ± SEM; *P < 0.05 vs all conditions; one-way ANOVA; Tukey). g, Experimental design for the in vitro microglia-neuronal trans well co-cultures. h, i, Quantification and representative images of (h) CASPASE3 expression (n = 5, 5, 8, 5, 8 replicates per group; one-way ANOVA; Tukey) and (i) neuronal neurite length upon co-culture with RET+ pro-inflammatory BV2 microglia (n = 6, 6, 3, 4, 6 replicates per group; one-way ANOVA; Tukey). j, CATALASE mRNA expression in neuronal cells co-cultured with RET+ pro-inflammatory BV2 microglia (n = 11, 13, 5, 11, 7 replicates per group; one-way ANOVA; Tukey). k, Quantification of neurite length in neuronal cells pre-treated with MitoTEMPO upon co-culture with RET+ pro-inflammatory BV2 microglia (n = 6 replicates per group; one-way ANOVA; Tukey). l, Quantification of neurite length upon co-culture with LPS/IFNγ stimulated microglia (+/− RET induction +/− S1QEL1.1 inhibition) (n = 11, 12, 12, 8, 12 replicates per group; median and quartile values; one-way ANOVA; Tukey). Violin plots show median and quartiles; p values: *P < 0.05, **P < 0.01, ***P < 0.001. Source Data
Extended Data Fig. 8
Extended Data Fig. 8. Blocking RET in human induced microglia (hiMG) reduces excessive mtROS production and neurotoxicity in vitro.
a, Schematic diagram of the hiMG derivation protocol and relative bright field images. b, Representative immunofluorescence staining for IBA1 and CSF1R in hiMG. c, Heatmap showing the expression of top differentially regulated and other relevant genes (logfc > 1, adj pval <0.05, edgeR pipeline) in hiPSCs, intermediate primitive macrophage precursors (PMPs), and differentiated hiMG (n = 3 replicates per group). d, e, (d) PCA analysis and (e) upset plot of the top 1,000 expressed genes comparing the transcriptome of hiMG with previous published protocols used to obtain iPSC-microglia (Chen et al.), hiPSC-microglia (Guttikonda et al.), and post-mortem microglia (Guttikonda et al.). PCA also shows the hiPSCs used to differentiate the hiMG following our protocol. f, Cytotoxicity assay of hiMG treated with oligomycin or rotenone at the concentrations used for the in vitro experiments (n = 4, 4, 4, 4, 4, 4, 5 replicates per group; mean ± SEM; ***P < 0.001 vs all conditions; one-way ANOVA; Tukey). g, h, Quantification of (g) mtROS production (n = 14, 15, 15, 20, 15 replicates per group; one-way ANOVA; Tukey) and (h) Δψm in RET+ pro-inflammatory hiMG (n = 11, 13, 15, 10, 10 replicates per group; one-way ANOVA; Tukey). i, Quantification of neuronal neurite length upon co-culture with RET+ pro-inflammatory hiMG (n = 4 replicates per group, one-way ANOVA; Bonferroni). Violin plots show median and quartiles; p values: *P < 0.05, **P < 0.01, ***P < 0.001. Source Data
Extended Data Fig. 9
Extended Data Fig. 9. WT and Nd6 microglia in vitro and ex vivo scRNAseq characterization of the CNS in WT and Nd6 mice.
a, Quantitative RT-PCR showing the levels of Tnfα, Il1β, Il6, and Inos expression in primary microglia derived from WT or Nd6 mice (n = 5 replicates per group; median and quartile values; two-way ANOVA; Sidak). Data are normalized over WT microglia stimulated with LPS/IFNγ. b, Cytotoxicity assay of WT and Nd6 primary microglia treated after LPS/IFNγ +/− RET induction (n = 6, 6, 8, 6, 6, 5, 8 replicates per group; mean ± SEM; ****P < 0.0001 vs all conditions; one-way ANOVA; Tukey). c, UMAP plot coloured by cluster of cells isolated from WT and Nd6 (healthy Ctrl and EAE at 30 dpi) mice. d, (left) relative proportion of cell types within the 17 clusters and (right) corresponding proportion of cell types in WT vs Nd6 healthy Ctrl and EAE mice. e, Heatmap of the average log2-transformed counts of top differentially expressed genes across the 17 clusters. f, Bubble plot summarizing the expression level of significantly DEGs [belonging to the phagocytosis (GO:0006909), antigen processing and presentation (GO:0019882) and growth factor activity (GO:0008083) pathways] in Cluster 0 and 1 DAM comparing WT vs Nd6 EAE mice. g, Gating strategy to measure mitochondrial membrane potential using the MitoView633 probe in the CD45+Cd11b+ myeloid cells from WT and Nd6 mice. Source Data
Extended Data Fig. 10
Extended Data Fig. 10. Characterization of the Cx3cr1YFPCreERT2:Ndufs4flox/flox mice.
a, Experimental paradigm for the in vivo and ex vivo experiments on Cx3cr1YFPCreERT2−/−:Ndufs4flox/flox (NDUFS4WT) and Cx3cr1YFPCreERT2+/−:Nduf4flox/flox (NDUFS4KO) mice. A 5-day course of intraperitoneal tamoxifen (TAM) injections is used to induce transgene activation. b, Genomic PCR for Ndufs4 in CX3CR1+ cells isolated via FACS from the CNS of healthy NDUFS4KO mice 2 days after TAM or saline treatment (NO TAM). c, Representative flow cytometry showing the NDUFS4 protein expression in CX3CR1+ cells isolated from the CNS of healthy NDUFS4KO mice 30 days after TAM or NO TAM. d, Representative confocal images of NDUFS4 protein expression in CX3CR1+ cells of NDUFS4WT and NDUFS4KO healthy mice 30 days after TAM. e, CI activity in NDUFS4KO EAE mice. TAM treated NDUFS4KO EAE mice showed a 70% reduction of CI activity in CX3CR1+ cells at C-EAE compared to NO TAM (n = 3 replicates per group; *P < 0.05; unpaired t-test, two-tailed). f, UMAP plot coloured by cluster of cells isolated from NDUFS4WT and NDUFS4KO (healthy Ctrl and EAE at 50 dpi) mice. g, (left) relative proportion of cell types within the 14 clusters and (right) corresponding proportion of cell types in NDUFS4WT vs NDUFS4KO healthy Ctrl and EAE mice. h, Heatmap of the average log2-transformed counts of top differentially expressed genes across the 14 clusters. i, Bubble plot summarizing the expression level of significantly DEGs [belonging to the phagocytosis (GO:0006909), antigen processing and presentation (GO:0019882) and growth factor activity (GO:0008083) pathways] in Cluster 2 and 6 DAM comparing NDUFS4WT vs NDUFS4KO mice EAE mice. j, Gating strategy for the CyTOF analyses. k, UMAP plot from the CyTOF data coloured by cell type found in NDUFS4WT and NDUFS4KO EAE mice at 50 dpi. Numbers of clusters are shown in superimposition. A.A.: alternatively activated. The fraction of cell clusters is shown on the right. l, m, Expression of (l) CII and (m) CI in the clusters identified as hMG-like cells and DAM (median and quartiles from 51,177 cells; *P < 0.05, **P < 0.01; unpaired t-test, two-tailed). Source Data
Extended Data Fig. 11
Extended Data Fig. 11. CI and CII inhibitors in vitro and in vivo.
a, Cytotoxicity assay and mtROS production of mouse BV2 microglia treated with selected CI and/or CII inhibitors in vitro. Cytotoxicity assay data are expressed as % of death control from n = 7, 3, 3, 3, 4, 4, 4, 4, 4, 4, 4, 15 replicates per group (first column, top-bottom), n = 8, 4, 4, 4, 4, 4, 4, 4, 4, 4, 4, 15 replicates per group (second column, top-bottom); *P < 0.05 vs death control; one-way ANOVA; Tukey). MtROS data is normalized on RET and shown as % increase or decrease vs RET mtROS baseline (assessed via MitoSOX) from n = 37, 11, 14, 11, 11, 10, 11, 6, 6, 6, 3, 11, 11 replicates per group (first column, top-bottom), n = 46, 11, 14, 11, 11, 18, 17, 5, 6, 6, 3, 18, 18 replicates per group (second column, top-bottom), n = 38, 20, 16, 20, 20, 18, 18, 8, 8, 8, 4, 18, 18 replicates per group (third column, top-bottom); *P < 0.05, **P < 0.01 vs untreated RET+ pro-inflammatory microglia; unpaired t-test, two-tailed. b, Cytotoxicity assay and mtROS production of human induced microglia (hiMG) treated with selected CI and/or CII inhibitors in vitro. Cytotoxicity assay data are expressed as % of death control from n = 8, 4, 4, 4, 4, 4, 4, 4, 4, 4, 4, 16 replicates per group (first column, top-bottom), n = 7, 4, 3, 4, 4, 4, 4, 4, 4, 4, 4, 16 replicates per group (second column, top-bottom); *P < 0.05 vs death control; one-way ANOVA; Tukey). MtROS data is normalized on RET and shown as % increase or decrease vs RET mtROS baseline (assessed via MitoSOX) from n = 27, 10, 10, 10, 10, 6, 6, 8, 8, 8, 8, 6, 6 replicates per group (first column, top-bottom), n = 32, 26, 10, 10, 10, 6, 6, 8, 8, 8, 8, 6, 6 replicates per group (second column, top-bottom), n = 31, 26, 10, 10, 10, 6, 6, 8, 8, 8, 8, 6, 5 replicates per group (third column, top-bottom); *P < 0.05, **P < 0.01 vs untreated RET+ pro-inflammatory microglia; unpaired t-test, two-tailed. c, EAE scores of mice treated with 4-octyl itaconate (4-OI) vs saline controls (n = 6 mice per group; mean ± SEM; two-way ANOVA; Bonferroni). d, e, In vivo testing of dimethyl malonate (DMM) and disodium malonate (DSM) in EAE. (d) EAE mice receiving daily intraperitoneal (IP) injections of DMM (160 mg/kg), DSM (160 mg/kg), or saline at 7 days from disease onset. Malonate levels in the peripheral blood (at 30 min from injection, left; n = 5 replicates per group; mean ± SEM; one-way ANOVA; Tukey) and in the CNS (at sacrifice, right; n = 2 replicates per group; mean). ***P < 0.001. (e) EAE mice receiving DMM (1.5%), DSM (1.5%), or saline dissolved in their drinking water (at 7 days from disease onset). Malonate levels in the peripheral blood during treatment (daily, left; n = 5 replicates per group; mean ± SEM; one-way ANOVA; Tukey) and in the CNS (at sacrifice, right; n = 2 replicates per group; mean). *P < 0.05, **P < 0.01. f, UMAP plot from the CyTOF data at 30 dpi (see also Fig. 4n) coloured by cell type found in EAE mice treated with CII and CI inhibitors. Numbers of clusters are shown in superimposition. A.A.: alternatively activated. g, Fraction of cell clusters in EAE mice treated with metformin, DMM, DMM+metformin, vs saline-treated controls at 30 dpi. h, i, Expression of (h) CII and (i) CI in the CyTOF clusters identified as hMG-like cells and DAM (median and quartiles from 159,110 cells; *P < 0.01, **P < 0.0001; unpaired t-test, two-tailed). j, Representative confocal images and quantification of the expression of the marker of oxidative stress GP91-PHOX in microglia (IBA1+), astrocytes (GFAP+), oligodendrocytes (OLIG2+), and neurons (NEUN+) in the spinal cord of treated EAE mice (n = 4 replicates per group; mean ± SEM; *P < 0.05; one-way ANOVA; Tukey). Abbreviations: rotenone (rot.), metformin (met.), 4-octyl itaconate (4-OI), dimethyl malonate (DMM), disodium malonate (DSM). Source Data

References

    1. Mrdjen D, et al. High-dimensional single-cell mapping of central nervous system immune cells reveals distinct myeloid subsets in health, aging, and disease. Immunity. 2018;48:380–395. - PubMed
    1. O’Neill LA, Kishton RJ, Rathmell J. A guide to immunometabolism for immunologists. Nat. Rev. Immunol. 2016;16:553–565. - PMC - PubMed
    1. Peruzzotti-Jametti L, Pluchino S. Targeting mitochondrial metabolism in neuroinflammation: towards a therapy for progressive multiple sclerosis. Trends Mol. Med. 2018;24:838–855. - PubMed
    1. Jäckle K, et al. Molecular signature of slowly expanding lesions in progressive multiple sclerosis. Brain. 2020;143:2073–2088. - PubMed
    1. Preziosa P, et al. Slowly expanding lesions predict 9-year multiple sclerosis disease progression. Neurol. Neuroimmunol. Neuroinflamm. 2022;9:e1139. - PMC - PubMed

MeSH terms

Substances

LinkOut - more resources