. 2024 Mar;627(8005):854-864.
doi: 10.1038/s41586-024-07171-z. Epub 2024 Mar 13.

Spatially organized cellular communities form the developing human heart

Affiliations

Spatially organized cellular communities form the developing human heart

Elie N Farah et al. Nature. 2024 Mar.

Abstract

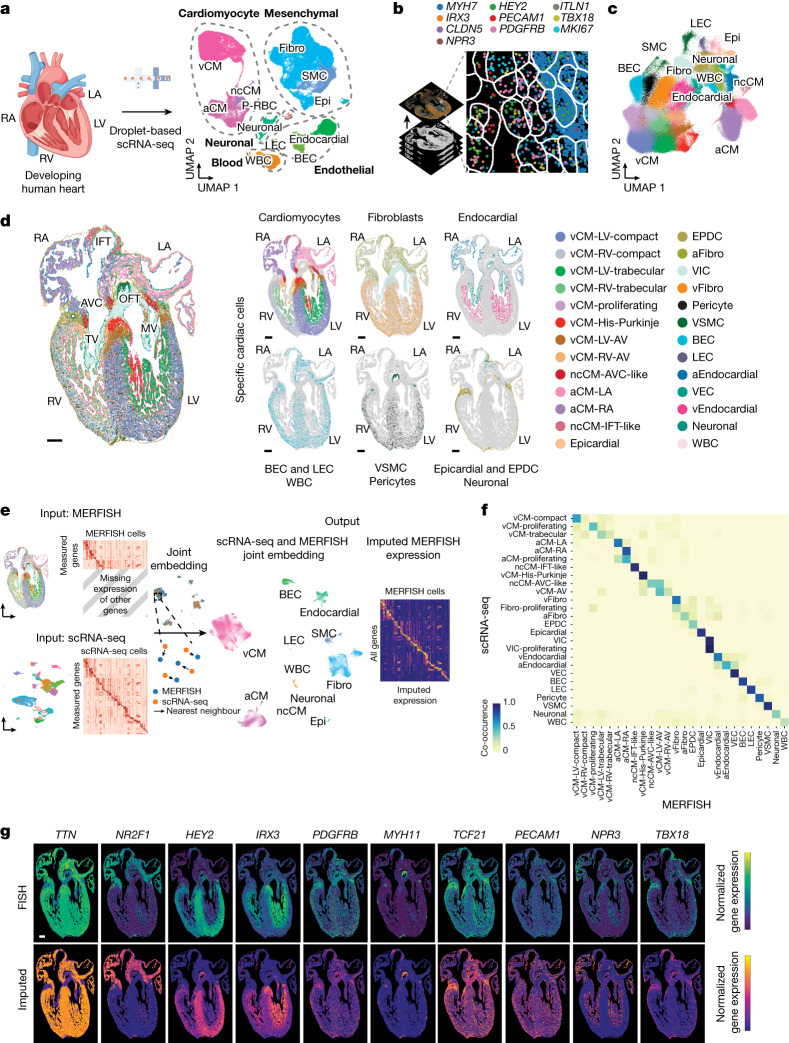
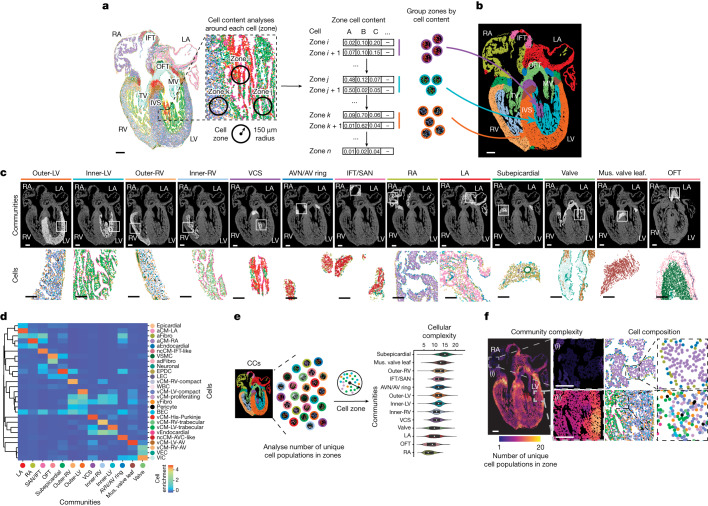
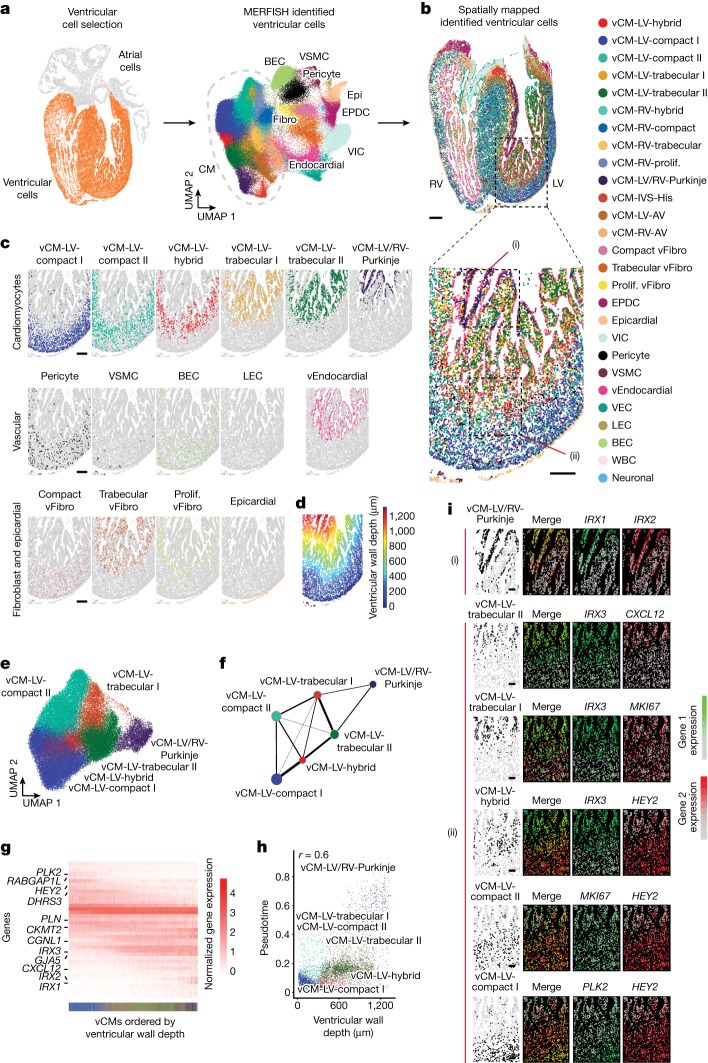
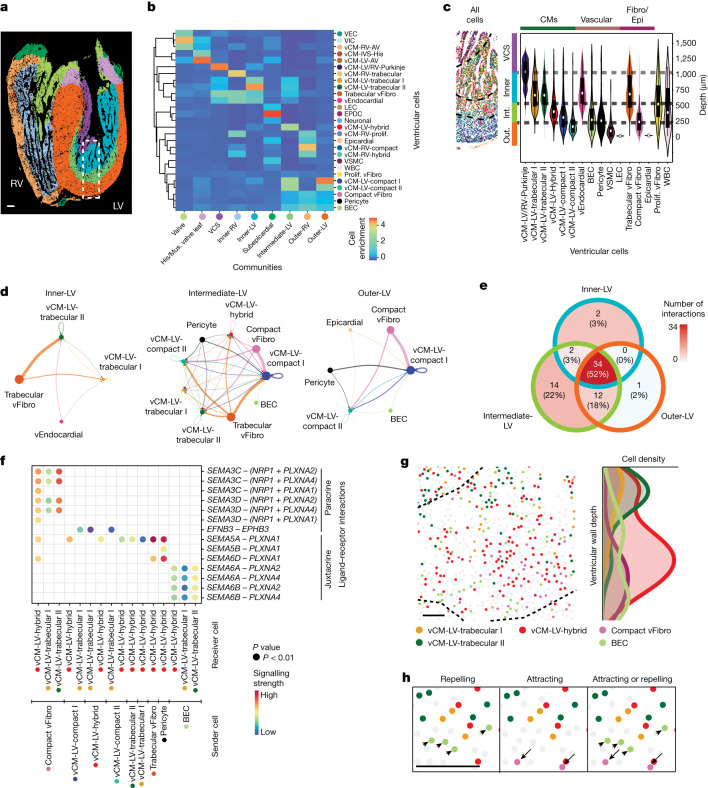
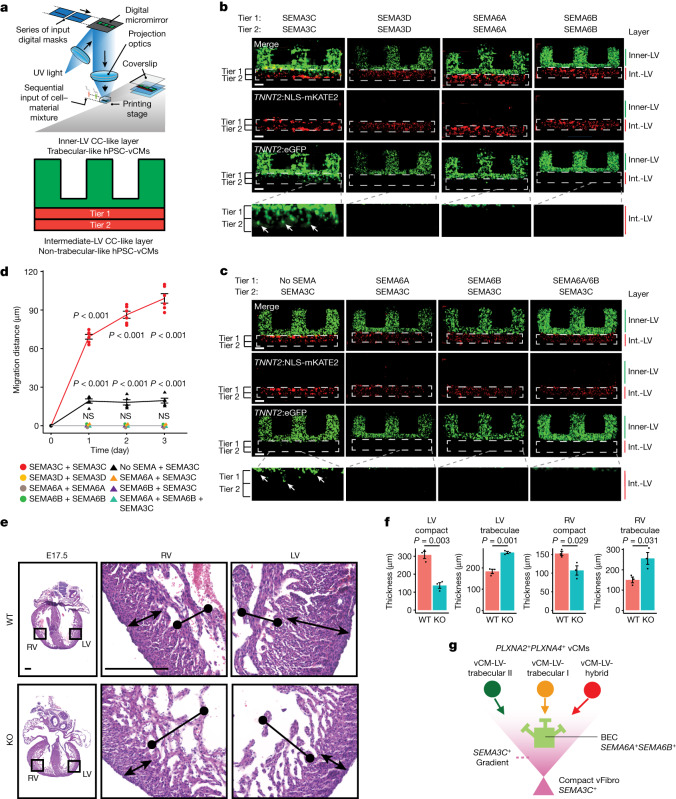
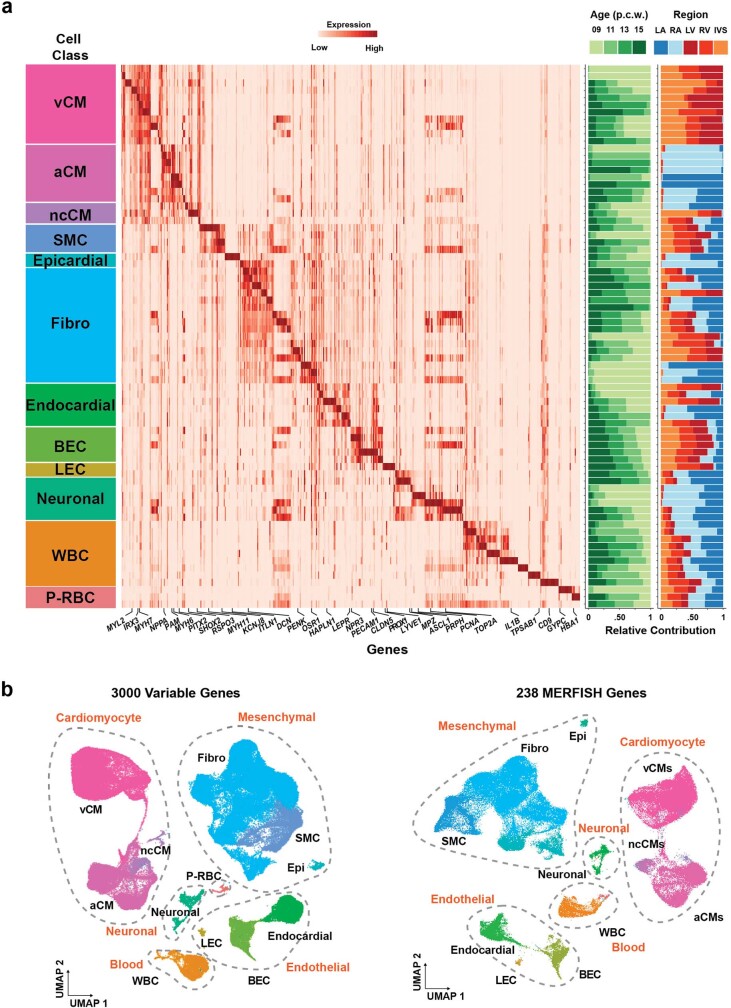
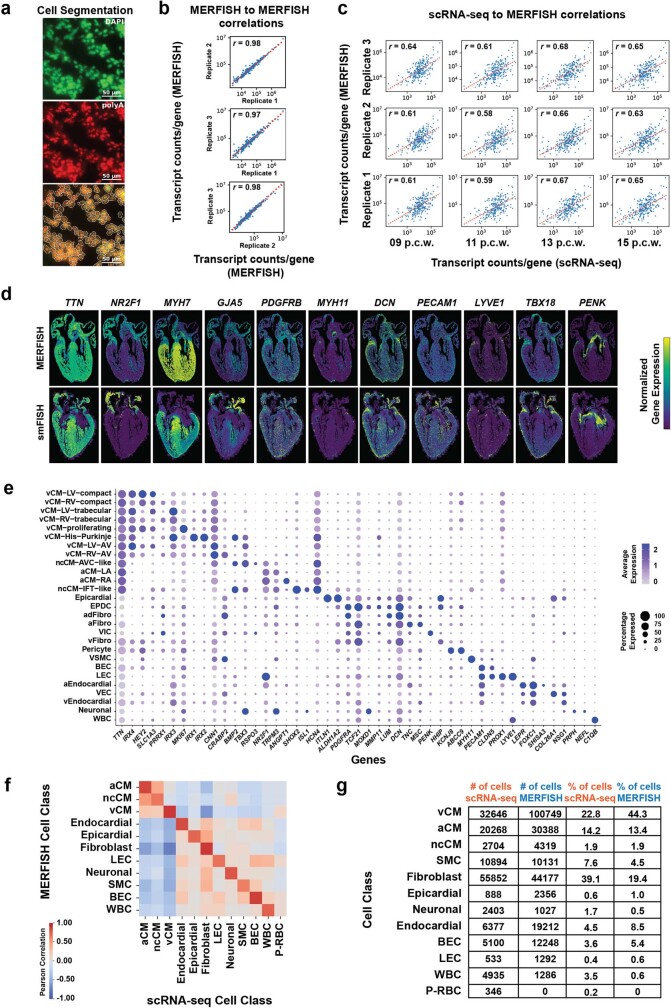
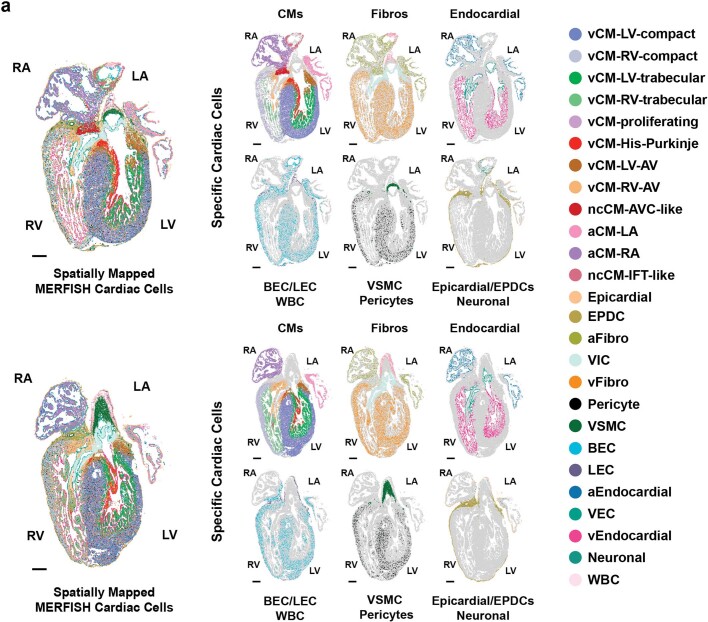
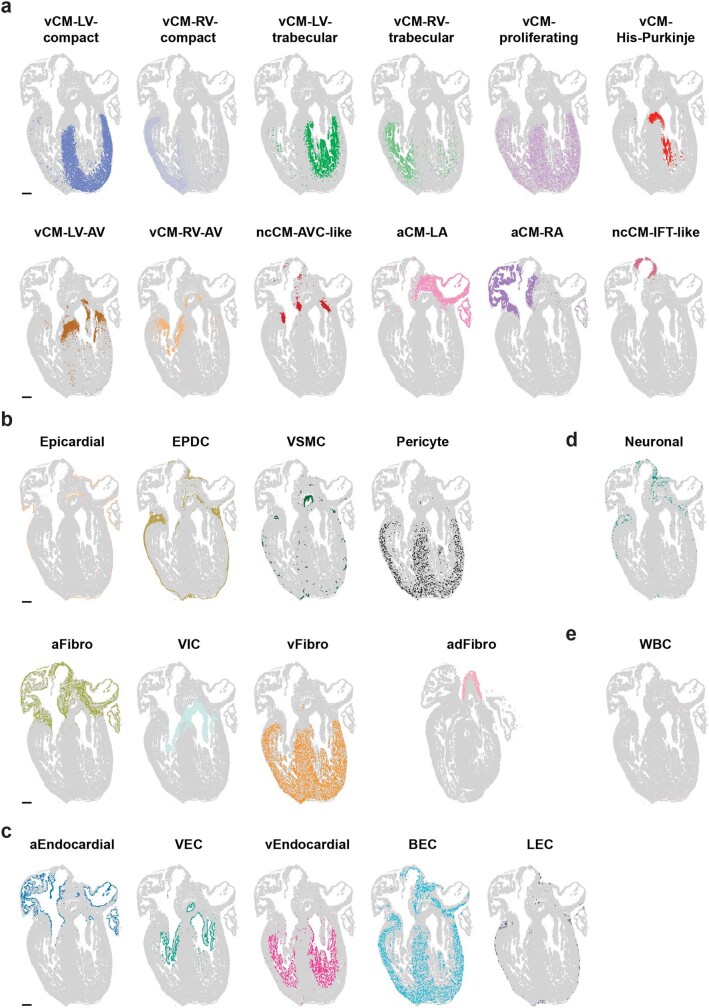
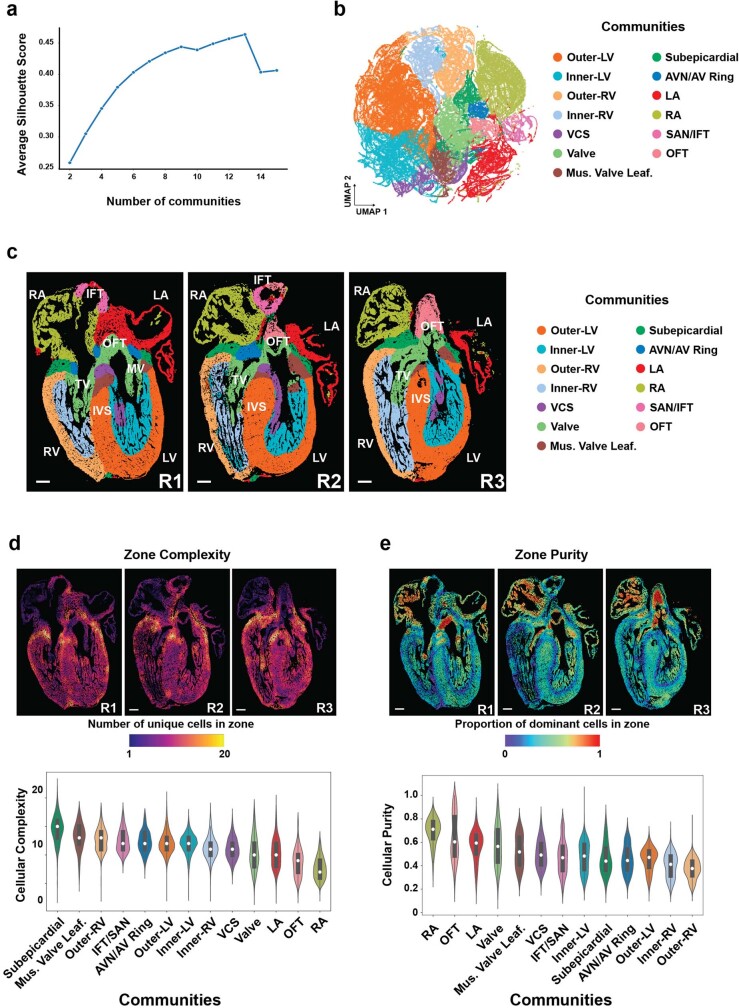
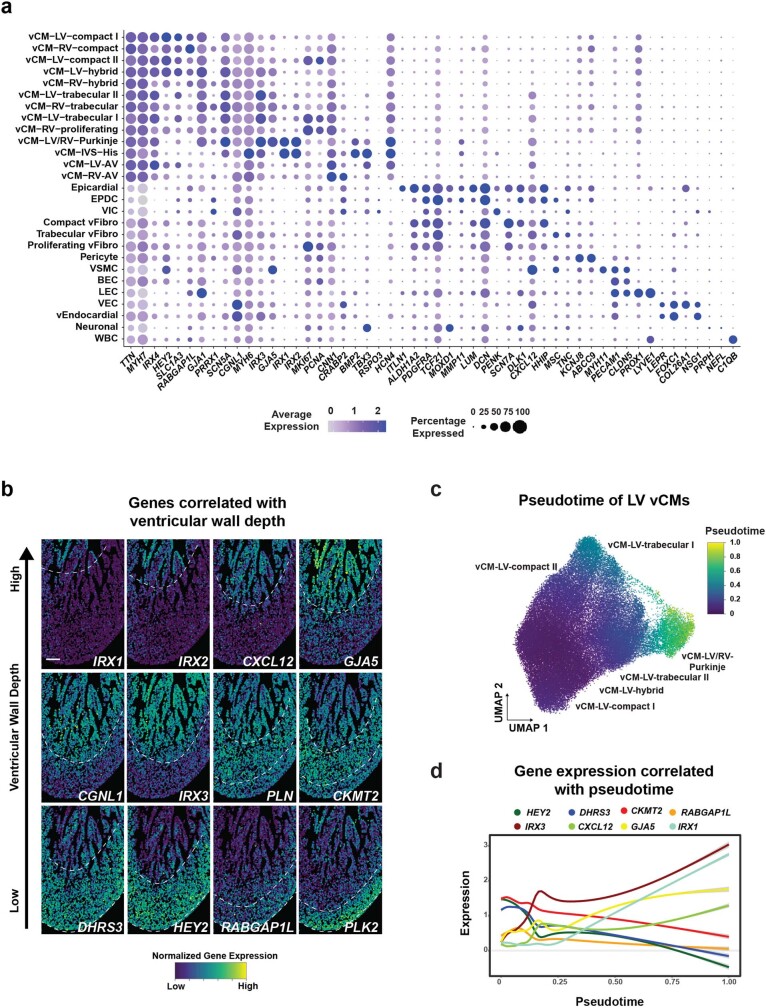
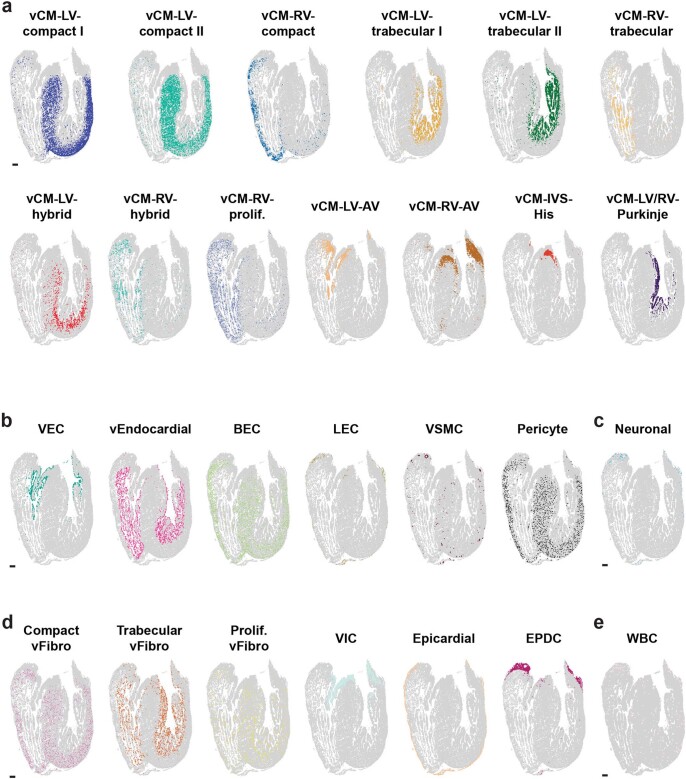
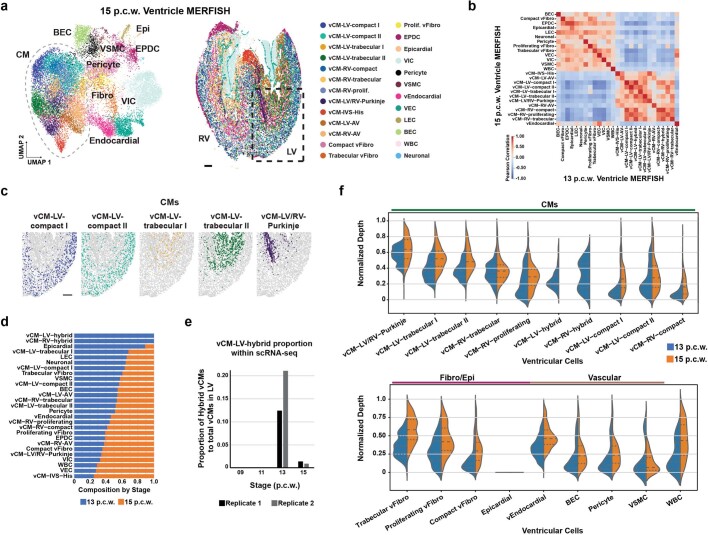
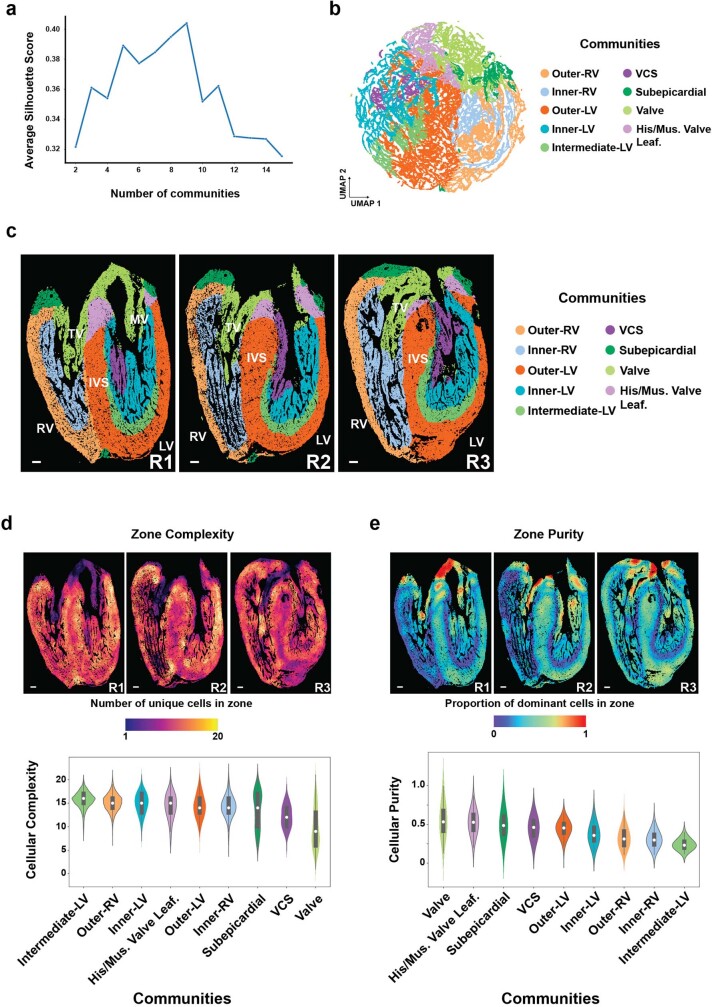
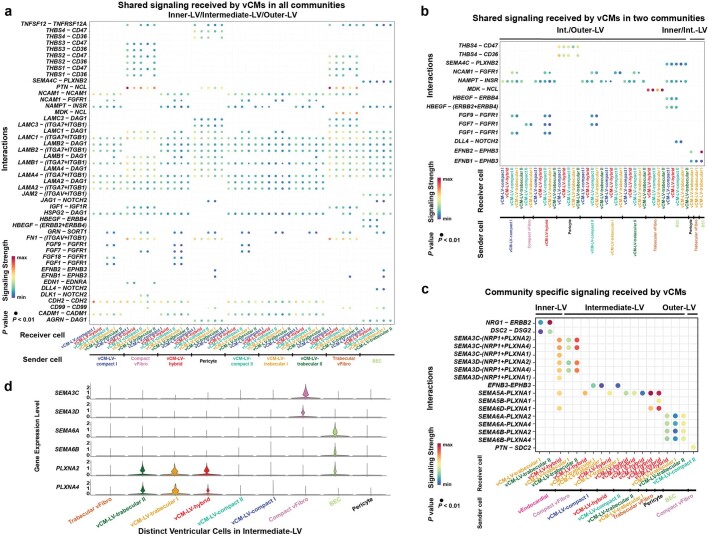
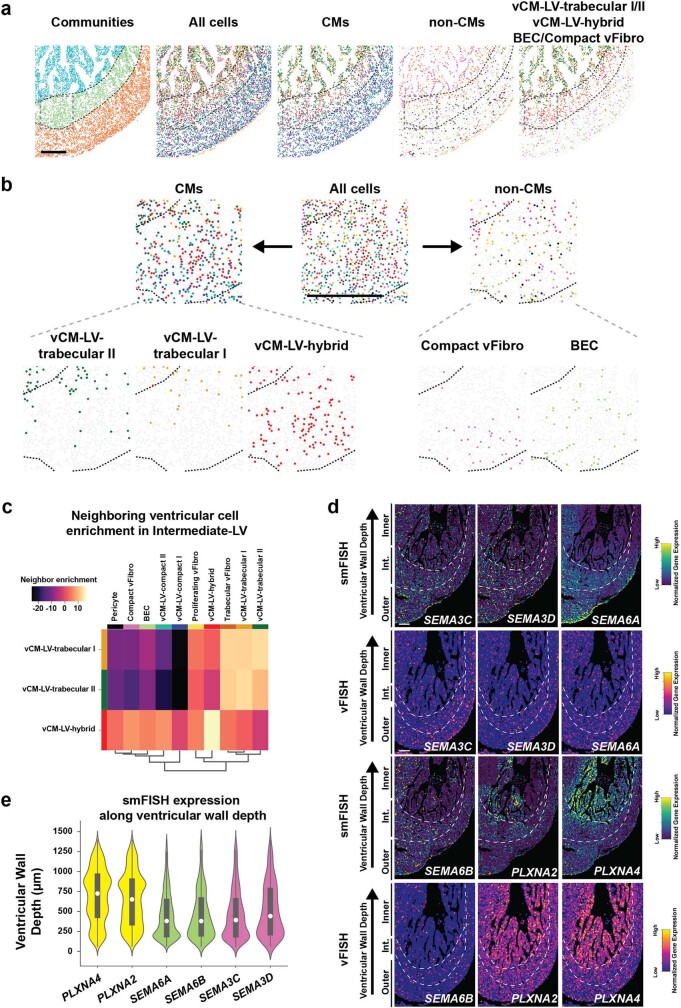
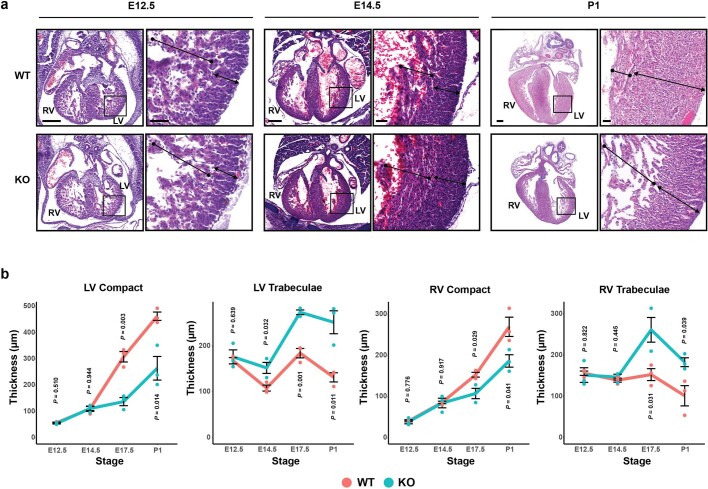
The heart, which is the first organ to develop, is highly dependent on its form to function1,2. However, how diverse cardiac cell types spatially coordinate to create the complex morphological structures that are crucial for heart function remains unclear. Here we integrated single-cell RNA-sequencing with high-resolution multiplexed error-robust fluorescence in situ hybridization to resolve the identity of the cardiac cell types that develop the human heart. This approach also provided a spatial mapping of individual cells that enables illumination of their organization into cellular communities that form distinct cardiac structures. We discovered that many of these cardiac cell types further specified into subpopulations exclusive to specific communities, which support their specialization according to the cellular ecosystem and anatomical region. In particular, ventricular cardiomyocyte subpopulations displayed an unexpected complex laminar organization across the ventricular wall and formed, with other cell subpopulations, several cellular communities. Interrogating cell-cell interactions within these communities using in vivo conditional genetic mouse models and in vitro human pluripotent stem cell systems revealed multicellular signalling pathways that orchestrate the spatial organization of cardiac cell subpopulations during ventricular wall morphogenesis. These detailed findings into the cellular social interactions and specialization of cardiac cell types constructing and remodelling the human heart offer new insights into structural heart diseases and the engineering of complex multicellular tissues for human heart repair.


Conflict of interest statement

B.R. is a shareholder and consultant of Arima Genomics and co-founder of Epigenome Technologies. All other authors have no conflicts of interest.

Figures

Fig. 1
Fig. 1. Molecular and spatial human heart cell atlases reveal a diverse range of cell populations during heart development.
a, Left, schematic of experiment. Right, scRNA-seq identifies a diverse range of distinct cardiac cells that create the developing human heart as displayed by uniform manifold approximation and projection (UMAP) of ~143,000 cells. b, Schematic shows how 238 cardiac-cell-specific genes were spatially identified using MERFISH. Pseudo-coloured dots mark the location of individual molecules of ten specific RNA transcripts. c, Approximately 250,000 MERFISH-identified cardiac cells were clustered into specific cell populations as shown by UMAP and coloured accordingly in d. d, Identified MERFISH cells were spatially mapped across a frontal section of a 13 p.c.w. heart (left) and shown according to major cell classes (right). e, Joint embedding between MERFISH and age-matched scRNA-seq datasets enabled cell label transfer and MERFISH gene imputation. f, Co-occurrence heatmap shows the correspondence of cell annotations of MERFISH cells to those transferred from the 13 p.c.w. scRNA-seq dataset. g, Gene imputation performance was validated spatially by comparing normalized gene expression profiles of marker genes measured by MERFISH with the corresponding imputed gene expression profiles. Epi, epicardial; MV, mitral valve; P–RBC, platelet–red blood cell; TV, tricuspid valve. Scale bar, 250 µm (g). Illustration in a was created using BioRender (https://www.biorender.com).
Fig. 2
Fig. 2. Distinct cardiac cell populations spatially organize into CCs that form specialized cardiac structures.
a, Interrogation of the cell content around each individual cell identified cell zones or neighbourhoods, which formed defined CCs. b, Spatial mapping of CCs onto 13 p.c.w. hearts revealed their correspondence to distinct anatomical cardiac structures. c, The spatial location of each CC is displayed along with examples of their cellular composition and distribution (insets). d, Heatmap shows the composition of identified MERFISH cells within each defined CC. e,f, Analysis of the number of unique cell populations within each zone reveals the cellular complexity of each CC and cardiac region as displayed quantitatively (e, violin plot) and spatially (f, spatial complexity map). For e, the centre white dot represents the median, the bold black line represents the interquartile range, and the edges define minima and maxima of the distribution. Boxed areas in the spatial complexity map show regions of low (i) and high (ii) complexity. Insets (middle show the respective cellular composition, and magnified insets (right) show distinct identified cells). Mus. valve leaf., muscular valve leaflet. Scale bar, 250 µm (b,c,f).
Fig. 3
Fig. 3. The ventricular wall contains distinct specialized cardiac cells spatially organized into unexpected complex laminar layers.
a, MERFISH cells that constitute the ventricles (left, orange) were clustered as displayed using UMAP (right). b, Identified ventricular cells were spatially mapped in 13 p.c.w. ventricles. c, The spatial distributions of specific ventricular cells are shown for the left ventricular wall from the region outlined in the MERFISH spatial map in b. d, The ventricular wall depth distribution of ventricular cells is shown as a measured distance from the epicardial/outer surface of the ventricle for the imaged region in b. e, LV vCMs segregated into distinct vCM subpopulations. f, The molecular relationship of distinct vCMs is displayed in a connectivity map in which weighted edges between nodes represent their connectivity based on gene expression similarity. g, Heatmap shows the normalized expression of differentially expressed genes for vCMs as ordered by increasing ventricular wall depth. The coloured bar at the bottom indicates the specific vCMs as denoted in b. h, Scatter plot reveals the relationship between ventricular wall depth and pseudotime for individual vCMs in the left ventricle. i, MERFISH images of outlined regions in c ((i) and (ii)) show that specific combinations of gene markers, as shown in green and red, spatially identified specific vCMs. Scale bar, 250 µm.
Fig. 4
Fig. 4. Multicellular interactions direct the organization of specific CCs within the ventricular wall.
a, MERFISH-identified ventricular cells assembled into nine more refined CCs within the ventricle. b, Heatmap shows the composition of distinct ventricular cells within each ventricle CC. c, MERFISH image of the outlined area in a reveals CC layers and their cell composition. Violin plot shows the ventricular wall depth distributions for distinct ventricular cells within these layers. The centre white dot represents the median, the bold black line represents the interquartile range, and the edges define minima and maxima of the distribution. Dashed lines indicate boundaries for CC layers. d, Chord diagrams reveal the strength of cell–cell signalling interactions received by specific vCMs in the inner-LV, intermediate-LV and outer-LV CCs. The size of the node represents the number of cells for a distinct ventricular cell, and the width of the edge represents the interaction strength between pairs of specific ventricular cells. e, The Venn diagram shows the number of specific and shared CCIs received by vCMs within the inner-LV, intermediate-LV and outer-LV communities. f, Dot plot shows specific signalling interactions between distinct ventricular cells within the intermediate-LV CC. g, Left, spatial map of cells participating in interactions between SEMA3C, SEMA3D, SEMA6A or SEMA6B with PLXNA2 or PLXN4 for the intermediate-LV CC. Right, normalized ventricular wall depth distribution of these cells is shown in the histogram. h, High-resolution spatial cell map of the intermediate-LV CC shows how cells involved in interactions with SEMA3C, SEMA3D, SEMA6A or SEMA6B with PLXNA2 or PLXN4 signalling may be spatially distributed to mediate attracting or repelling interactions. Arrows and arrowheads point to SEMA3C+SEMA3D+ compact vFibro cells and SEMA6A+SEMA6B+ BECs, respectively. Fibro/Epi, fibroblast and epicardial; His/mus. valve leaf., bundle of His and the muscular valve leaflet; Int., Intermediate; Out., Outer. Scale bars, 50 µm (g,h); 250 µm (a).
Fig. 5
Fig. 5. PLXN–SEMA signalling mediates the migration of trabecular vCMs.
a, NLS-mKATE2+ non-trabecular and GFP+ trabecular-like hPSC-vCMs were bioprinted into multilayered constructs modelling the ventricular wall as shown in the diagram. b, GFP+ trabecular-like hPSC-vCMs migrate to the intermediate ventricular-like layer (Int.-LV), which contains NLS-mKATE2+ non trabecular-like hPSC-vCMs mixed with SEMA3C but not when mixed with SEMA3D, SEMA6A or SEMA6B. White arrows point to GFP+ trabecular-like hPSC-vCMs migrating into the intermediate ventricular-like layer. c, SEMA6A or SEMA6B mixed in different combinations in the intermediate ventricular-like layer prevented SEMA3C-mediated GFP+ trabecular-like hPSC-vCM migration. White arrows point to GFP+ trabecular-like hPSC-vCMs migrating into the intermediate ventricular-like layer. d, GFP+ trabecular-like hPSC-vCM migration measurements under different intermediate-LV CC-like layer conditions. N = 6 and N = 5 independent experiments for SEMA3C+SEMA3C and no SEMA+SEMA3C conditions, respectively. N = 3 independent experiments for all other conditions. Error bars are s.e.m. e, Representative sections of hearts from E17.5 wild type (WT) and Tcf21-creERT2;Sema3cfl/fl knockout (KO) mouse embryos show that deletion of Sema3c in Tcf21+ cells starting at E10.5 leads to a cardiac ventricular wall non-compaction phenotype. f, Graphs show the thickness of the compact and trabecular myocardium in WT and conditionally deleted Sema3c KO mouse hearts. N = 3 mice per condition. Error bars are s.e.m. g, Model shows how PLXN–SEMA interactions among distinct vCMs, fibroblasts and endothelial cells coordinate the organization of vCMs within the ventricular wall. White dashed lines in b and c outline the intermediate-LV CC-like layer. P values in d and f determined by one-way analysis of variance. NS, not significant. Scale bars, 100 µm (b,c) or 250 µm (e). Schematic in a adapted from ref. , Elsevier. Source Data
Extended Data Fig. 1
Extended Data Fig. 1. Each distinct cardiac cell identified in the scRNA-seq dataset can be molecularly defined by a limited number of genes.
a, Heatmap shows specific marker genes, as identified by NS-Forest2 classifier, for the 75 distinct cells across the developing heart. The distribution of these cells is shown according to age and region on bar graph. b, Cardiac single cells identified using the top 3,000 variable genes (left) and the 238 MERFISH genes (right) were visualized by UMAP which show that the transcriptional differences between the cell compartments (grey dashed lines) and classes (colored in a) are preserved with a limited set of genes. aCM, atrial cardiomyocyte; BEC, blood endothelial cell; Epi, epicardial; Fibro, fibroblast; IVS, interventricular septum; LA, left atrium; LEC, lymphatic endothelial cell; LV, left ventricle; ncCM, non-chambered cardiomyocyte; p.c.w., post conception weeks; P-RBC, platelet-red blood cell; RA, right atrium; RV, right ventricle; SMC, smooth muscle cell; vCM, ventricular cardiomyocyte; WBC, white blood cell.
Extended Data Fig. 2
Extended Data Fig. 2. Quality control analyses of MERFISH data reveal its reproducibility and correspondence with scRNA-seq.
a, MERFISH cell boundaries were defined using CellPose with DAPI and polyA staining as input images. b, Pearson correlation of the counts of the 238 MERFISH target genes reveals strong correlation among the three replicate MERFISH experiments (Pearson correlation coefficient (r) > 0.95). c, Pearson correlation of the transcript counts of the 238 target genes shows that the 13 p.c.w. stage displays the highest average correlation (0.67 Pearson correlation) between the MERFISH and scRNA-seq datasets. d, MERFISH imaging was validated spatially by comparing normalized gene expression profiles of marker genes measured by single molecule FISH (smFISH) imaging with those detected by MERFISH imaging. e, Marker gene analysis identified each distinct MERFISH cell. f, Heatmap reveals that cell classes identified in the scRNA-seq dataset are detected in the MERFISH dataset, with the exception of P-RBCs. g, Table shows cellular composition similarities between the scRNA-seq and MERFISH datasets. aCM, atrial cardiomyocyte; aFibro, atrial fibroblast; adFibro, adventitial fibroblast; aEndocardial, atrial endocardial; AVC, atrioventricular canal; BEC, blood endothelial cell; CM, cardiomyocyte; EPDC, epicardial-derived cell; IFT, inflow tract; LA, left atrium; LEC, lymphatic endothelial cell; LV, left ventricle; ncCM, non-chambered cardiomyocyte; p.c.w., post conception weeks; P-RBC, platelet-red blood cell; RA, right atrium; RV, right ventricle; SMC, smooth muscle cell; vCM, ventricular cardiomyocyte; vCM-LV/RV-AV, muscular valve leaflet vCM; vEndocardial, ventricular endocardial; VEC, valve endocardial cell; vFibro, ventricular fibroblast; VIC, valve interstitial cell; VSMC, vascular smooth muscle cell; WBC, white blood cell. Scale bar, 50 µm.
Extended Data Fig. 3
Extended Data Fig. 3. MERFISH cells were reproducibly mapped to distinct spatial regions of the developing heart.
a, Spatial mapping of identified MERFISH cells on two additional 13 p.c.w. frontal heart section replicates reveals the reproducibility of each distinct MERFISH cell and their spatial distributions. aCM, atrial cardiomyocyte; aFibro, atrial fibroblast; adFibro, adventitial fibroblast; aEndocardial, atrial endocardial; AVC, atrioventricular canal; BEC, blood endothelial cell; CM, cardiomyocyte; EPDC, epicardial-derived cell; IFT, inflow tract; LA, left atrium; LEC, lymphatic endothelial cell; LV, left ventricle; ncCM, non-chambered cardiomyocyte; p.c.w., post conception weeks; RA, right atrium; RV, right ventricle; vCM, ventricular cardiomyocyte; vCM-LV/RV-AV, muscular valve leaflet vCM; vEndocardial, ventricular endocardial; VEC, valve endocardial cell; vFibro, ventricular fibroblast; VIC, valve interstitial cell; VSMC, vascular smooth muscle cell; WBC, white blood cell. Scale bar, 250 µm.
Extended Data Fig. 4
Extended Data Fig. 4. Identified MERFISH cardiac cells map to distinct regions and anatomical structures of the human heart.
The spatial mapping of each identified MERFISH cell is displayed accordingly: a, cardiomyocyte related cells, b, epicardial, EPDC, and vascular support related cells, c, endothelial related cells, d, neuronal cells, and e, blood related cells. aCM, atrial cardiomyocyte; aFibro, atrial fibroblast; adFibro, adventitial fibroblast; aEndocardial, atrial endocardial; AVC, atrioventricular canal; BEC, blood endothelial cell; EPDC, epicardial-derived cell; IFT, inflow tract; LA, left atrium; LEC, lymphatic endothelial cell; LV, left ventricle; ncCM, non-chambered cardiomyocyte; RA, right atrium; RV, right ventricle; vCM, ventricular cardiomyocyte; vCM-LV/RV-AV, muscular valve leaflet vCM; vEndocardial, ventricular endocardial; VEC, valve endocardial cell; vFibro, ventricular fibroblast; VIC, valve interstitial cell; VSMC, vascular smooth muscle cell; WBC, white blood cell. Scale bar, 250 µm.
Extended Data Fig. 5
Extended Data Fig. 5. Cell zone analyses reveal the complexity and purity of the cellular communities (CCs).
a, Plot of average silhouette scores reveals that the statistically optimal number of cellular communities is thirteen. b, ~250,000 cell zones were grouped into specific cellular communities as shown by UMAP and colored by community. c, Spatial mapping of these CCs onto three different sections of the 13 p.c.w. (post conception weeks) heart shows the reproducibility of CCs corresponding to specific anatomic cardiac structures. The distribution of (d) cell zone complexity and (e) purity is displayed both spatially for replicate sections of 13 p.c.w. hearts (zone complexity/purity maps) and quantitatively in violin plots. The center white dot represents the median, the bold black line represents the interquartile range, and the edges define minima and maxima of the distribution. AVC, atrioventricular canal; AVN, atrioventricular node; IFT, inflow tract; IVS, interventricular septum; LA, left atrium; LV, left ventricle; Mus. Valve Leaf., muscular valve leaflet; MV, mitral valve; OFT, outflow tract; RA, right atrium; RV, right ventricle; SAN, sinoatrial node; TV, tricuspid valve; VCS, ventricular conduction system. Scale bar, 250 µm.
Extended Data Fig. 6
Extended Data Fig. 6. Gene marker analysis defined distinct ventricular MERFISH cells and their molecular relationship to ventricular wall depth and pseudotime.
a, Gene marker analysis defined MERFISH cells clustered from only the ventricles. b, MERFISH images reveal that spatial expression of genes related to specific vCMs correlate with ventricular wall depth. c, UMAP shows pseudotime of these vCMs within the left ventricular wall. d, Gene expression of specific markers for each distinct vCM is plotted along the pseudotime axis. Colored lines indicate each gene examined (see legend above plots). BEC, blood endothelial cell; EPDC, epicardial-derived cell; IVS, interventricular septum; LEC, lymphatic endothelial cell; LV, left ventricle; RV, right ventricle; vCM, ventricular cardiomyocyte; vCM-LV/RV-AV, muscular valve leaflet vCM; VEC, valve endocardial cell; vEndocardial, ventricular endocardial; vFibro, ventricular fibroblast; VIC, valve interstitial cell; VSMC, vascular smooth muscle cell; WBC, white blood cell. Scale bar, 250 µm.
Extended Data Fig. 7
Extended Data Fig. 7. Distinct ventricular MERFISH cells map to specific regions of the developing human ventricle.
The spatial mapping of each identified ventricular MERFISH cell is displayed accordingly: a, cardiomyocyte related cells, b, vascular support related cells, c, neuronal cells, d, epicardial, EPDC, and fibroblast-related cells, and e, WBC related cells. BEC, blood endothelial cell; EPDC, epicardial-derived cell; IVS, interventricular septum; LEC, lymphatic endothelial cell; LV, left ventricle; Prolif., proliferating; RV, right ventricle; vCM, ventricular cardiomyocyte; vCM-LV/RV-AV, muscular valve leaflet vCM; VEC, valve endocardial cell; vEndocardial, ventricular endocardial; vFibro, ventricular fibroblast; VIC, valve interstitial cell; VSMC, vascular smooth muscle cell; WBC, white blood cell. Scale bar, 250 µm.
Extended Data Fig. 8
Extended Data Fig. 8. MERFISH imaging of 15 p.c.w. ventricles reveals how hybrid vCM subpopulations may dynamically change during development.
a, MERFISH cells composing 15 post conception weeks (p.c.w.) ventricles were clustered as displayed on UMAP (left), and the identified ventricular cells were spatially mapped onto the ventricles and labeled in legend (right). b, Heatmap of transcriptional correlation between the MERFISH ventricular subpopulations shows that the 15 p.c.w. MERFISH dataset contained all cardiac cells previously identified by the 13 p.c.w. MERFISH dataset, except for the vCM-LV-Hybrid and vCM-RV-Hybrid cardiac cell subpopulations. c, The spatial distribution of specific ventricular cardiomyocytes is shown for the left ventricular wall from region outlined in MERFISH spatial map (a). d, Bar graph shows the relative cell composition of 13 p.c.w. and 15 p.c.w. ventricles. e, Bar graph of hybrid vCMs identified at specific scRNA-seq developmental stages reveals the proportion of hybrid vCMs to total vCMs in the LV from 9–15 p.c.w. f, Violin plots show the comparison of normalized ventricular wall depths of distinct ventricular cells within the apical/free walls at 13 p.c.w. and 15 p.c.w. The center dashed line represents the median, the other two dashed lines represent the interquartile range, and the edges define minima and maxima of the distribution. aFibro, atrial fibroblast; BEC, blood endothelial cell; EPDC, epicardial-derived cell; Fibro, fibroblast; IVS, interventricular septum; LEC, lymphatic endothelial cell; LV, left ventricle; Prolif., proliferating; RV, right ventricle; vCM, ventricular cardiomyocyte; vCM-AV, muscular valve leaflet vCM; vCM-LV/RV-AV, muscular valve leaflet vCM; VEC, valve endocardial cell; vEndocardial, ventricular endocardial; vFibro, ventricular fibroblast; VIC, valve interstitial cell; VSMC, vascular smooth muscle cell; WBC, white blood cell. Scale bar, 250 µm.
Extended Data Fig. 9
Extended Data Fig. 9. Cell zone analyses of distinct ventricular cells reveal the complexity and purity of ventricle cellular communities (CCs).
a, Plot of average silhouette scores shows that the statistically optimal number of cellular communities is nine for identified ventricular cells. b, ~180,000 ventricular cell zones were clustered into specific ventricular cellular communities as shown by UMAP and colored by community. c, Spatial mapping of these CCs onto three different sections of the 13 p.c.w. (post conception weeks) heart shows the reproducibility of CCs corresponding to specific anatomic cardiac ventricular structures. The distribution of (d) cell zone complexity and (e) purity is displayed both spatially for replicate sections of the 13 p.c.w. hearts (zone complexity/purity maps) and quantitatively in violin plots. The Intermediate-LV CC exhibits the highest cellular complexity and lowest cellular purity. The center white dot represents the median, the bold black line represents the interquartile range, and the edges define minima and maxima of the distribution. His/Mus. Valve Leaf., bundle of His and the muscular valve leaflet; IVS, interventricular septum; LV, left ventricle; MV, mitral valve; RV, right ventricle; TV, tricuspid valve; VCS, ventricular conduction system. Scale bar, 250 µm.
Extended Data Fig. 10
Extended Data Fig. 10. Ventricular cardiomyocytes interact with distinct ventricular cells to receive signals that may be specific or shared for the left ventricle (LV) cell community (CC) layers.
a, Dot plot shows the interactions received by specific vCMs within the Inner-LV, Intermediate-LV, and Outer-LV CC layers. The dots are colored by signaling strength and based on the expression of the ligand and cognate receptor. b, Dot plot shows shared interactions received by specific vCMs within the Inner-LV/Intermediate-LV and Intermediate-LV/Outer-LV CCs. c, Dot plot shows and compares specific interactions received by specific vCMs within the Inner-LV, Intermediate-LV and Outer-LV CC layers. d, Violin plots show the expression of specific plexins and semaphorins for each distinct ventricular cell within the Intermediate-LV CC. BEC, blood endothelial cell; CC cellular community; Int., intermediate; LV, left ventricle; vCM, ventricular cardiomyocyte; vEndocardial, ventricular endocardial; vFibro, ventricular fibroblast.
Extended Data Fig. 11
Extended Data Fig. 11. Distinct ventricular cells cooperating in plexin-semaphorin signaling display complementary but overlapping spatial distributions within the ventricular wall.
a, The distribution of distinct ventricular cardiac cells participating in SEMA3C/3D/6A/6B - PLXNA2/4 interactions is shown within the left ventricular wall. Cells are colored by community and identity as indicated in Fig. 3b. b, Magnified view of boxed area in (a) reveals how these cells spatially organize in the Intermediate-LV CC. c, Neighborhood enrichment plot of Intermediate-LV CC shows that vCM-LV-Trabecular I, vCM-LV-Trabecular II, vCM-LV-Hybrid are closer to BECs than Compact vFibro. d, smFISH and imputed spatial expression (vFISH) analyses show the spatial gene expression of interacting semaphorin ligands and plexin receptors. e, Violin plot shows the level of expression (smFISH) for each of the semaphorin ligands and plexin receptors across the ventricular wall depth. The center white dot represents the median, the bold black line represents the interquartile range, and the edges define minima and maxima of the distribution. BEC, blood endothelial cell; CC cellular community; CM, cardiomyocyte; Int., intermediate; LV, left ventricle; smFISH, single molecule fluorescent in situ hybridization; vCM, ventricular cardiomyocyte; vFibro, ventricular fibroblast; vFISH, virtual fluorescent in situ hybridization. Scale bar, 250 µm.
Extended Data Fig. 12
Extended Data Fig. 12. Tcf21-creERT2;Sema3cfl/fl knockout mice display hypertrabeculation and relatively thin compact myocardium.
a, Representative hematoxylin and eosin stained frontal sections of hearts from Tcf21-creERT2;Sema3cfl/fl knockout mice at indicated stages show that deletion of Sema3c in Tcf21+ cells starting at E10.5 leads to a progressive cardiac ventricular wall noncompaction phenotype (i.e., hypertrabeculation and thinner compact myocardium), which continues postnatally. Scale bar, 250 µm (50 µm in inset). b, Graphs show the thickness of compact and trabecular myocardium from E12.5 to P1. N = 3 mice per condition. KO, knockout; LV, left ventricle; RV, right ventricle; WT, wildtype. Error bars are s.e.m. P values determined by one-way ANOVA. Source Data

References

    1. Kent AFS. Researches on the structure and function of the mammalian heart. J. Physiol. 1893;14:233–254. doi: 10.1113/jphysiol.1893.sp000451. - DOI - PMC - PubMed
    1. Evans SM, Yelon D, Conlon FL, Kirby ML. Myocardial lineage development. Circ. Res. 2010;107:1428–1444. doi: 10.1161/CIRCRESAHA.110.227405. - DOI - PMC - PubMed
    1. Bruneau BG. The developmental genetics of congenital heart disease. Nature. 2008;451:943–948. doi: 10.1038/nature06801. - DOI - PubMed
    1. Frey N, Olson EN. Cardiac hypertrophy: the good, the bad, and the ugly. Annu. Rev. Physiol. 2003;65:45–79. doi: 10.1146/annurev.physiol.65.092101.142243. - DOI - PubMed
    1. Iung B, Vahanian A. Epidemiology of valvular heart disease in the adult. Nat. Rev. Cardiol. 2011;8:162–172. doi: 10.1038/nrcardio.2010.202. - DOI - PubMed