. 2024 Mar;627(8005):880-889.
doi: 10.1038/s41586-024-07177-7. Epub 2024 Mar 13.

Evolutionary trajectories of small cell lung cancer under therapy

Julie George  1   2 Lukas Maas  3 Nima Abedpour  3   4   5 Maria Cartolano  3   6 Laura Kaiser  3 Rieke N Fischer  7 Andreas H Scheel  8 Jan-Philipp Weber  7 Martin Hellmich  9 Graziella Bosco  3 Caroline Volz  4   6 Christian Mueller  3   10 Ilona Dahmen  3 Felix John  7 Cleidson Padua Alves  3 Lisa Werr  3 Jens Peter Panse  11   12 Martin Kirschner  11   12 Walburga Engel-Riedel  13 Jessica Jürgens  13 Erich Stoelben  14 Michael Brockmann  15 Stefan Grau  16   17 Martin Sebastian  18   19   20 Jan A Stratmann  18   19 Jens Kern  21 Horst-Dieter Hummel  22 Balazs Hegedüs  23 Martin Schuler  20   24 Till Plönes  24   25 Clemens Aigner  23   26 Thomas Elter  4 Karin Toepelt  4 Yon-Dschun Ko  27 Sylke Kurz  28 Christian Grohé  28 Monika Serke  29 Katja Höpker  30 Lars Hagmeyer  31 Fabian Doerr  23   32 Khosro Hekmath  32 Judith Strapatsas  33 Karl-Otto Kambartel  34 Geothy Chakupurakal  35 Annette Busch  36 Franz-Georg Bauernfeind  36 Frank Griesinger  37 Anne Luers  37 Wiebke Dirks  37 Rainer Wiewrodt  38 Andrea Luecke  38 Ernst Rodermann  39 Andreas Diel  39 Volker Hagen  40 Kai Severin  41 Roland T Ullrich  4   6 Hans Christian Reinhardt  42   43 Alexander Quaas  8 Magdalena Bogus  44 Cornelius Courts  44 Peter Nürnberg  45 Kerstin Becker  45 Viktor Achter  46 Reinhard Büttner  8 Jürgen Wolf  7 Martin Peifer  47   48 Roman K Thomas  49   50   51
Affiliations

Evolutionary trajectories of small cell lung cancer under therapy

Julie George et al. Nature. 2024 Mar.

Abstract

The evolutionary processes that underlie the marked sensitivity of small cell lung cancer (SCLC) to chemotherapy and rapid relapse are unknown1-3. Here we determined tumour phylogenies at diagnosis and throughout chemotherapy and immunotherapy by multiregion sequencing of 160 tumours from 65 patients. Treatment-naive SCLC exhibited clonal homogeneity at distinct tumour sites, whereas first-line platinum-based chemotherapy led to a burst in genomic intratumour heterogeneity and spatial clonal diversity. We observed branched evolution and a shift to ancestral clones underlying tumour relapse. Effective radio- or immunotherapy induced a re-expansion of founder clones with acquired genomic damage from first-line chemotherapy. Whereas TP53 and RB1 alterations were exclusively part of the common ancestor, MYC family amplifications were frequently not constituents of the founder clone. At relapse, emerging subclonal mutations affected key genes associated with SCLC biology, and tumours harbouring clonal CREBBP/EP300 alterations underwent genome duplications. Gene-damaging TP53 alterations and co-alterations of TP53 missense mutations with TP73, CREBBP/EP300 or FMN2 were significantly associated with shorter disease relapse following chemotherapy. In summary, we uncover key processes of the genomic evolution of SCLC under therapy, identify the common ancestor as the source of clonal diversity at relapse and show central genomic patterns associated with sensitivity and resistance to chemotherapy.


Conflict of interest statement

R.K.T. is a founder of, and consultant to, PearlRiver Bio, acquired by Centessa, and a shareholder of Centessa; a founder and shareholder of, and consultant to, Epiphanes; a founder, shareholder and CEO of DISCO Pharmaceuticals. M.P. is consultant to DISCO Pharmaceuticals. J.G. is consultant to DISCO Pharmaceuticals and received honoraria from MSD. J.W. participated in advisory boards and received lecture fees from Abion, Amgen, AstraZeneca, Bayer, Blueprint, BMS, Boehringer Ingelheim, Chugai, Daiichi Sankyo, Janssen, Lilly, Loxo, Merck, Mirati, MSD, Novartis, Nuvalent, Pfizer, Pierre-Fabre, Roche, Seattle Genetics, Takeda and Turning Point; and additional research support from BMS, Janssen Pharmaceutica, Novartis and Pfizer. M. Schuler is consultant to Amgen, AstraZeneca, Blueprint Medicines, Boehringer Ingelheim, Bristol Myers Squibb, GlaxoSmithKline, Janssen, Merck Serono, Novartis, Roche, Sanofi, Takeda, received honoraria from Amgen, Boehringer Ingelheim, Bristol Myers Squibb, Janssen, Novartis, Roche and Sanofi and received research funding from AstraZeneca and Bristol Myers Squibb. R.B. received honoraria for lectures and advisory boards for AbbVie, Amgen, AstraZeneca, Bayer, BMS, Boehringer Ingelheim, Illumina, Janssen, Lilly, Merck Serono, MSD, Novartis, Qiagen, Pfizer, Roche and Targos MP/ Discovery Life Sciences. R.B. serves as a member of the board of directors and is a shareholder of Gnothis, Inc. (SE). A.Q. is consultant to Astellas, BMS, MSD, AstraZeneca, Servier and Oncowissen App/TV. R.N.F. received funding from BMS and MSD. J.K. received honoraria from Roche, Sanofi, Boehringer Ingelheim, MSD, BMS/Celgene, Lilly, Takeda, Novartis, AstraZeneca and Pfizer; is consultant to Roche, Boehringer Ingelheim, MSD, BMS/Celgene, Lilly, Takeda, Novartis, AstraZeneca, Pfizer and Janssen; and received travel and congress support from Roche, Sanofi, Boehringer Ingelheim, MSD, BMS/Celgene, Lilly, Takeda, Novartis, AstraZeneca, Pfizer and Janssen. H.-D.H. has participated in advisory board meetings of Amgen and Boehringer Ingelheim, is a steering committee member for Amgen and coordinating or local PI for Amgen, BMS, Revolution Medicines, Boehringer Ingelheim, Merck, Norvatis, AstraZeneca, Dracen, Daiichi Sankyo and AIO-Studien-gGmbH and reports personal fees from Amgen, BMS and Johnson & Johnson. J.P.P. reports personal fees from Apellis/Sobi, Alexion/AstraZeneca, Amgen, Blueprint Medicines, BMS, Boehringer Ingelheim, Gilead, MSD, Novartis, Pfizer, Roche, Sanofi and SwixxBiopharma outside the submitted work. M.K. is consultant to Boehringer Ingelheim, Bayer, BMS, Chugai and Roche and received honoraria from Novartis and Boehringer Ingelheim. L.H. received honoraria and personal fees from Boehringer Ingelheim, BMS, Pfizer, Roche and AstraZeneca. F.J. received scientific support from Merck and AstraZeneca. V.H. is a shareholder of BMS and Johnson & Johnson and received honoraria from Roche, Amgen, Pfizer, Celgene, BMS, Boehringer, Novartis, AstraZeneca and Lilly. F.G. received funding from ASTRA, Boehringer Ingelheim, BMS, Celgene, Lilly, MSD, Novartis, Pfizer, Roche, Takeda, Siemens and GSK; has been appointed speaker for ASTRA, Boehringer, BMS, Celgene, Lilly, MSD, Novartis, Pfizer, Roche, Takeda, Ariad, Abbvie, Siemens, Tesaro/GSK, Amgen and Daiichi Sankyo; and participates in administrative boards for ASTRA, Boehringer, BMS, Celgene, Lilly, MSD, Novartis, Pfizer, Roche, Takeda, Ariad, Abbvie, Tesaro/GSK, Siemens, Tesaro, Amgen and Daiichi Sankyo. C.G. received honoraria from Roche, Sanofi, Boehringer Ingelheim, MSD, BMS/Celgene, Lilly, Takeda, Novartis, AstraZeneca and Pfizer; is consultant to Roche, Boehringer Ingelheim, MSD, BMS/Celgene, Lilly, Takeda, Novartis, AstraZeneca, Pfizer and Janssen; and has received travel and congress support from Boehringer Ingelheim, MSD, Lilly, Takeda, Novartis, AstraZeneca, Pfizer and Janssen. R.T.U. received honoraria from Roche, Boehringer Ingelheim, GSK, PharmaMar and Bayer. C.A. participated on advisory boards and received honoraria from AstraZeneca, Biotest, Bristol Myers Squibb, MSD and Roche; and is a consultant to Ewimed and received research support from Bristol Myers Squibb and PharmaCep—all outside of the submitted work. M. Sebastian reports grants from AstraZeneca; consulting fees from AstraZeneca, Bristol Myers Squibb, Merck Sharp & Dohme, Novartis, Lilly, Roche, Boehringer lngelheim, Amgen, Takeda, Johnson, Merck Serono and GSK; honoraria for lectures from AstraZeneca, Bristol Myers Squibb, Merck Sharp & Dohme, Novartis, Lilly, Roche, Boehringer lngelheim, Amgen, Takeda, Johnson, CureVac, BioNTech, Merck Serono, GSK, Daiichi and Pfizer; travel support from Takeda and Pfizer; and membership of the advisory board of CureVac and BioNTech. J.A.S. reports personal fees from Boehringer Ingelheim, AstraZeneca, Roche, BMS, Amgen, LEO pharma, Novartis and Takeda—all outside of the submitted work. All other authors report no competing interests.

Figures

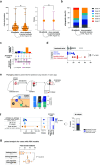
Fig. 1
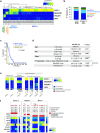
Fig. 1. Tumour samples and clinical history of 65 patients with SCLC.
a, Tumour sites sampled from 65 patients with SCLC. Frequently sampled sites are highlighted in bold. Tumours were acquired either at the time of first diagnosis (treatment-naive) or following initiation of treatment (post-treatment). Tumour samples analysed as patient-derived xenotransplant (PDX) models are indicated. b, Schematic overview of the clinical course of 65 patients with SCLC. Patients were ordered according to their duration of response to first-line platinum-based chemotherapy, referring to a CTFI of 45, 90 and 180 days (National Comprehensive Cancer Network (NCCN) guidelines). Patients who, following initiation of first-line treatment, were either lost to follow-up or underwent surgical resection of the primary tumour were sorted to separate panels. The treatment administered to each patient is annotated and the clinical response is described as either complete response (CR), partial response (PR), stable disease (SD), progressive disease (PD) or mixed response (PR/PD). A detailed description of all clinical characteristics is provided in Supplementary Table 1 and Methods. c, Schematic overview showing the analysis of paired, patient-matched tumour sites: paired studies of spatially distinct tumours at the time of first diagnosis (treatment-naive, n = 16); paired studies of tumour sites pretreatment and during treatment (n = 5) or at clinical relapse following completion of first-line platinum-based chemotherapy (n = 42); paired analyses of spatially distinct tumour sites at relapse (n = 14); and analyses of tumours acquired before and after subsequent lines of treatment with ICIs (n = 7). The scheme shows tumour sites in the lung, referring to primary and metastatic sites (larger and smaller red circles, respectively). LN, lymph node.
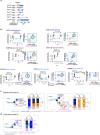
Fig. 2
Fig. 2. Tumour phylogenies and clonal dynamics in 65 patients with SCLC.
a, Schematic of clone phylogeny depicting the most recent common ancestral clone, C0, descending C1, C2 and C3 and subsequent subclones numbered accordingly. b, Phylogeny classes: class A, no subclones; linear phylogenies with one subclone (class B) or at least two subclones (class C); phylogenies with one branching event from C1 subclones (class D) or the common ancestral clone C0 (class E), or at least two branching events (class F). c, Number of samples and distinct time points associated with phylogeny class for each patient (Fisher’s exact test, two-sided, **P < 0.01). d, Tumour phylogenies at distinct clinical scenorios determined for each patient from paired analyses of WES data (samples S1 and S2; Fig. 1c and Methods), sorted according to the number of clones and subclonal mutations (top), showing site-specific CCF of identified clones (intratumour heterogeneity, middle) and phylogeny class (bottom). Cases pre- and post-platinum-based chemotherapy are sorted according to clinical response and exposure of tumour sites to radiation (Rx, green line). Double-headed arrows represent comparisons of distinct samples from the primary tumour and either intrapulmonary metastases (dark blue) or extrapulmonary metastases (light blue), or within intermetastatic sites (red). Asterisks mark samples from PDX models. eg, Subclonal mutations, tumour clones and phylogeny class (median with whiskers representing minimum and maximum values) under distinct clinical scenarios. e, Branching evolution (classes D and E). Fisher’s exact test, two-sided, *P < 0.05. f,g, Spatially distinct sites from treatment-naive setting (f) and pre-/post-first-line platinum-based chemotherapy (g). **P < 0.01; Mann–Whitney U-test, two-sided, not significant. h, Clonal dynamics of patient S02706 for tumours acquired before (S1), after neo-adjuvant chemotherapy (S2) and at relapse (S3). i, Proportion of ancestral C0 or C1 clones in relapsing tumours.
Fig. 3
Fig. 3. Mutation signatures of subclones.
a, Mutational signatures of SBS assigned to clonal (ancestral clone C0) and subclonal mutations in treatment-naive and post-treatment tumours. b, Subclonal mutations determined for multiregional samples from treatment-naive patients (grey, left) and for tumours pre-/post-first-line systemic platinum-based chemotherapy (middle and right). Patients are grouped according to clinical response (middle) and exposure of relapsing tumours to previous radiation. Median and interquartile range, minimum and maximum values. Mann–Whitney U-test, two-sided, *P < 0.05, **P < 0.01. c, Mutational signatures for paired pre-/post-treatment samples from patients receiving chemotherapy. Relative contributions assigned to clonal (grey) and subclonal mutations of pre-therapy (blue) and post-therapy tumours exposed to platinum-based chemotherapy (blue, n = 21) and to additional site-specific radiation (pink, n = 25). Median and interquartile range and whiskers (minimum and maximum values). Paired two-sided Wilcoxon test, **P < 0.01. d, Seven patients were receiving second- or third-line treatment with ICI, and the scheme for their clinical course is shown in Fig. 1b. Waterfall plot showing tumour site-specific response to ICI (lower right). Numbers of private subclonal mutations pre- and post-ICI, grouped according to clinical response (lower right, median with maximum and minimum values). e,f, Clonal dynamics at first diagnosis (treatment-naive, grey box), at relapse following first-line chemotherapy (post-chemotherapy, orange arrows and dashed box) and following treatment with ICI (post-ICI, blue arrows and dashed box). Arrows assigned to branches of clone trees indicate the relative contribution of mutational signatures in ancestral clone C0 and subclones. Site-specific CCFs of tumour clones are plotted. Clinical response to the respective treatment is indicated, distinguishing patients with progressive disease (e) and partial response (f) under ICI. g, Relative contribution of mutational signatures in patients receiving ICI assigned to clonal and subclonal mutations of tumours post-chemotherapy and post-ICI. NS, not significant.
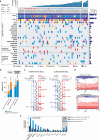
Fig. 4
Fig. 4. Clonal occurence of key gene alterations.
a, Gene alterations referring to significant mutations (*), hotspots (#) and damaging mutations (§), and copy number alterations. NOTCH genes include all alterations affecting NOTCH family members (Methods and Extended Data Fig. 4). Corrected Q <0.05. b, Tumour phylogeny of patient S02814 with mixed SCLC/LCNEC histology harbouring KRAS p.G13D at first diagnosis, and SCLC histology and acquired EP300 p.Q160E at relapse. Additional mutations annotated as ms (missense), fs (frameshift) or ns (nonsense). c, Change in CCF of key gene mutations across distinct tumour samples in a patient (S1, S2, S3) acquired either at first diagnosis (treatment-naive), post-treatment or at relapse. Mutations are shown as either clonal (part of the common most recent ancestor, grey), subclonal with lower CCFs (yellow) or higher CCFs identified in distinct samples (blue). For amplifications, changes in integral copy number (iCN) are plotted for distinct patient-matched samples, indicating either no amplification (white) or focal amplifications (red) exceeding iCN > 5 (red dashed line). d, Scheme for patients with subclonal occurrence of focal MYCL amplifications annotated for sampled tumour sites (dark grey wedges). e, Genome ploidy observed in paired tumours from patients at first diagnosis (treatment-naive) and following chemotherapy (post-chemo., n = 42). Tumours with acquired genome doubling are highlighted (pink, right), and cases with CREBBP/EP300 alterations are indicated (blue). Fisher’s exact test, two-sided, *P < 0.05.
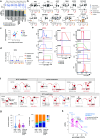
Fig. 5
Fig. 5. TP53 and significant co-alterations impacting chemotherapeutic response.
a, Somatic alterations in TP53. Point mutations mapped to the protein structure (DNA-binding domain, PDB-ID: 2AHI, top). Hotspots (pink, residues annotated), other point mutations (blue) and interaction with DNA (teal) are shown. Damaging gene alterations creating deletions, insertions and destructive transcripts are described (bottom; transactivation and tetramerization domains (TAD, TD, respectively); transcript ID: NM_000546). b, Kaplan–Meier curve of patients grouped for p53 point mutations (blue) and other gene-damaging TP53 alterations (red). Relapse-free survival refers to CTFI and is plotted for patients in this cohort who received only first-line systemic platinum-based chemotherapy (top, n = 55 of 65 patients; grey points, n = 2 censored subjects); and for an independent cohort (bottom, n = 64 patients). Log-rank test, **P < 0.01. c,d, Clinical response (defined as complete response/partial response) to first-line systemic chemotherapy for n = 54 of 65 patients grouped for p53 point mutations and other gene-damaging TP53 alterations. Fisher’s exact test, two-sided, *P = 0.022. Patients with information available for relapse-free survival (n = 53) were grouped for TP53 gene-damaging (n = 22) or p53 point mutations (n = 31) (c) and further stratified for co-alterations in CREBBP/EP300, TP73 or FMN2 (n = 20) or none (n = 11) (d). CTFI range was 45, 90 and 180 days (red, yellow and light blue background, respectively). Boxplot, median and interquartile range, minimum and maximum values. e,f, Relapse-free survival in patients of this cohort receiving only first-line systemic platinum-based chemotherapy (n = 55 of 65, n = 2 patients censored). e, Patients are grouped according to clonal other gene-damaging alterations in TP53 and p53 point mutations that were further stratified for significant co-alterations of CREBBP/EP300, TP73 and FMN2. Cox regression model adjusting for age, sex and tumour stage. HR showing the median and 95% confidence interval (CI). f, Kaplan–Meier curve (n = 55 of 65 patients; grey points, censored subjects, n = 2); log-rank Mantel–Cox test, ***P = 0.0003.
Extended Data Fig. 1
Extended Data Fig. 1. Clonality analysis on tumours from 65 patients with SCLC.
a, Number of subclonal mutations (left panel, box plot displaying median with interquartile range) and number of subclones (right panel, displaying the median); whiskers indicate the range of minimum and maximum value. Mann-Whitney U-test, two-sided, at P < 0.05. NS, not significant. b, the assignment of phylogeny classes (b) for 65 patients with SCLC and for the analyses of n = 84 paired tumour analyses to permit interpatient comparisons for distinct the clinical scenarios described in Fig. 1b (Methods, Supplementary Table 4). c, Patient cases assigned to distinct classes of tumour phylogenies plotting the number of distinct timepoints and samples considered for the assignment. The median is indicated by grey lines. d, Level of subclonal mutations determined from multi-regional samples at relapse, focusing on paired analyses of distinct samples acquired from a given tumour site (n = 9 patients, dark blue) and for spatially distinct inter-metastatic sites (n = 5 patients, red). For comparisons, subclonal mutations determined from spatially distinct sites in treatment-naïve patients (n = 16) are plotted (grey). Data is presented as median with whiskers indicating the interquartile range. Mann-Whitney U-test, two-sided, P** < 0.01. e, Clonal dynamics in patient S02783 with phylogeny class D, tracking tumour clones at the site of the primary after neo-adjuvant chemotherapy (sample S1) and at relapse (samples S2 and S3). The clonal dynamics and the clonal composition are provided for all three samples. f, Level of subclonal diversity determined from the same tumour site (primary tumour, LN or liver metastases) sampled pre- and post-first-line chemotherapy referring to the number of subclonal mutations (left panel), the number of clones (middle panel), and to the assignment of phylogeny classes (right panel). Relapsing tumours revealing ancestral C0 and C1 tumour clones are plotted (figure at the right). Data is presented as median with whiskers indicating the interquartile range. g, Level of subclonality referring to the number of subclonal mutations assigned for distinct clinical settings. The data presented is a subset of the data presented in Fig. 2e, and refers only to cases for which the paired include samples from PDX models. Mann-Whitney U-test, two-sided, P** < 0.01;.
Extended Data Fig. 2
Extended Data Fig. 2. Mutational signatures in 65 patients with SCLC.
a, Relative contribution of mutational processes in treatment-naïve tumours, referring to clonal mutations as part of the common ancestral clone (left panel, determined for n = 58 treatment-naïve patient tumours) and to subclonal mutations (right panel, determined for n = 20/58 patient tumours). Mutational signatures refer to single base substitutions (SBS) defined in COSMIC (Alexandrov et al, Nature 2020; Supplementary Table 5). b, Correlation of the amount of smoking determined as packyears (PY) with the relative contribution of mutational processes defined for clonal mutations. Correlations with tobacco exposure were performed for n = 48 cases for which the amount of smoking was documented. Spearman’s rho correlation coefficient determined, significance at P* < 0.05. c, Activity of mutational signatures assigned to clonal (grey, n = 58) and subclonal proportion of tumours determined for n = 20 treatment-naïve (blue) and n = 35 post-treatment tumours (orange). Data is presented as box plot displaying median with interquartile range and whiskers indicating maximum and minimum values. Mann-Whitney U-tests, two-sided, at P* < 0.05 and P*** < 0.001. Significant differences for all groups are highlighted by dashed boxes. NS, not significant. d, Activity of platinum-based mutational signatures (SBS31, SBS35) in patient-matched paired analysis of the clonal proportion, and the subclonal proportion of treatment-naïve tumours and of tumours after first-line platinum-based therapy. Significance determined for n = 24 patients with pre-/post-therapy tumours, Wilcoxon test, two-sided, P*** < 0.001. Data is presented as box plot showing median with interquartile range and whiskers indicating maximum and minimum values. e, Activity of mutational signatures assigned to the subclonal proportion of post-treatment tumours following first-line platinum-based therapy. Patient samples are grouped according to clinical remissions or stable disease (blue, PR, SD) or progressive disease (red, PD and mixed responses). Mann Whitney U-test, two-sided, significance determined at P* < 0.05, NS not signficant. Data is presented as box plot showing median with interquartile range and whiskers indicating maximum and minimum values. f, Rates of insertions and deletions (indels) versus single base substitutions (SBS), and rates for deletions versus insertions in tumours acquired from treatment-naïve patients and post-treatment following platinum-based chemotherapy without and with additional site-specific exposure to radiation (“no Rx” and “with Rx”). Data presented as box plot with median and interquartile range and whiskers for maximum and minimum value. Ratios were determined for whole genome sequencing data (genome-wide, top plots, Mann Whitney U-test, two-sided,) and whole exome sequencing data (exome-wide, bottom plots, Wilcoxon matched pair test). NS, not significant at P < 0.05. g, Relative contribution of mutational processes assigned to clonal and subclonal mutations in paired studies of pre-treatment (treatment-naïve) and post-treatment tumours following platinum-based chemotherapy (cases, left panel) and additional site-specific exposure to radiation (Rx) (cases, right panel). h, Relative contribution of mutational signatures assigned to platinum chemotherapy (SBS31) for paired studies of tumours from n = 25 patients with subclonal mutations identified in the treatment-naïve setting and after treatment with chemotherapy (post-chemotherapy) and additional site-specific exposure to radiation (Rx). The analysis was performed with CaMuS (Cartolano et al., Scientific Reports, 2020; right plot; Supplementary Table 5, Methods).
Extended Data Fig. 3
Extended Data Fig. 3. Clinical response and clonal dynamics in patients receiving second- or third-line treatment with immunotherapy.
a, Scheme for clinical course of seven patients receiving 2nd or 3rd line treatment with ICI. Annotation as in Fig. 1b. Wedges indicate sample acquisitons at first diagnosis (blue) and pre- and post-ICI (red). b, Clinical response in seven patients receiving 2nd or 3rd line treatment with immune checkpoint inhibitors (ICI). Patients revealed either a stable disease (n = 2), progressive disease (n = 2) or a partial response (n = 3). Timepoints for sample acquisitions are indicated (grey wedges). Site-specific tumour responses are plotted. Genomic analysis of tumours pre- and post-ICI is described as 2-dimensional contour plots in which cancer cell fractions (CCF) for each mutation are plotted and assigned to clusters of mutations as ancestral clones C0 (grey) and subclones (colored dashed circles, compare “Supplementary Appendix-Patient Cases”). c,d, Tumour phylogenies for patients with stable disease (SD, c) or for one patient with partial response (PR, d) following ICI treatment. Samples were acquired at first diagnosis (treatment-naïve, grey box), at tumour recurrence after first-line platinum-based chemotherapy (pre-ICI, red arrows, red dashed box) and after treatment with ICI (post-ICI, blue arrows, blue dashed box). The response to the respective treatment is indicated. Dashed arrows assigned to the branches of the phylogenetic trees refer to the relative contribution of mutational signatures assigned to the common ancestral clone C0 and to subclones. Temporal distinct tumours are numbered S1, S2 and S3, and the site-specific clonal composition is plotted for all samples.
Extended Data Fig. 4
Extended Data Fig. 4. Genomic alterations in 65 patients with SCLC.
a, Significant genome alterations identified in 65 patients with SCLC. Patients are arranged according to the chemotherapy-free interval (CTFI). The response to first-line chemotherapy is annotated as circles referring to complete response (CR, dark blue), partial response (PR, blue), stable disease (SD, light blue), progressive disease (PD, red) and mixed response (PR/PD, orange). Patient cases at the far left received lung resections and at the far right were alive or lost-to-follow up and the first-line response to chemotherapy was not assessed (N/A), Significant mutations and copy number alterations are annotated according to Supplementary Tables 8 and 9. For TP53 and RB1, alterations for alleles A and B are provided. Additional annotation for significant alterations previously published (George et al, Nature, 2015) is provided. Somatic alteration frequencies are provided in the panel on the right side. b, Frequency of genome alterations in TP73 and CREBBP/EP300 identified in a previous cohort enriched for early-stage SCLC (n = 110, George et al, Nature, 2015) and in the present cohort of n = 65 patients with mostly advanced stage SCLC. c, Focal copy number alterations identified in treatment-naïve tumours (left panel) and in post-treatment (right panel). Amplifications are plotted in red, and deletions in blue. Dashed blue lines refer to the significance threshold at corrected Q-values < 0.05. Genes which are part of chromosomal segments with significant focal copy number changes are highlighted. d, Focal copy number loss of the chromosomal segment encompassing TP73. The copy number state is displayed as a heatmap for treatment-naïve and post-treatment tumours. e, Comparisons of somatic mutation frequencies identified in this cohort (blue) with our previous WGS sequencing dataset (dark blue, George et al, Nature, 2015) and with mutation frequencies determined by targeted sequencing panels (Rudin et al., Nat. Rev. Dis. Primers, 2021). Genes affected in more than 5 patients within this current cohort are arranged to the left. Gene alterations which were found to not show expression are displayed on the right. Significant gene alterations are highlighted in bold (marked with *, Supplementary Table 8).
Extended Data Fig. 5
Extended Data Fig. 5. Key genome alterations as part of clonal and subclonal proportions in patient tumours.
a, Clonal occurrence of significantly mutated genes distinguishing alterations as part of the common ancestor or of subclones with mutations identified at high CCFs (blue) or low CCFs (yellow). The respective CCFs were determined for somatic single nucleotide variants occurring affecting key genes (top panel). Data is presented as median with interquartile range and whiskers to minimum and maximum value. b, CCFs determined for significantly mutated genes in distinct tumour samples (S1, S2). Alterations in these genes were assigned to the common ancestor (grey) or identified as subclonal in only one patient case either at higher CCFs (blue) or lower CCFs (yellow). Connected lines describe the change of the CCF of a given mutation across different sites in a patient in the treatment-naïve setting, pre-/post-treatment or at relapse. c, CCFs determined for genomic rearrangements identified in key genes. CCFs were determined with SVclone (Methods) referring to whole genome sequencing data (Supplementary Table 7). All gene alterations were assigned to the clonal proportion of the respective sample. d, Copy number states for TP73 plotting copy number losses of one allele (referred to as the minor allele B with loss of heterozygosity, LOH). Copy numbers were determined as integral copy numbers (iCN) for patient-matched samples (S1, S2, S3). e,f, Copy number states of MYC transcription factors. Copy numbers were determined as integral copy numbers (iCN) and plotted for all samples (S1, S2, S3) analysed in patients with private focal and high-level copy number amplifications. The respective chromosomal position for MYCL (chromosome 1), MYCN (chromosome 2) and MYC (chromosome 8) is indicated and the gene locus is highlighted (pink) (e). A schematic overview of the affected sites in patients with subclonal occurrence of focal MYCL, MYCN and MYC transcription factor amplifications is provided and the sampled tumour site is indicated (dark grey wedges) (f). g, Level of subclonal mutations (left panel) and distribution of phylogeny classes (right panel) in the paired analysis of tumours pre- and post-chemotherapy (n = 42), further distinguishing ploidy states of cancer genomes (lower ploidy with ploidy <2.8, and higher ploidy with ploidy 2.8 or above) and cases which acquired genome doubling. Data is presented as median with interquartile range and whiskers to minimum and maximum value. Two-sided Mann-Whitney U-test, NS, not significant at P* < 0.05. h, Whole genome doubling (WGD) determined according to genome ploidy (y-axis) and the fraction of the genome with LOH (x-axis). The dotted blue line distinguishes tumours with (pink) and without (white) genome doubling, following previously described approaches (Dentro et al., Cell, 2021; Bielski et al. Nature Genetics, 2018). Connected lines refer to paired tumours pre- and post-treatment. Sample IDs are provided highlighting in blue patients with CREBBP/EP300 alterations.
Extended Data Fig. 6
Extended Data Fig. 6. Genome alterations in TP73, CREBBP/EP300 and novel key genes.
a, Protein sequence alignment of p53 family members referring to the DNA binding domain of p53 (NP_000537), p63 (NP_003713) and p73 (NP_005418). Conserved residues are highlighted in dark blue. Orange boxes indicate hotspot residues in p53 (Stiewe et al., Drug Resistance Updates, 2018), for which equivalent positions in p73 were mutated in our cohort. b, Overview TP73 alterations. Patient samples identified with genome alterations are indicated. Recurrent changes included TP73-deltaEx2/3 (George et al., Nature 2015), and mutations affecting residue R293. c, Schematic representation of protein domains in Crebbp and Ep300 with information on mutated regions identified in CREBBP (annotated above) and in EP300 (annotated below). Damaging alterations are highlighted in red. Hotspot and damaging alterations are presented in bold. Mutations found in tumours with acquired whole genome doubling during treatment are highlighted in blue. d, Expression levels of key gene alterations in EPHB1 and CNTNAP2 identified in the combined analysis of this cohort and earlier studies (Supplementary Table 8). Gene expression levels were determined based on the transcriptome data of SCLC tumours (n = 81, George et al., Nature 2015), and displayed as median with interquartile range and whiskers to minimum and maximum value. e, Schematic representation of mutated residues affecting protein domains in EPHB1 (left panel) and CNTNAP2 (right panel). Patient samples identified with genome alterations are indicated. Samples denoted with § were studied as part of earlier cohorts (George et al., Nature 2015).
Extended Data Fig. 7
Extended Data Fig. 7. Gene expression of key lineage transcription factors in SCLC.
a,b Expression of the four key lineage transcription factors ASCL1, NEUROD1, POU2F3 and YAP1 in our cohort (n = 52 patients), categorized as: ASCL1+, ASCL1+/NEUROD1+ double-positive, mainly NEUROD1+ and mainly POU2F3+ positive tumours (heatmap representation, a). The distribution of patient samples with the expression of key transcription factors to an independent larger cohort of n = 81 samples (George et al. Nature 2015, b). c,d Kaplan-Meier curve and Cox regression model for relapse-free survival in patients stratified according to the expression of key transcription factors. c, Log-rank Mantel-Cox test at P*** = 0.0009, d,Significant associations are highlighted in bold. Hazard ratios (HR) were determined at 95% confidence interval and significance was determined by Log-rank tests at P** < 0.01. e, Expression of ASCL1, NEUROD1, POU2F3 and YAP1 in patient-matched spatially or temporally distinct tumours. Samples were analysed across distinct sites in treatment-naïve patients, or pre- and post-treatment with platinum-based chemotherapy or immune checkpoint inhibition (ICI). Sampled tumour sites and the response to the respective treatment is indicated. f, Expression of MYC transcription factor family members and lineage transcription factors in cases found with focal and high-level amplification of MYC genes in at least one of the multi-regional tumour sites. Sample names and the MYC gene amplification status is provided in the top panel further indicating if the tumour was samples in the treatment-naïve setting or at relapse after treatment with platinum-based chemotherapy. The expression levels are provided as a heatmap.
Extended Data Fig. 8
Extended Data Fig. 8. Genomic alterations associating with duration of response to first-line platinum-based chemotherapy.
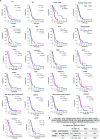
a, Kaplan-Meier curves of relapse-free survival for patients with SCLC receiving first-line systemic treatment with platinum-based chemotherapy. Patient were grouped based on clinical variables and significant genome alterations identified in Extended Data Fig. 5. P-values and hazard ratios determined by Log-rank tests and at 95% confidence interval univariable Cox regression models. b, Backward Wald tests within Cox models (retention threshold P < 0.05, two-sided) testing all genome alterations described in (a).
Extended Data Fig. 9
Extended Data Fig. 9. Associations of TP53 and other key patterns with duration of response to first-line platinum-based chemotherapy.
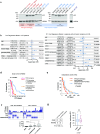
a, p53 protein expression in tumour cell lysates of this cohort. Western blot analysis probing with anti-p53 and anti-HSP90 (loading control). TP53 alterations resulting in gene damaging (red) or other point mutations (blue) are indicated. Lysates of the NSCLC cell line A549 served as a control for wild-type p53 (right lane). Samples were analyzed on two blots, quantitave comparisons are performed on the same blot. Gel source data, see Supplementary Fig. S1. b,c Cox regression model for relapse-free survival in patients (n = 53) with SCLC stratifying for gene alterations in TP53 and adjusting for age, sex and stage (b), and analyzing those patients without gene damaging alterations in TP53 (n = 30) (c) with respect to significant genome alterations and clinical variables. Significant associations are highlighted in bold. Hazard ratio (HR) displaying median, 5% and 95% confidence intervals. Log-rank Mantel-Cox test at P* < 0.05, P** < 0.01 and P*** < 0.001. d–e, Genome alterations significantly associating with an increased hazard of disease recurrence for patients receiving first-line systemic therapy with platinum-based chemotherapy referring to the current study cohort (n =  n = 55/65 patients, Kaplan-Meier curve: grey points for censored subjects n = 2). Log-rank tests at P*** < 0.001 (d), and for the independent cohort of patients with SCLC (e). f, TP53, FMN2, TP73 and CREBBP/EP300 alteration status in patients receiving first-line systemic treatment with chemotherapy (n = 55). Cases are arranged from left to right, and the chemotherapy-free interval (CTFI) is provided for each patient (*n = 2 patients censored). The bar graph at the bottom plots the CTFI for patients with TP53 point mutations grouped according to the indicated co-alterations. Data is presented as median with interquartile range and whiskers to minimum and maximum value, P* = 0.036; Mann-Whitney U-test, two-sided. g, Associations of male and female patients with the smoking status documented as “former” or “current” smoker (Fisher’s exact test, P* < 0.05; left panel). The smoking quantity as measured by the number of packyears is plotted for male and female patients with median and interquartile range, whiskers to minimum and maximum value (Mann-Whitney U-test at P* < 0.05, two-sided; right panel). n.s. = not significant.

References

    1. Gazdar AF, Bunn PA, Minna JD. Small-cell lung cancer: what we know, what we need to know and the path forward. Nat. Rev. Cancer. 2017;17:725–737. doi: 10.1038/nrc.2017.87. - DOI - PubMed
    1. Zugazagoitia, J. & Paz-ares, L. Extensive-stage small-cell lung cancer: first-line and second-line treatment options. J. Clin. Oncol. 40, 671–681 (2022). - PubMed
    1. Howlader N, et al. The effect of advances in lung-cancer treatment on population mortality. New Engl. J. Med. 2020;383:640–649. doi: 10.1056/NEJMoa1916623. - DOI - PMC - PubMed
    1. Rudin, C. M., Brambilla, E., Faivre-Finn, C. & Sage, J. Small-cell lung cancer. Nat. Rev. Dis. Primers7, 3 (2021). - PMC - PubMed
    1. George J, et al. Comprehensive genomic profiles of small cell lung cancer. Nature. 2015;524:47–53. doi: 10.1038/nature14664. - DOI - PMC - PubMed

MeSH terms