. 2024 Apr;628(8006):154-161.
doi: 10.1038/s41586-024-07185-7. Epub 2024 Mar 13.

APOE4/4 is linked to damaging lipid droplets in Alzheimer's disease microglia

Affiliations

APOE4/4 is linked to damaging lipid droplets in Alzheimer's disease microglia

Michael S Haney et al. Nature. 2024 Apr.

Abstract

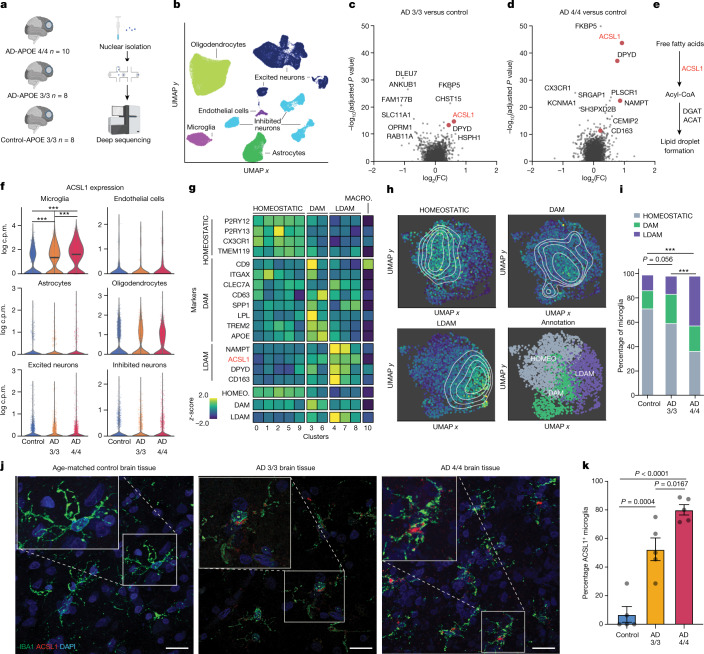
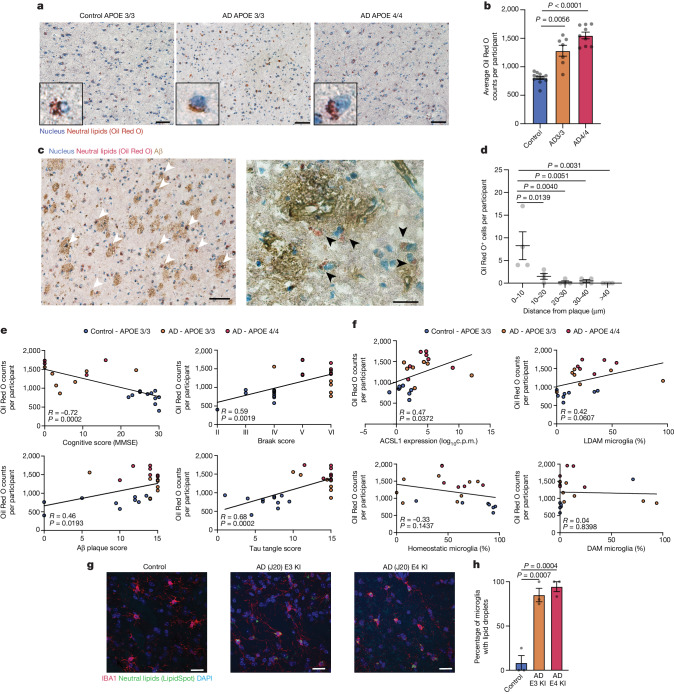
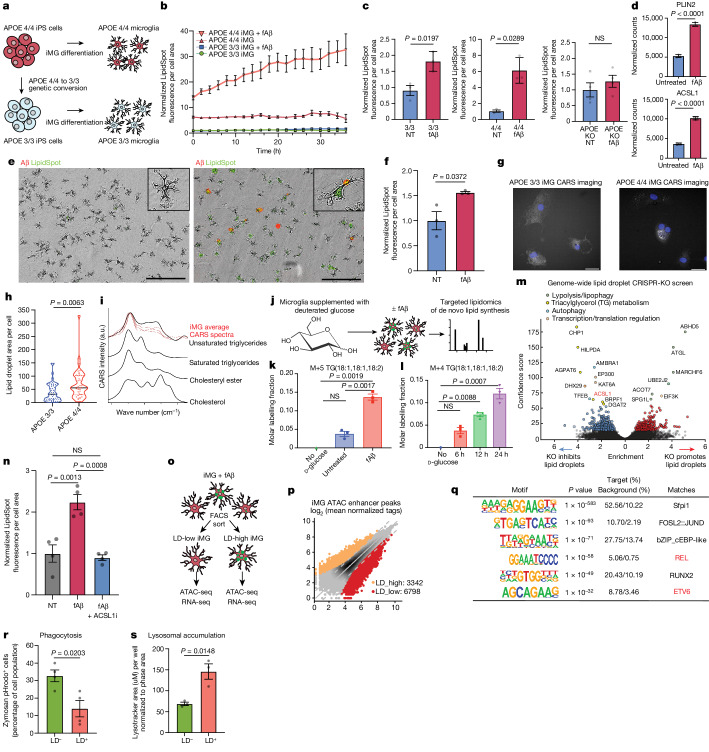
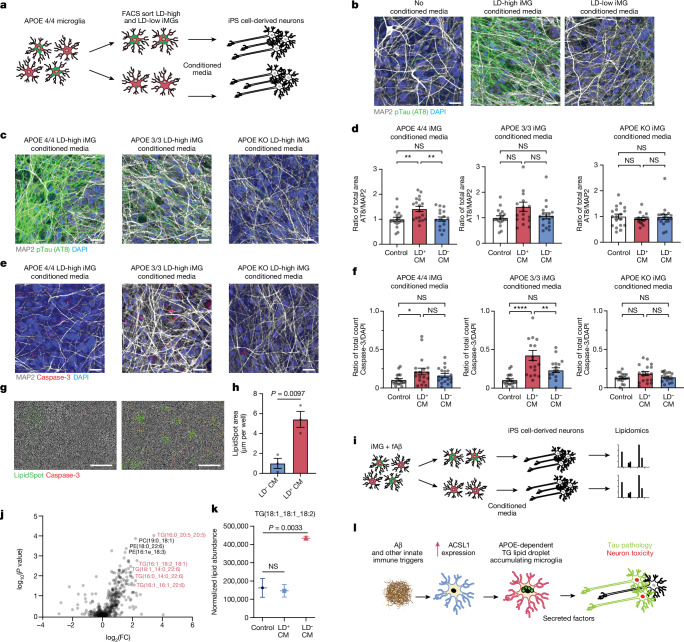
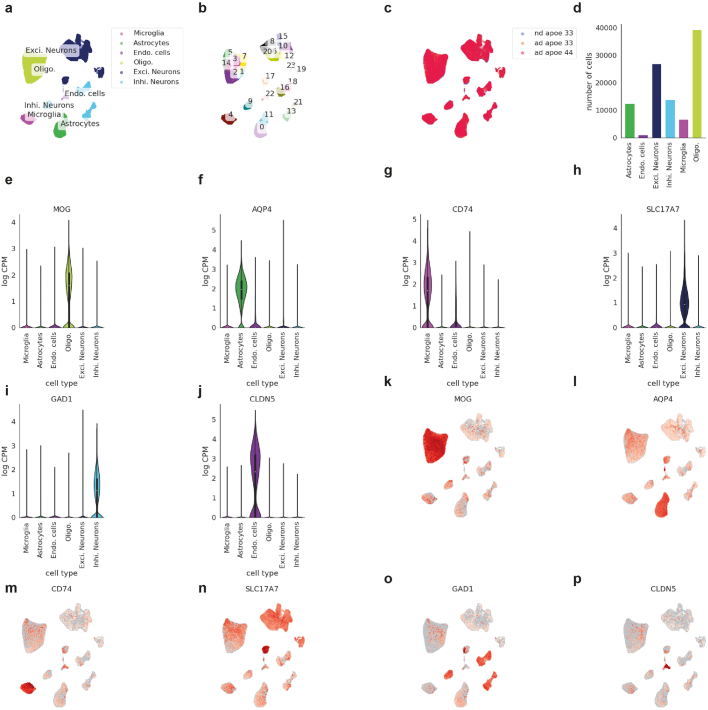
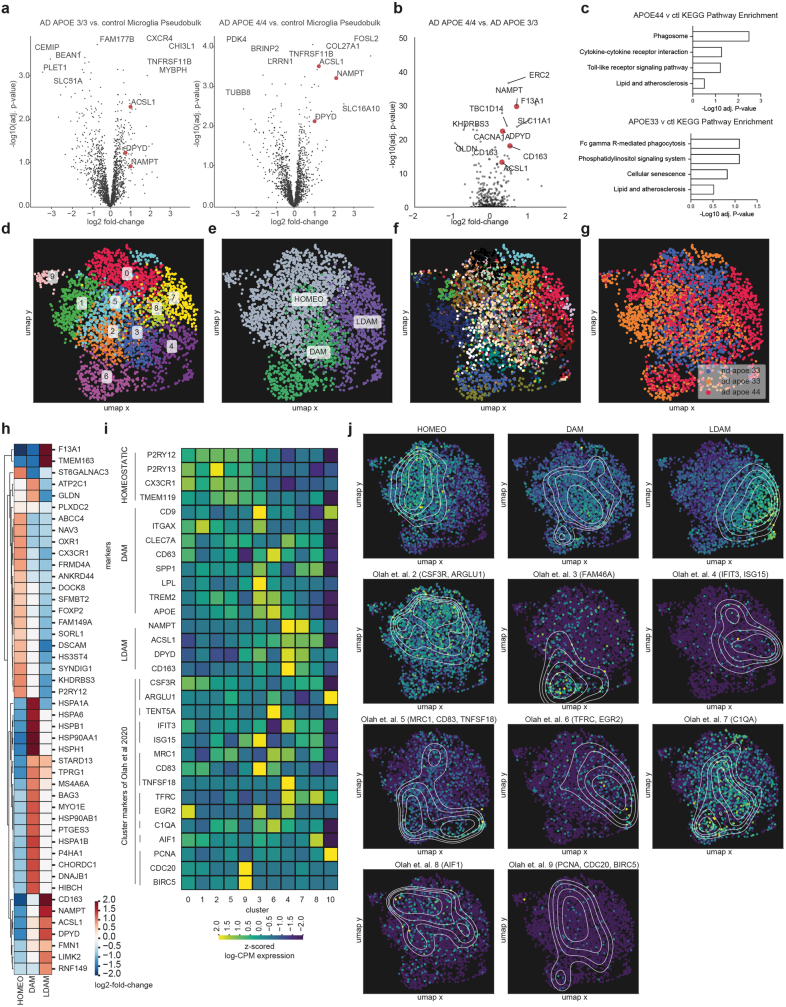
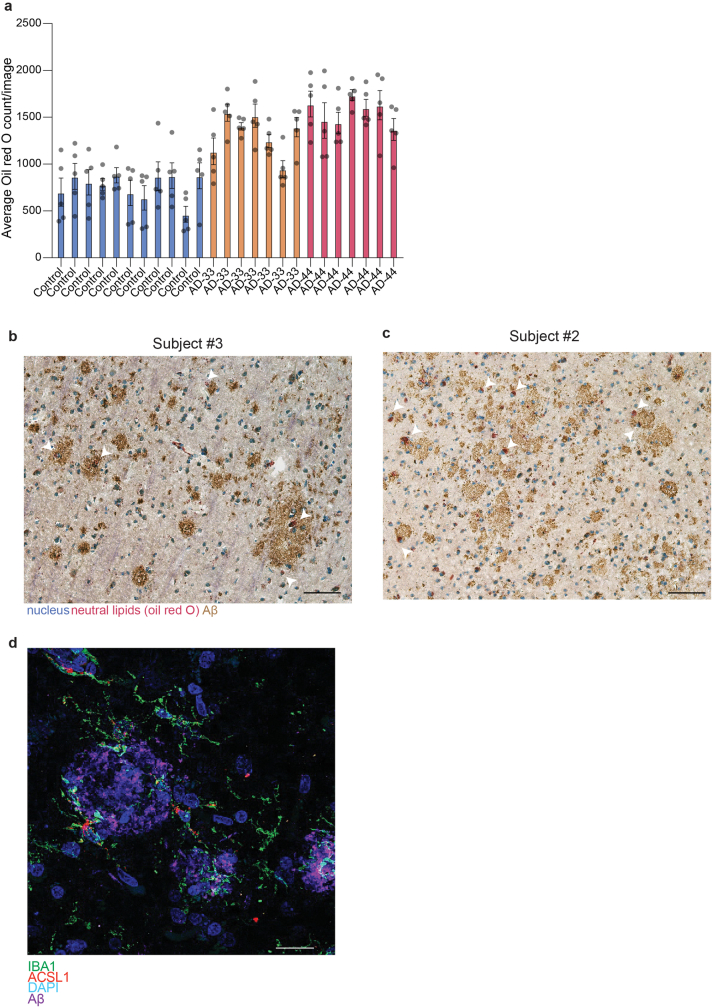
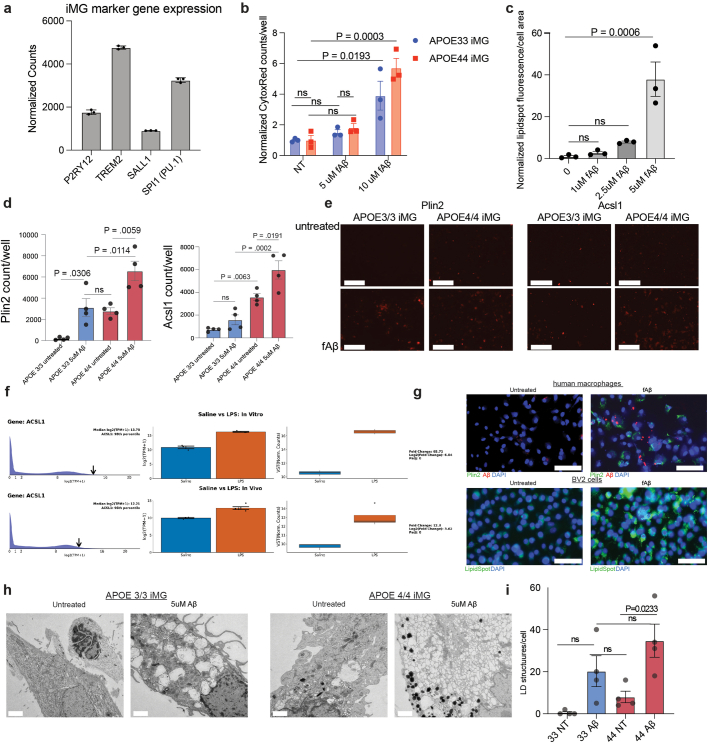
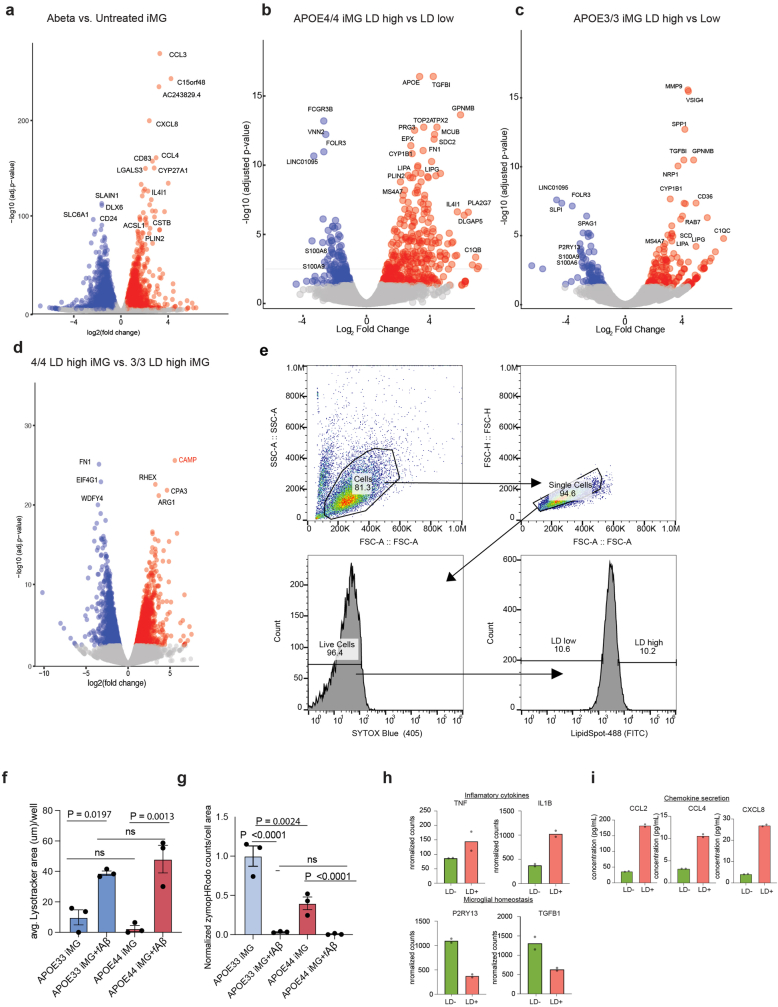
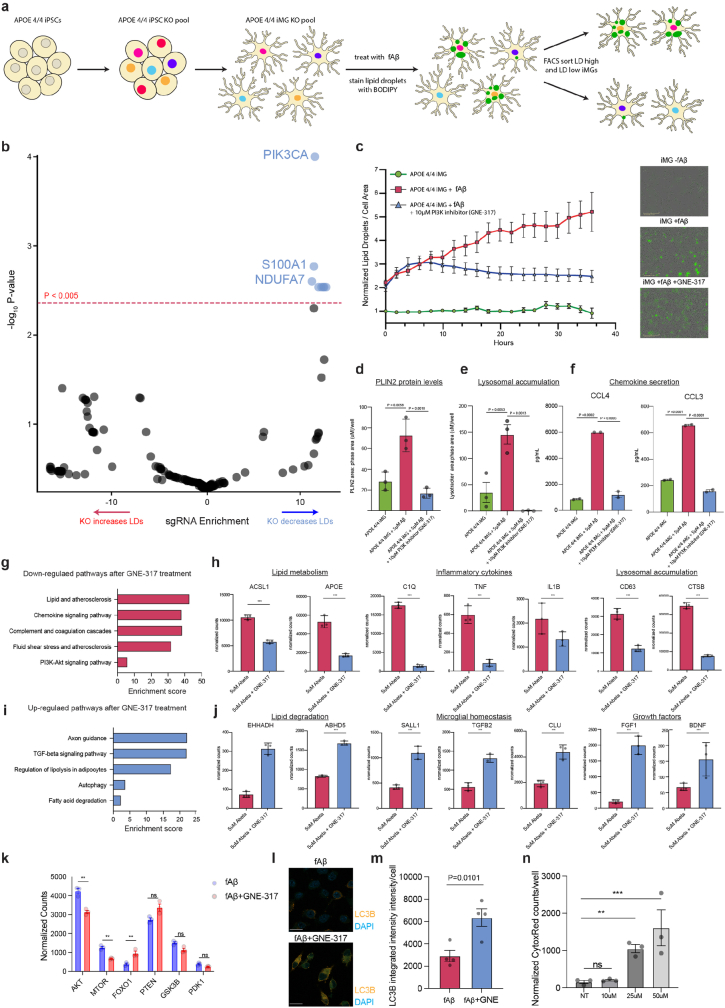
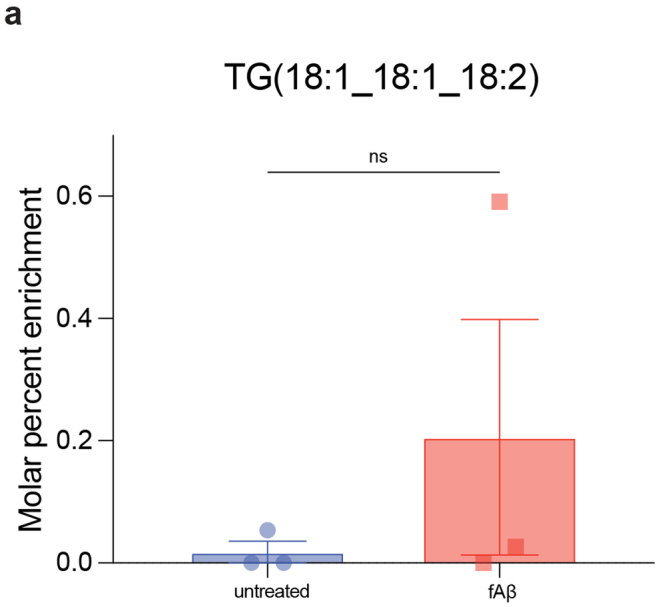
Several genetic risk factors for Alzheimer's disease implicate genes involved in lipid metabolism and many of these lipid genes are highly expressed in glial cells1. However, the relationship between lipid metabolism in glia and Alzheimer's disease pathology remains poorly understood. Through single-nucleus RNA sequencing of brain tissue in Alzheimer's disease, we have identified a microglial state defined by the expression of the lipid droplet-associated enzyme ACSL1 with ACSL1-positive microglia being most abundant in patients with Alzheimer's disease having the APOE4/4 genotype. In human induced pluripotent stem cell-derived microglia, fibrillar Aβ induces ACSL1 expression, triglyceride synthesis and lipid droplet accumulation in an APOE-dependent manner. Additionally, conditioned media from lipid droplet-containing microglia lead to Tau phosphorylation and neurotoxicity in an APOE-dependent manner. Our findings suggest a link between genetic risk factors for Alzheimer's disease with microglial lipid droplet accumulation and neurotoxic microglia-derived factors, potentially providing therapeutic strategies for Alzheimer's disease.


Conflict of interest statement

T.G.B. is a paid consultant to Aprinoia Therapeutics and Biogen. E.M.R. is a scientific advisor to Alzheon, Aural Analytics, Denali, Retromer Therapeutics and Vaxxinity and a cofounder and advisor to ALZPath. The remaining authors declare no competing interests.

Figures

Fig. 1
Fig. 1. AD microglia have lipid transcriptional state defined by ACSL1.
a, Schematic of snRNA-seq cohort and workflow (Methods). b, UMAP representation of all cells (n = 100,317) from snRNA-seq, coloured by annotated cell type. Data are shown after quality control and batch correction. c,d, Volcano plot representing MAST-based single-cell differential gene expression results (see section on ‘Single-cell differential gene expression’) of microglia from control individuals compared to microglia from individuals with AD and the APOE3/3 genotype (c) and from individuals with AD and the APOE4/4 genotype (d). Selected lipid- and metabolism-associated genes highlighted in red. e, Pathway diagram showing placement of differentially expressed gene ACSL1 in pathway starting from free fatty acid to LD formation. f, Violin plots showing ACSL1 expression across the cell types in the snRNA-seq dataset. Significance results indicate MAST-based adjusted P values (see section on ‘Single-cell differential gene expression’). g, Normalized and z-scored gene expression amounts of HOMEOSTATIC, DAM, LDAM and MACRO (macrophage) marker genes across the 11 subclusters identified in the microglia. HOMEOSTATIC, DAM and LDAM signature scores are shown across the 11 identified subclusters at the bottom. h, UMAP representation of microglia cells indicating the marker gene-based cell state annotation (bottom right) and the signature scores per cell for HOMEOSTATIC (top left), DAM (top right) and LDAM (bottom left) states. Contour lines indicate kernel density estimates of the signatures across the UMAP space. i, Bar plots indicating the percentage of cells from the three different cellular states (HOMEOSTATIC, DAM and LDAM) across microglia from control, AD-APOE3/3 and AD-APOE4/4 groups. Chi-square test results indicate the significance of the percentage differences between the groups (***P < 0.0001). j, Representative immunofluorescence images of human frontal cortex adjacent to the tissue used in snRNA-seq experiments stained for microglia marker IBA1 (green), ACSL1 (red) and DAPI (blue) in an aged-matched healthy control subject (left), an AD-APOE3/3 subject (middle) and an AD-APOE4/4 subject. Scale bars, 20 μm. k, Quantification of percentage of IBA1+ microglia positive for ACSL1. n = 5 per group; each dot represents individual subject; one-way analysis of variance (ANOVA); mean ± s.e.m. Schematics in a created with BioRender.com.
Fig. 2
Fig. 2. Lipid accumulation is linked to AD pathology.
a, Representative Oil Red O staining image for control, AD-APOE3/3 and AD-APOE4/4 human frontal cortex. Neutral lipids stained with Oil Red O (red) and nuclei stained with haematoxylin (blue). Scale bars, 50 μm. b, Quantification of Oil Red O staining. Bar plots represent average Oil Red O counts per image for each individual category (control, n = 12; AD33 n = 7; AD44 n = 9 individuals). Each dot represents average Oil Red O counts for an individual averaged over five ×20 image fields per individual; one-way ANOVA; mean ± s.e.m. c, Left, Oil Red O staining of individuals with AD-APOE4/4 and with IHC for Aβ. White arrowheads represent Oil Red O+ cells in or around Aβ plaques. Scale bar, 50 μm. Right, high magnification of representative Oil Red O stain with IHC for Aβ in an individual with AD-APOE4/4. Black arrowheads represent Oil Red O+ cells in or around Aβ plaques. Scale bar, 20 μm. d, Quantification of the frequency of Oil Red O+ cells in various distances from Aβ plaques (n = 4 per group; one-way ANOVA; mean ± s.e.m.). e, Scatter plot of average Oil Red O counts per individual averaged over five ×20 image fields per individual with individual’s metadata. Individual category coloured blue for control, orange for individuals with AD-APOE3/3 and red for those with AD-APOE4/4. P values determined by Spearman correlation. f, Scatter plot of average Oil Red O counts per individual averaged over five ×20 image fields per individual with individual’s snRNA-seq data. Individual category coloured blue for control, orange for individuals with AD-APOE3/3 and red for those with AD-APOE4/4. P values determined by Spearman correlation. g, Representative immunofluorescence images of mouse hippocampus tissue stained for microglia marker IBA1 (red), neutral lipids (LipidSpot, green) and DAPI (blue) in control age-matched non-transgenic mice (left), AD mouse model (J20) with human APOE3 knockin (middle) and AD mouse model (J20) with human APOE4 knockin (right). Scale bars, 20 μm. h, Quantification of average percentage of IBA1+ microglia with neutral lipid dye (LipidSpot) (n = 3 individual mice per group; one-way ANOVA; mean ± s.e.m).
Fig. 3
Fig. 3. iMG increase ACSL1 and triglyceride lipid synthesis after fAβ challenge.
a, Schematic of APOE3/3 and APOE4/4 iMGs. b, Quantification of lipid fluorescent dye (LipidSpot) in APOE3/3 and APOE4/4 iMG ± fAβ (n = 3 replicate wells per condition; mean ± s.e.m.). c, Average LipidSpot fluorescence per cell normalized to the not treated (NT) condition at final time point in b. Individual dots represent replicate wells (n = 3 replicate wells per condition; unpaired two-sided t-test; per condition, mean ± s.e.m). d, Normalized gene expression counts for significant differentially expressed genes in APOE4/4 iMG ± fAβ (n = 3 replicate wells per condition, P values determined by DEseq2; mean ± s.e.m). e, Primary rat microglia untreated (left) or with fAβ (right) with LipidSpot. Scale bar, 200 μm. f, Average LipidSpot fluorescence per cell normalized to untreated images in e (n = 3 replicate wells per condition; unpaired two-sided t-test; mean ± s.e.m). g, CARS images of APOE4/4 and APOE3/3 iMG ± fAβ. Scale bars, 20 μm. Data replicated in at least two independent experiments. h, Quantification of CARS microscopy. Each dot represents lipid measurements from individual cells (APOE33 n = 47; APOE44 n = 38; unpaired two-sided t-test). i, CARS spectra from fAβ-treated iMG (red) and reference spectra for common lipid species (black). j, Schematic of lipidomics measurement of d-glucose13C incorporation in BV2 cells + fAβ. k, Incorporation of d-glucose13C into triglycerides in microglia ± fAβ (n = 3 replicate wells per condition; one-way ANOVA; mean ± s.e.m). l, Incorporation of d-glucose13C into triglycerides in Aβ-treated microglia over time (n = 3 replicate wells per condition; one-way ANOVA; mean ± s.e.m). m, Volcano plot of genome-wide CRISPR-KO LD screen in U937 cell line. Genes passing a 10% FDR cutoff are highlighted in red and blue. n, Average LipidSpot fluorescence ± ACSL1 inhibitor (Triacin C) (n = 4 replicate wells per condition; unpaired two-sided t-test; mean ± s.e.m.). o, Schematic of ATAC-seq and RNA-seq in LD-high and LD-low iMGs. p, ATAC-seq peaks in LD-high versus LD-low iMGs. q, Motif analysis of differential peaks. Motifs enriched in lipid-associated macrophages are highlighted in red. r, Average percentage pHrodo zymosan+ iMGs ± LD (n = 4 replicate wells per condition; unpaired, two-sided t-test; mean ± s.e.m.). s, Average percentage lysotracker+ iMGs ± LD (n = 3 replicate wells per condition; unpaired, two-sided t-test; mean ± s.e.m.). KO, knockout; NS, not significant. Elements in j created with BioRender.com.
Fig. 4
Fig. 4. LD+ microglia induce Tau phosphorylation and apoptosis in neurons.
a, Schematic of LDAM-specific conditioned media (CM) exposure to neurons. b, Immunofluorescence images of iPS cell-derived neurons exposed to no CM (left), LD+ APOE4/4 iMG-CM (middle) and LD APOE4/4 iMG-CM (left). Cells were stained for DAPI (blue), MAP2 (grey) and pTau (AT8, green). Scale bars, 20 μm. c, Immunofluorescence images of iPS cell-derived neurons exposed to LD+ APOE4/4 iMG-CM (left), LD+ APOE3/3 iMG-CM (middle), LD+ APOE-KO iMG-CM (right). Cells were stained for DAPI (blue), MAP2 (grey) and pTau (AT8, green). Scale bars, 20 μm. Data replicated in at least two independent experiments. d, Quantification of images as presented in c. Each dot represents a random filed image (n = 18) across three replicate wells per condition; one-way ANOVA; mean ± s.e.m. e, Immunofluorescence images of iPS cell-derived neurons under conditions in c stained for DAPI (blue), MAP2 (grey) and cleaved caspase-3 (red). Scale bars, 20 μm. f, Quantification of images as presented in e. Each dot represents a random filed image (n = 18) across three replicate wells per condition; one-way ANOVA; mean ± s.e.m. g, Images of neurons exposed to LD APOE4/4 iMG-CM (left) and LD+ APOE4/4 iMG-CM (right). Cells were stained with LipidSpot (green) and activated caspase-3 dye (red). Scale bars, 200 μm. h, Quantification LipidSpot fluorescence (n = 4 replicate wells per condition; two-sided t-test; mean ± s.e.m). i, Schematic of lipidomics experimental design of neurons treated with CM. j, Volcano plot representing lipids detected in neurons after treatment of LD+ iMG-CMa versus LD iMG-CM. Triglyceride species are highlighted in red. k, Lipidomic measurements of one lipid species detected in lipidomic analysis. Individual dots represent replicate wells (n = 3 replicate wells per condition; one-way ANOVA; mean ± s.e.m). l, Schematic of the proposed role of LD+ microglia in neurodegeneration. *P < 0.01, **P < 0.001, ****P < 0.0001.
Extended Data Fig. 1
Extended Data Fig. 1. Quality Control for single-nucleus RNA-sequencing data.
a, Doublet score distributions obtained with the Scrublet (0.2.3) Python package. Vertical lines indicate the doublet score thresholds identified per sample based on the distributions shown. b-e, Distribution of total read counts (b), number of genes expressed per cell (c), percent of reads mapped to ribosomal genes (d) and percent of reads mapped to mitochondrial genes (e) within the processed data after quality control. f, Percent of explained variance across the first 48 principal components.
Extended Data Fig. 2
Extended Data Fig. 2. Annotations of CNS cell types from single-nucleus RNA-sequencing data.
a-c, UMAP visualization of the whole snRNA-seq dataset after quality control and batch correction (n = 100,317). Cells are coloured by cell type annotation (a), subclusters drawn for cell type annotation (b), subject groups (control, AD-APOE3/3, AD-APOE4/4) (c). d, Bar chart indicating the total number of cells per cell type. e-j, Violin plots indicating gene expression levels of marker genes used for cell type annotations across the 6 identified cell types (n = 100,317). Violin plots are centred around the median, with their shape representing cell distribution. k-p, UMAP visualization of the whole snRNA-seq dataset coloured by cell type marker gene expression levels per cell.
Extended Data Fig. 3
Extended Data Fig. 3. Differential expression analysis and subclustering of microglia from single-nucleus RNA-sequencing data.
a, Volcano plot representing pseudobulk differential gene expression results (see Methods, Microglia pseudobulk differential gene expression) of microglia from control individuals compared to microglia (left) from subjects with AD and the APOE3/3 genotype, (right) from subjects with AD and the APOE4/4 genotype. Select lipid and metabolism-associated genes highlighted in red. b, Volcano plot representing single-cell differential gene expression results of microglia from subjects with AD and the APOE3/3 genotype compared to microglia from subjects with AD and the APOE4/4 genotype. Select lipid and metabolism-associated genes highlighted in red. c, Selected KEGG pathway analysis terms and enrichment score for top 200 differential expressed genes in between control and AD-APOE4/4 microglia (top) and control and AD-APOE3/3 microglia (bottom). d-g, UMAP visualization of the microglia coloured by identified subclusters (macrophage cluster 10 is not shown) (d), identified microglial states (e), subject IDs (f) and subject groups (control, AD-APOE3/3, AD-APOE4/4). h, Top marker genes identified for the 3 microglial states (HOMEOSTATIC, DAM, LDAM) with ‘one versus rest’ marker identification. Single-cell differential gene expression was performed with MAST (see Methods, Single-cell differential expression). Heatmap indicates significant (adj. p-value < 0.05) log2-fold changes. i, Normalized and z-scored gene expression levels of HOMEOSTATIC, DAM, LDAM marker genes as well as marker genes identified by Olah et al. across the 11 subclusters identified within the microglia. j, UMAP representation of microglia cells indicating signature scores per cell for HOMEOSTATIC, DAM, LDAM marker genes as well as marker genes identified by Olah et al. Contour lines indicate kernel density estimates of the signatures across the UMAP space.
Extended Data Fig. 4
Extended Data Fig. 4. Additional microscopy and quantification of human AD brain tissue.
a, Quantification of Oil Red O counts for each subject (n = 5 20x images per subject; mean ± s.e.m.). b-c, Representative Oil Red O staining of APOE4/4 AD subjects with IHC for Aβ. White arrowheads represent Oil Red O positive cells in or around Aβ plaques. Scale bars (black, bottom right) 50 μm. d, Representative immunofluorescence images of human frontal cortex adjacent to tissue used in snRNA-seq experiments stained for microglia marker IBA1 (green), ACSL1 (red) and DAPI (blue) and amyloid-beta (magenta) in an AD APOE4/4 subject. Scale bars (white, bottom right) 20 μm. Data in b-d replicated in at least two independent experiments.
Extended Data Fig. 5
Extended Data Fig. 5. Additional in vitro experiments on lipid droplet production and ACSL1 expression after fAβ treatment.
a, Expression of microglia marker genes in iMG (n = 3 replicate wells; mean ± s.e.m). b, Toxicity of fAβ at different concentrations in APOE4/4 and APOE3/3 iMG after 24 hours incubation followed by staining with CytoxRed. (n = 3 replicate wells per condition; one-way ANOVA; mean ± s.e.m.). c, Dose-dependent effect of fAβ on lipid accumulation (n = 3 replicate wells per condition; one-way ANOVA; mean ± s.e.m.). d-e, iMG treated with 5 μM Aβ for 24 hours (left) with PLIN2 and ACSL1 Immunofluorescence quantification with (d) with representative images (e) (n = 4 replicate wells per condition; one-way ANOVA; mean ± s.e.m.; scale bars (white, bottom left) 200 μm). f, ACSL1 gene expression measured in human iMG after LPS treatment as described in Hasselmann et al. 2019 (https://rnaseq.mind.uci.edu/blurton-jones/bulkSeq/); box plot centred at median with boarders representing quartiles. mean ± s.e.m. g, Representative image of human macrophages (top) untreated (left) or treated (right) with 5 μM Aβ for 24 hours (left) with PLIN2 (green) and Aβ (red) staining. Scale bars (white, bottom right) 50 um. Representative image of mouse BV2 cells (bottom) untreated (left) or treated (right) with 5uM Aβ for 24 hours (left) with LipidSpot (green) and Aβ (red) staining. Scale bars (white, bottom right) 75 μm. Data in replicated in at least two independent experiments. h-i, Transmission electron microscopy of APOE3/3 iMG and APOE 4/4 iMG treated with 5 μM Aβ for 24 hours and untreated iMG (Scale bars (white, bottom right) 2 μm; n = 4 replicate wells per condition; one-way ANOVA; mean ± s.e.m.).
Extended Data Fig. 6
Extended Data Fig. 6. Bulk RNA-saq of iMG and phenotypic assays.
a, Volcano plot of differential gene expression analysis of untreated and Aβ treated APOE4/4 iMG. b, Volcano plot of differential gene expression analysis of lipid droplet high and lipid droplet low APOE4/4 iMG. c, Volcano plot of differential gene expression analysis of lipid droplet high and lipid droplet low APOE3/3 iMG. d, Volcano plot of differential gene expression analysis of lipid droplet high APOE3/3 iMG and lipid droplet high APOE4/4 iMG. e, Example gating scheme for separating cells based on lipid droplet content. f, LysoTracker area per cell after incubation with fAβ in APOE3/3 and APOE4/4 iMG (n = 3 replicate wells per condition; one-way ANOVA; mean ± s.e.m.). g, Phrodo zymosan phagocytosis area per cell after incubation with fAβ in APOE3/3 and APOE4/4 iMG (n = 3 replicate wells per condition; one-way ANOVA; mean ± s.e.m.). h, Normalized gene expression counts for significant DEGs in LD-high versus LD-low iMGs (n = 2 replicate wells per condition). i, Secreted chemokines in LD-high versus LD-low iMGs (n = 2 replicate wells per condition).
Extended Data Fig. 7
Extended Data Fig. 7. CRISPR-KO screen in iMG for LD levels and effect of PIK3CA inhibition on LD levels.
a, Schematic of CRISPR-KO screen in APOE4/4 iMG for lipid droplet formation following Aβ treatment. b, Volcano plot representing CRISPR screen results. Effect score represents log2 fold change in sgRNA counts in lipid droplet negative versus lipid droplet-positive cell fraction. Screen hits with P-value < 0.005 coloured blue. c, Live cell imaging of untreated APOE4/4 iMG, 5 μM Aβ treated iMG and 5 μM Aβ treated iMG with 10 μM GNE-317. The y axis represents average green fluorescence per cell normalized to untreated APOE4/4 iMG at the first time point and the x-axis represents imaging time points in hours (n = 3 replicate wells per condition; mean ± s.e.m.) (left). Representative images at the final time point (right) with LipidSpot signal represented in green. d, Quantification of PLIN2 Immunofluorescence in untreated, Aβ treated and Aβ treated with 10 uM GNE-317 conditions iMG for 24 hours. (n = 3 replicate wells per condition; one-way ANOVA; mean ± s.e.m.). e, Quantification of lysotracker staining in untreated, Aβ treated and Aβ treated with 10 μM GNE-317 conditions iMG for 24 hours (n = 3 replicate wells per condition; one-way ANOVA; mean ± s.e.m.). f, Measurement of secreted chemokines in cell culture media in untreated, Aβ treated and Aβ treated with 10 μM GNE-317 conditions iMG for 24 hours. Individual dots represent replicate wells (n = 2, one-way ANOVA; mean ± s.e.m.). g, Selected KEGG pathway enrichment terms for the top 200 significant downregulated genes ranked by p-value upon GNE-317 treatment in APOE4/4 iMG when challenged with Aβ. h, Normalized gene expression counts for significantly downregulated genes with GNE-317 treatment in APOE4/4 iMG when challenged with Aβ APOE4/4 iMG (n = 3 replicate wells per condition, mean ± s.e.m., *** P < 0.0001). P values determined by DEseq2. i, Selected KEGG pathway enrichment terms for top 200 significant upregulated genes ranked by p-value upon GNE-317 treatment in APOE4/4 iMG when challenged with Aβ. j, Normalized gene expression counts for significantly upregulated genes with GNE-317 treatment in APOE4/4 iMG when challenged with Aβ APOE4/4 iMG (n = 3 replicate wells per condition; mean ± s.e.m.; *** P < 0.0001). P values determined by DEseq2. k, Differential gene expression for genes in mTOR and autophagy pathways upon GNE-317 treatment with fAβ challenge in iMG. (n = 3 replicate wells per condition; mean ± s.e.m.;*** P < 0.0001). P values determined by DEseq2. l, Representative images of LC3B Immunofluorescence (yellow) upon fAβ and GNE-317 treatment. The scale bar (white, bottom left) represents 20μm. m, Quantification of LC3B immunofluorescence by integrated fluorescence intensity per DAPI signal. Individual dots represent replicate wells (n = 4 per condition; two-sided, t-test; mean ± s.e.m.). n, Toxicity measurements of GNE-317 as determined by cytox-red. (n = 4 per condition; mean ± s.e.m; one-way ANOVA).
Extended Data Fig. 8
Extended Data Fig. 8. Detection of triglyceride synthesized in microglia taken up by neurons through labelled 13C-glucose tracing.
a, Measurement of 13C-labelled triglycerides synthesized in microglia and profiled in neurons by lipidomics after exposure to microglia conditioned media. Microglia grown in uniformly labelled 13C-glucose (U-13C6-glucose) were challenged with fAβ or untreated. Each dot represents an individual replicate. n = 3 wells per condition; unpaired t-test; mean ± s.e.m.).

Update of

Similar articles

Cited by

References

    1. Kunkle BW, et al. Genetic meta-analysis of diagnosed Alzheimer’s disease identifies new risk loci and implicates Aβ, tau, immunity and lipid processing. Nat. Genet. 2019;51:414–430. - PMC - PubMed
    1. Alzheimer, A. Über eine eigenartige Erkrankung der Hirnrinde. Allg. Z. Psychiatr. Psych. Gerichtl.Med.64, 146–148 (1907).
    1. Mathys H, et al. Single-cell transcriptomic analysis of Alzheimer’s disease. Nature. 2019;570:332–337. - PMC - PubMed
    1. Victor MB, et al. Lipid accumulation induced by APOE4 impairs microglial surveillance of neuronal-network activity. Cell Stem Cell. 2022;29:1197–1212. - PMC - PubMed
    1. Marschallinger J, et al. Lipid-droplet-accumulating microglia represent a dysfunctional and proinflammatory state in the aging brain. Nat. Neurosci. 2020;23:194–208. - PMC - PubMed

MeSH terms