. 2024 Jun;115(6):1791-1807.
doi: 10.1111/cas.16151. Epub 2024 Mar 13.

MFN2 suppresses the accumulation of lipid droplets and the progression of clear cell renal cell carcinoma

Affiliations

MFN2 suppresses the accumulation of lipid droplets and the progression of clear cell renal cell carcinoma

Zhiduan Cai et al. Cancer Sci. 2024 Jun.

Abstract

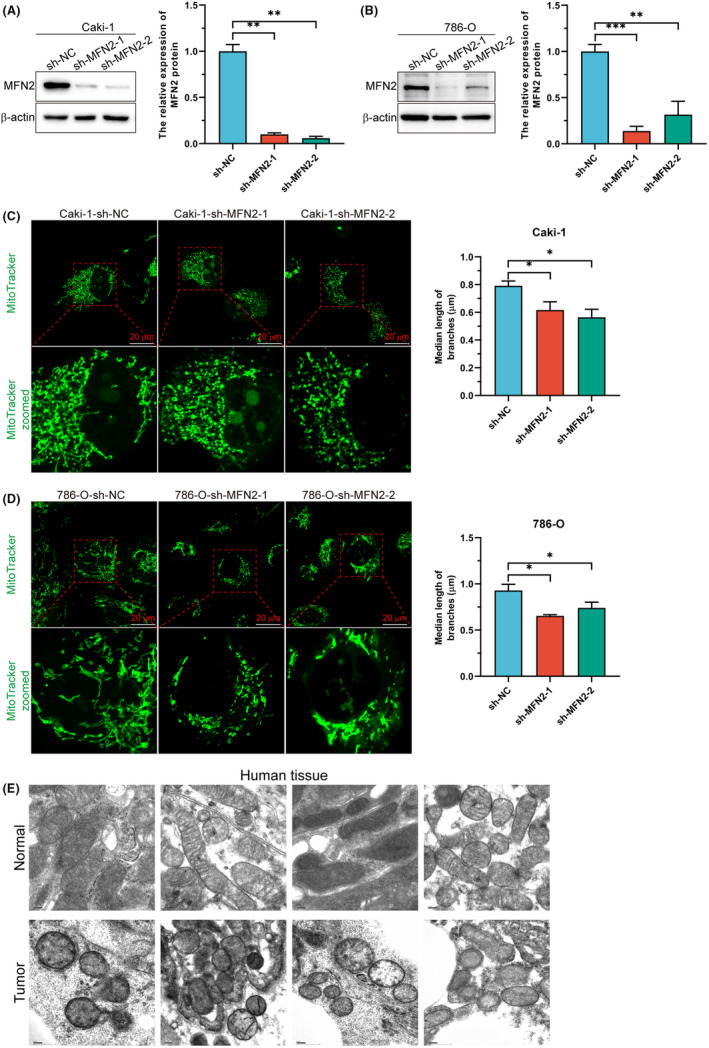
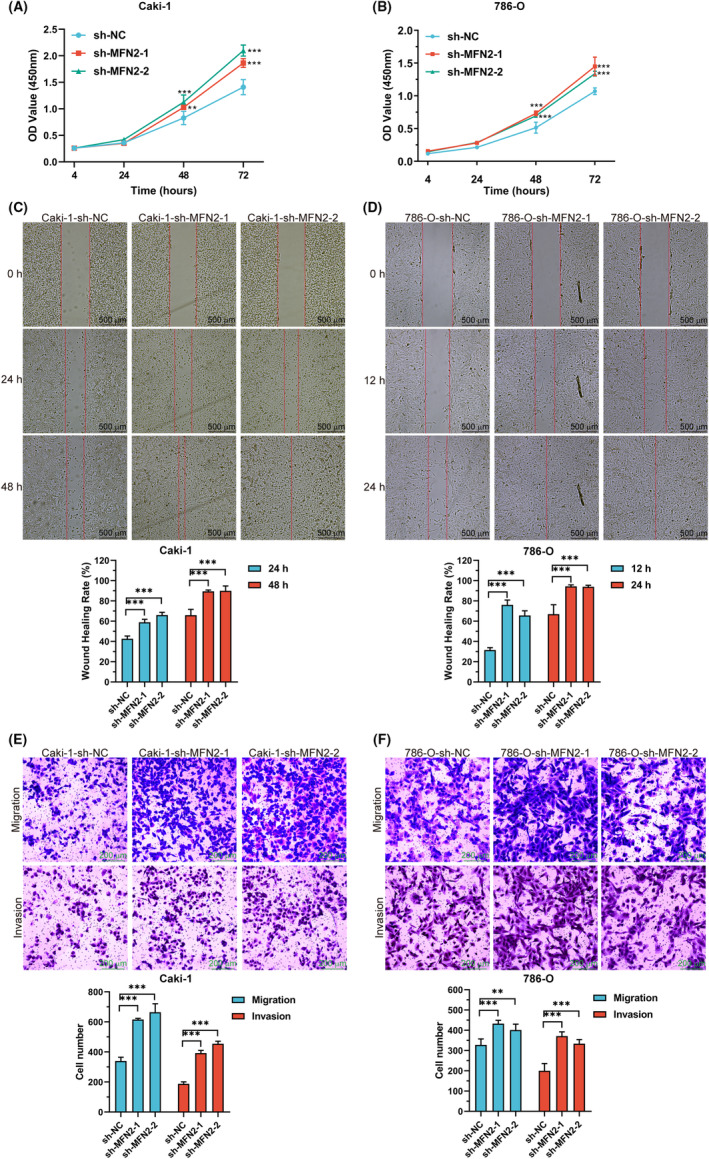
Dissolving the lipid droplets in tissue section with alcohol during a hematoxylin and eosin (H&E) stain causes the tumor cells to appear like clear soap bubbles under a microscope, which is a key pathological feature of clear cell renal cell carcinoma (ccRCC). Mitochondrial dynamics have been reported to be closely associated with lipid metabolism and tumor development. However, the relationship between mitochondrial dynamics and lipid metabolism reprogramming in ccRCC remains to be further explored. We conducted bioinformatics analysis to identify key genes regulating mitochondrial dynamics differentially expressed between tumor and normal tissues and immunohistochemistry and Western blot to confirm. After the target was identified, we created stable ccRCC cell lines to test the impact of the target gene on mitochondrial morphology, tumorigenesis in culture cells and xenograft models, and profiles of lipid metabolism. It was found that mitofusin 2 (MFN2) was downregulated in ccRCC tissues and associated with poor prognosis in patients with ccRCC. MFN2 suppressed mitochondrial fragmentation, proliferation, migration, and invasion of ccRCC cells and growth of xenograft tumors. Furthermore, MFN2 impacted lipid metabolism and reduced the accumulation of lipid droplets in ccRCC cells. MFN2 suppressed disease progression and improved prognosis for patients with ccRCC possibly by interrupting cellular lipid metabolism and reducing accumulation of lipid droplets.

Keywords: Hif2α; MFN2; clear cell renal cell carcinoma; lipid droplets; mitochondrial fusion.


Conflict of interest statement

The authors have no conflict of interest.

Figures

FIGURE 1
FIGURE 1
A reduced expression of MFN2 mRNA was detected in human clear cell renal cell carcinoma (ccRCC) tissues deposited in databases and predicted a poor prognosis. (A, B) Volcano plots of differentially expressed genes between tumor and normal tissues deposited in The Cancer Genome Atlas Kidney Renal Clear Cell Carcinoma (TCGA‐KIRC) (A) and GSE40435 database (B). (C) Venn diagram showing the number of differentially expressed genes in ccRCC tumorigenesis between and among those from TCGA‐KIRC, GSE40435 database, and a GO mitochondrial morphology gene set. (D) An AUC plot showing the prognostic values of the 13 differentially expressed mitochondrial dynamics‐regulating genes as identified above (C) based on the TCGA‐KIRC database. (E–J) Plots showing differences of expression levels of MFN2 mRNA between 541 tumor and 72 adjacent normal tissues (E), 72 pairs of tumor and adjacent normal tissues (F), different genders (G), different T stages based on the classification reported in AJCC 8th edition (H), different clinical stages (I), and pathological grade (J) deposited in the TCGA‐KIRC database. (K–M) Kaplan–Meier curves showing the overall survival (K), disease‐free survival (L), and progression‐free survival (M) for ccRCC patients with high or low expression levels of MFN2 based on a median cutoff in the TCGA‐KIRC cohort. *p < 0.05, **p < 0.01, ***p < 0.001.
FIGURE 2
FIGURE 2
A reduced expression of the MFN2 protein was similarly confirmed with clinical samples from human clear cell renal cell carcinoma (ccRCC) patients. (A–C) Representative images (A) and quantitative analyses (B, C) showing the differences of MFN2 protein levels as detected by immunohistochemistry (IHC) staining between all tumor and normal tissues (B) and between the 50 pairs of tumor and adjacent normal tissues (C) collected in a human ccRCC tissue microarray (TMA) (A). (D) Representative images and a quantitative plot showing the differences of MFN2 protein levels as detected by Western blot (WB) between tumor and adjacent normal tissues from 11 human ccRCC patients enrolled in our hospital. (E) Representative images and quantitative analysis showing the MFN2 protein levels as detected by WB in immortalized renal epithelial cell line HK‐2 and ccRCC cell lines Caki‐1, 786‐O, and 769‐P. β‐Actin protein was used as a loading control. *p < 0.05, ***p < 0.001.
FIGURE 3
FIGURE 3
Suppressing the expression of MFN2 led to mitochondrial fragmentation in clear cell renal cell carcinoma (ccRCC) cells. (A, B) Representative images and quantitative analysis showing MFN2 protein levels as detected by Western blot (WB) in Caki‐1 (A) and 786‐O cells (B) transfected with two MFN2‐specific shRNA (sh‐MFN2‐1 and sh‐MFN2‐2) or a negative control virus (sh‐NC). (C, D) Representative images and quantitative plots showing the sizes of mitochondria labeled with MitoTracker (green color) in Caki‐1 (C) and 786‐O cells (D) transfected with sh‐MFN2‐1 and sh‐MFN2‐2 or a sh‐NC virus. (E) Representative images showing the morphology of mitochondria in tumor and adjacent normal tissues. *p < 0.05, **p < 0.01, ***p < 0.001.
FIGURE 4
FIGURE 4
Suppressing the expression of MFN2 led to enhancements of proliferation, migration, and invasion of clear cell renal cell carcinoma (ccRCC) cells. (A, B) Plots showing the growth curves based on CCK‐8 assays in Caki‐1 (A) and 786‐O cells (B) transfected with sh‐MFN2‐1 and sh‐MFN2‐2 or a sh‐NC virus. (C–F) Representative images (top) and statistical analysis (bottom) showing the scratch‐healing experimental results (C, D) and migration and invasion experimental results (E, F) of Caki‐1 (C, E) and 786‐O cells (D, F) transfected with sh‐MFN2‐1 and sh‐MFN2‐2 or a sh‐NC virus. **p < 0.01, ***p < 0.001.
FIGURE 5
FIGURE 5
Suppressing the expression of MFN2 led to an acceleration of clear cell renal cell carcinoma (ccRCC) tumor growth in xenograft mouse models. (A, B) Representative images and plots showing the morphology and respective volumes and weights of subcutaneous tumors formed from Caki‐1 (A) and 786‐O (B) cells transfected with the mixture of sh‐MFN2‐1 and sh‐MFN2‐2 or a sh‐NC virus. (C, D) Representative images and quantitative analyses showing the expression levels of MFN2, Ki‐67, and PCNA proteins as detected by immunohistochemistry (IHC) staining in tumors formed from Caki‐1 (C) and 786‐O (D) transfected with the mixture of sh‐MFN2‐1 and sh‐MFN2‐2 or a sh‐NC virus. *p < 0.05, **p < 0.01, ***p < 0.001.
FIGURE 6
FIGURE 6
Suppressing the expression of MFN2 caused a disruption of lipid metabolism in clear cell renal cell carcinoma (ccRCC) cells. (A, B) Heatmaps showing differentially changed levels of lipid metabolites in Caki‐1 (A) and 786‐O (B) cells transfected with the mixture of sh‐MFN2‐1 and sh‐MFN2‐2 or a sh‐NC virus. (C, D) Plots showing the relative levels of lipid metabolites in Caki‐1 (C) and 786‐O (D) cells transfected with the mixture of sh‐MFN2‐1 and sh‐MFN2‐2 or a sh‐NC virus. (E, F) Representative images of oil red O staining and quantitative plots of integrated optical density (IOD) in Caki‐1 (D) and 786‐O (E) cells transfected with sh‐MFN2‐1, sh‐MFN2‐2, or a sh‐NC virus. *p < 0.05, **p < 0.01, ***p < 0.001.
FIGURE 7
FIGURE 7
Suppressing the expression of MFN2 led to changes of the expression levels of proteins involved in lipid metabolism in clear cell renal cell carcinoma (ccRCC) cells. (A–D) Representative images of Western blot (WB) and plots showing relative levels of proteins involved in lipid metabolism such as ACC, ACSL1AS, AceCS1 (A, B), Hif2α, Perilipin2, and PHD2 (C, D) in addition to MFN2 in Caki‐1 (A) and 786‐O (B) cells transfected with sh‐MFN2‐1 and sh‐MFN2‐2 or a sh‐NC virus. (E) Representative images and a quantitative plot showing the differences of Hif2α protein levels between tumor tissues and adjacent normal tissues from ccRCC patients enrolled in our hospital. The first six pairs of tissues are identical with those described in Figure 2D. *p < 0.05, **p < 0.01, ***p < 0.001.
FIGURE 8
FIGURE 8
MFN2 suppressed the progression of clear cell renal cell carcinoma (ccRCC) and the accumulation of lipid droplets through Hif2α. (A, B) Representative images of Western blot (WB) and plots showing relative levels of MFN2, Hif2α, and Perilipin2 proteins in Caki‐1 (A) and 786‐O (B) cells transfected with a sh‐NC virus or the mixture of sh‐MFN2‐1 and sh‐MFN2‐2 with or without two Hif2α‐specific siRNA (si‐Hif2α‐1 and si‐Hif2α‐2). (C, D) Plots showing the growth curves based on CCK‐8 assays in Caki‐1 (C) and 786‐O cells (D) transfected with a sh‐NC virus or the mixture of sh‐MFN2‐1 and sh‐MFN2‐2 with or without si‐Hif2α‐1 and si‐Hif2α‐2. (E, F) Representative images (left) and statistical analysis (right) showing the migration and invasion abilities of Caki‐1 (E) and 786‐O cells (F) transfected with a sh‐NC virus or the mixture of sh‐MFN2‐1 and sh‐MFN2‐2 with or without si‐Hif2α‐1 and si‐Hif2α‐2. (G, H) Representative images of oil red O staining and quantitative plots of IOD in Caki‐1 (G) and 786‐O cells (H) transfected with a sh‐NC virus or the mixture of sh‐MFN2‐1 and sh‐MFN2‐2 with or without si‐Hif2α‐1 and si‐Hif2α‐2. **p < 0.01, ***p < 0.001, versus with sh‐NC. ## p < 0.01, ### p < 0.001, versus with sh‐MFN2.

Similar articles

Cited by

References

    1. Siegel RL, Miller KD, Wagle NS, Jemal A. Cancer statistics, 2023. CA Cancer J Clin. 2023;73(1):17‐48. - PubMed
    1. Yang J, Wang K, Yang Z. Treatment strategies for clear cell renal cell carcinoma: past, present and future. Front Oncol. 2023;13:1133832. - PMC - PubMed
    1. Wettersten HI, Aboud OA, Lara PN, Weiss RH. Metabolic reprogramming in clear cell renal cell carcinoma. Nat Rev Nephrol. 2017;13(7):410‐419. - PubMed
    1. Saito K, Arai E, Maekawa K, et al. Lipidomic signatures and associated transcriptomic profiles of clear cell renal cell carcinoma. Sci Rep. 2016;6:28932. - PMC - PubMed
    1. Adebayo M, Singh S, Singh AP, Dasgupta SA‐O. Mitochondrial fusion and fission: The fine‐tune balance for cellular homeostasis. FASEB J. 2021;35:e21620. - PMC - PubMed

MeSH terms