. 2024 Apr;16(4):823-853.
doi: 10.1038/s44321-024-00050-0. Epub 2024 Mar 13.

Basal-epithelial subpopulations underlie and predict chemotherapy resistance in triple-negative breast cancer

Affiliations

Basal-epithelial subpopulations underlie and predict chemotherapy resistance in triple-negative breast cancer

Mohammed Inayatullah et al. EMBO Mol Med. 2024 Apr.

Abstract

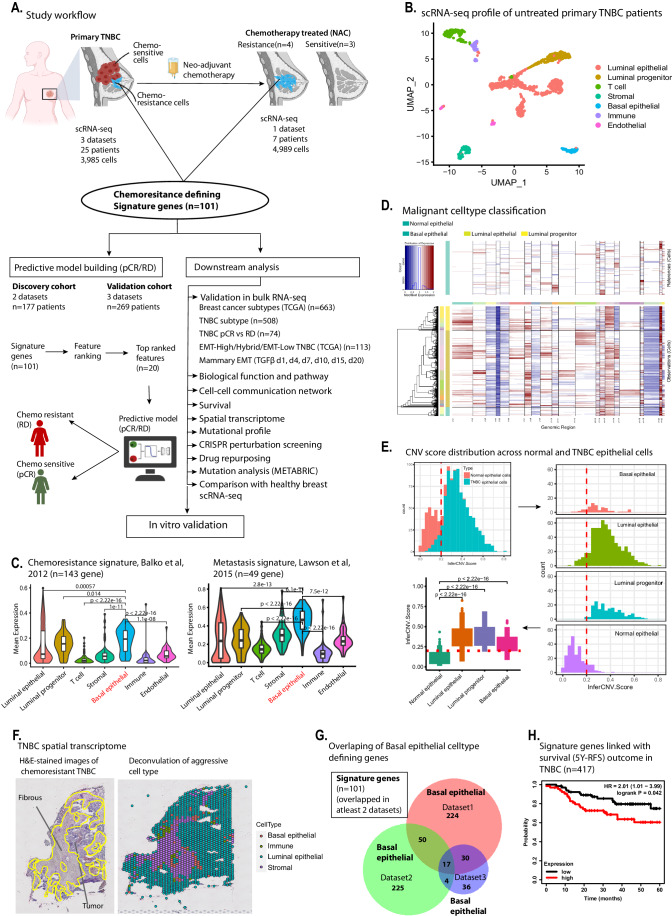
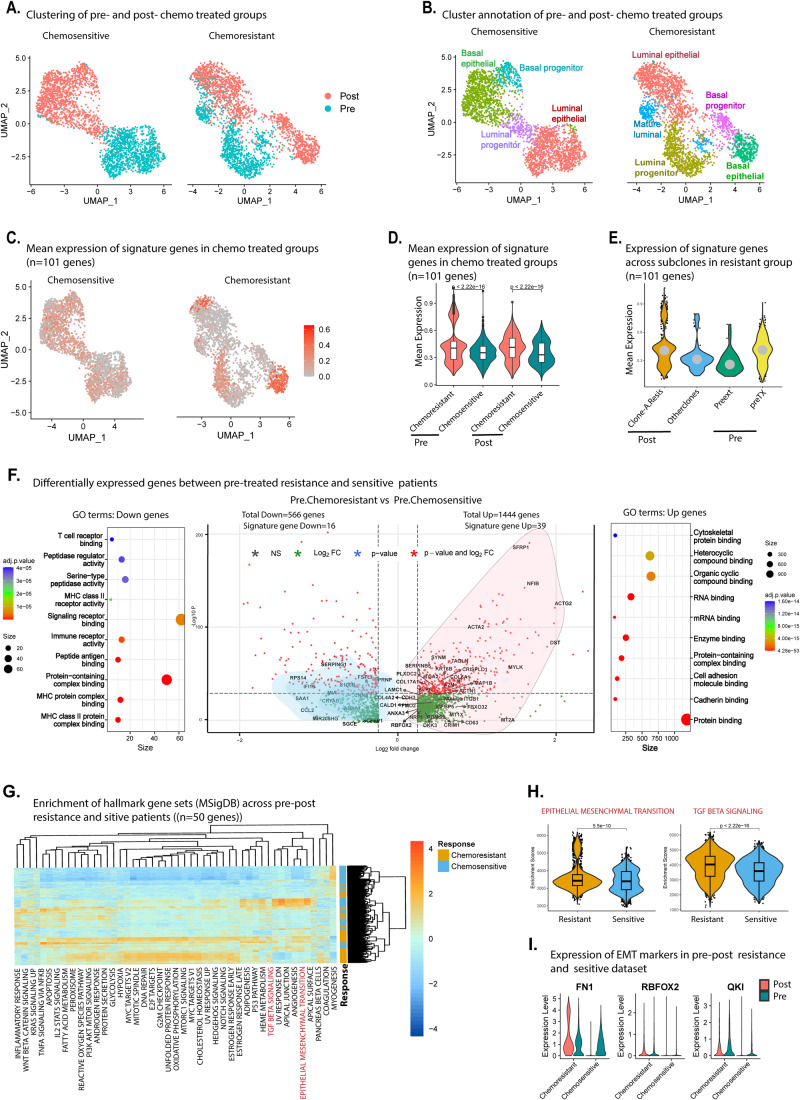
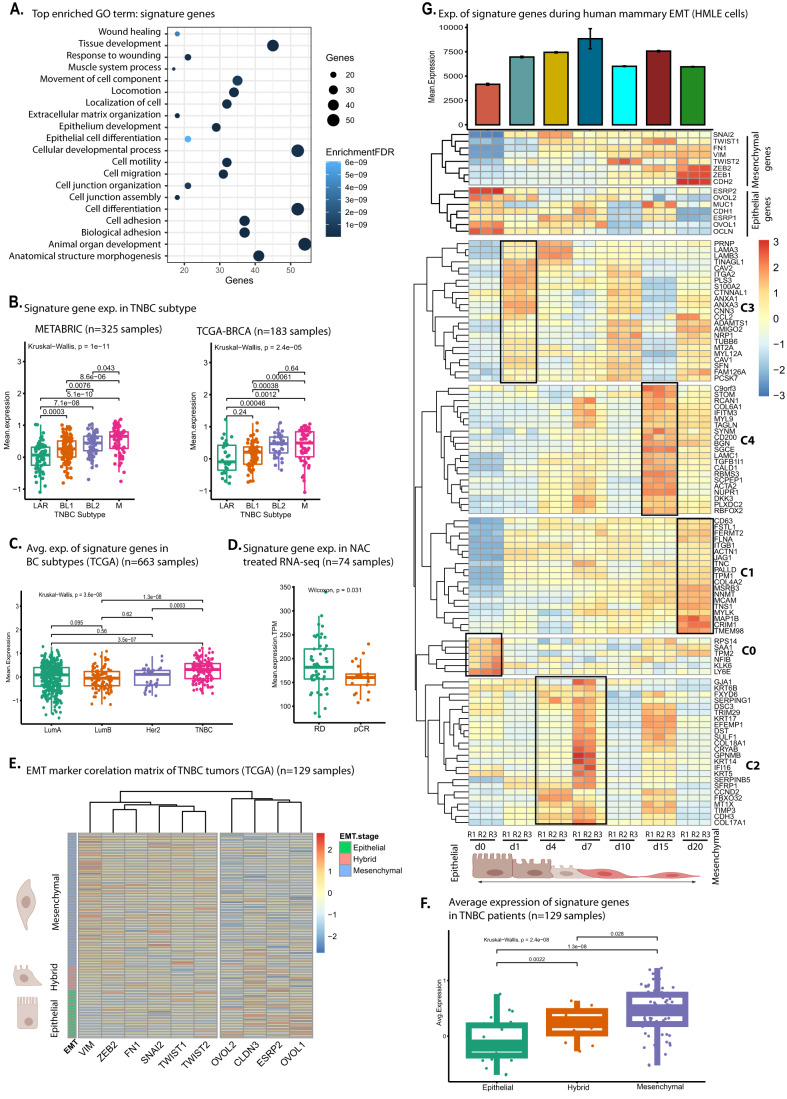
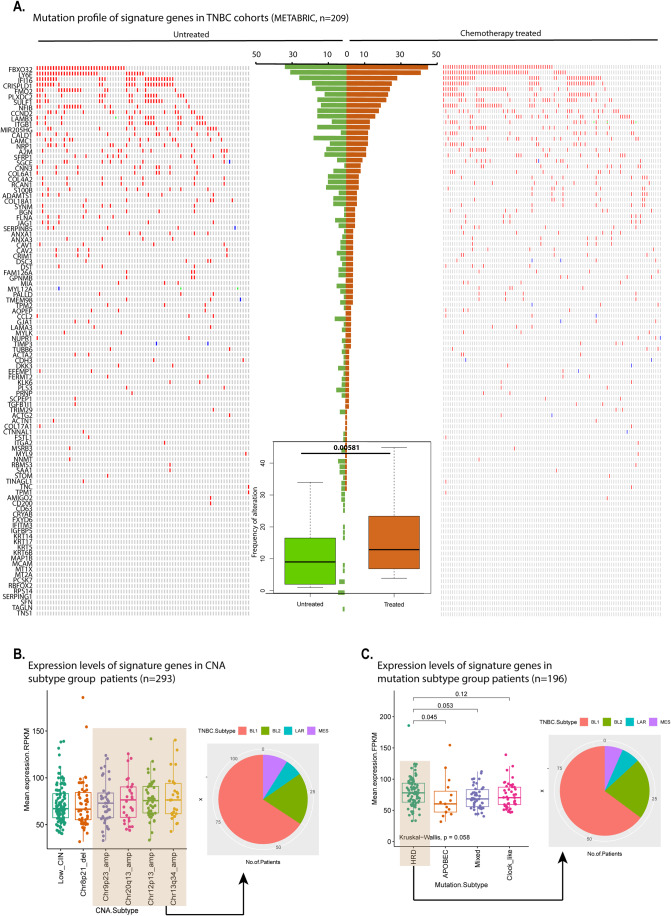
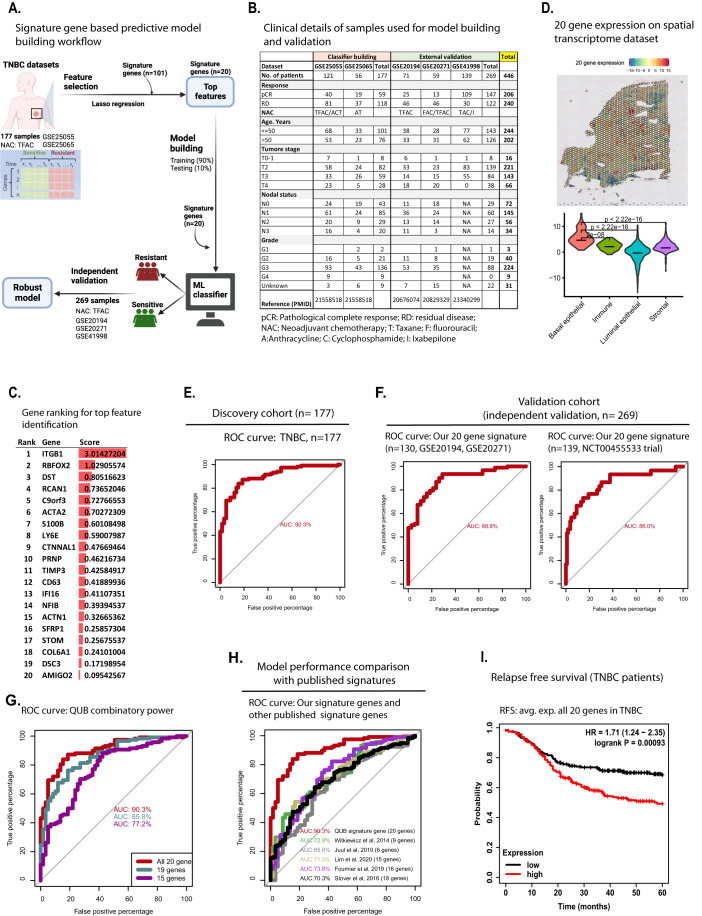
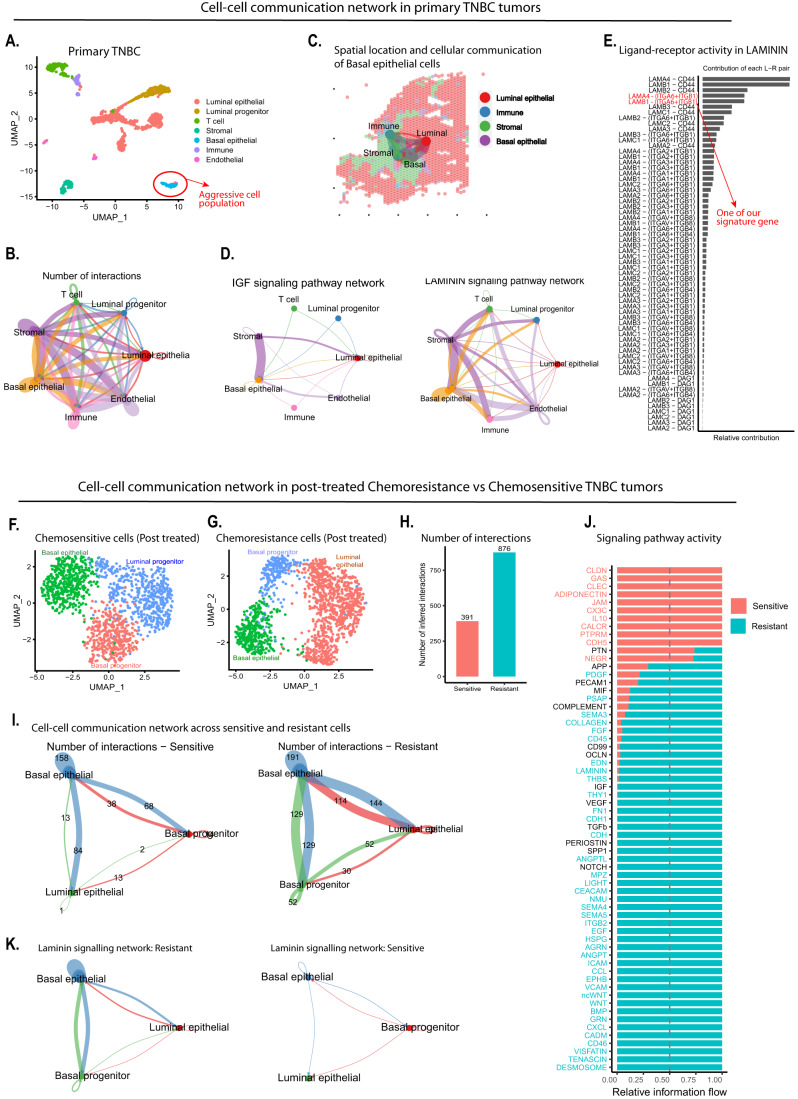
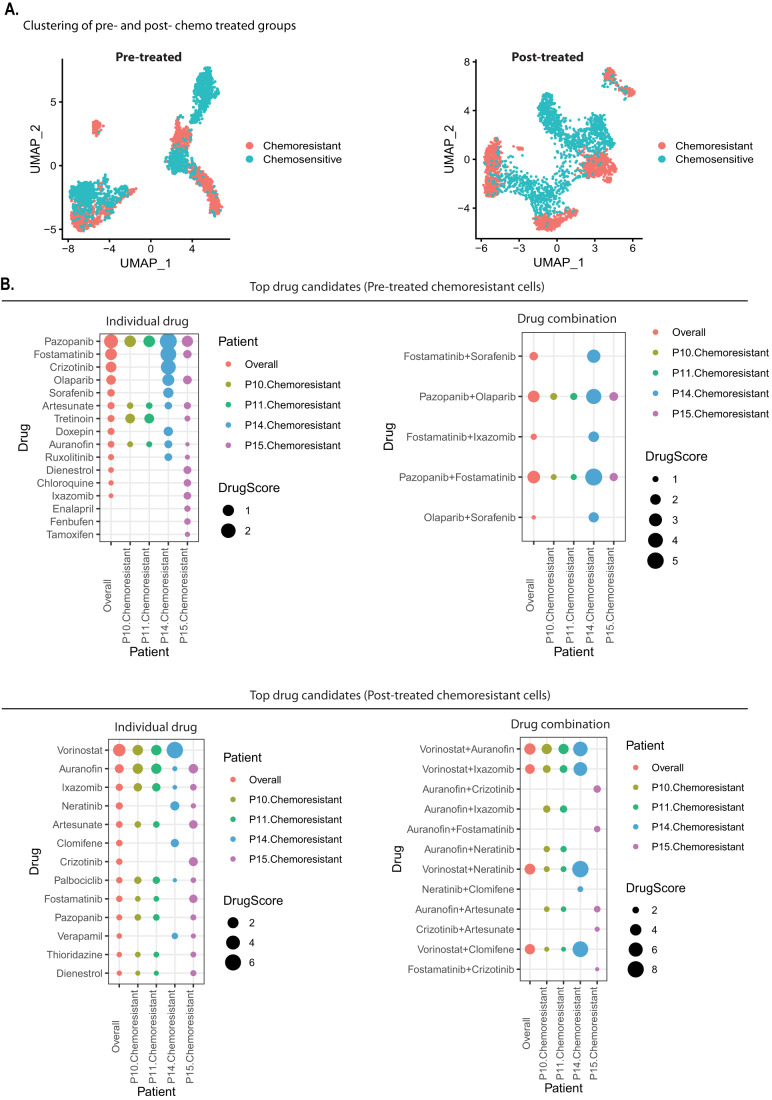
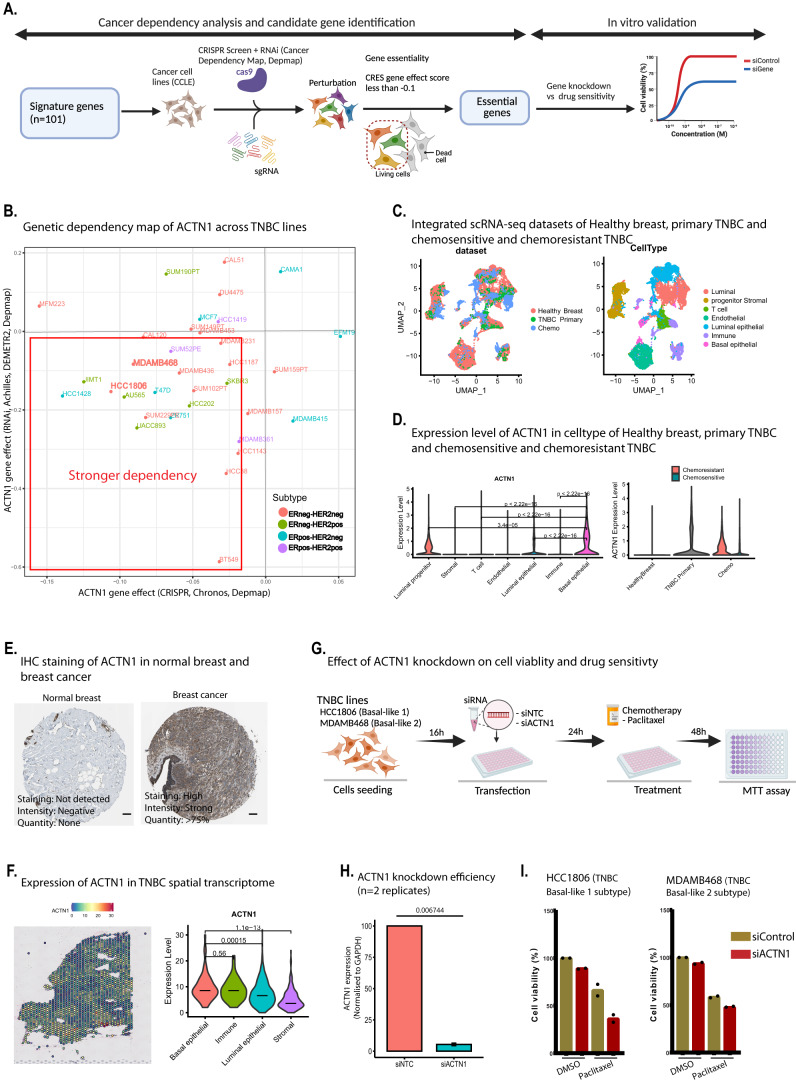
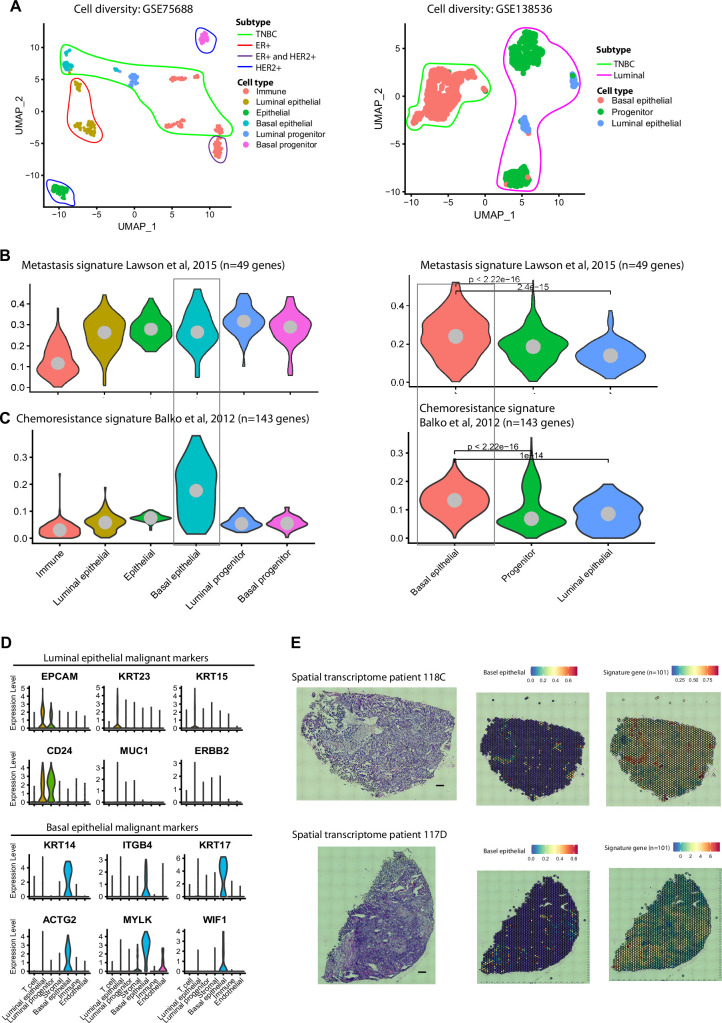
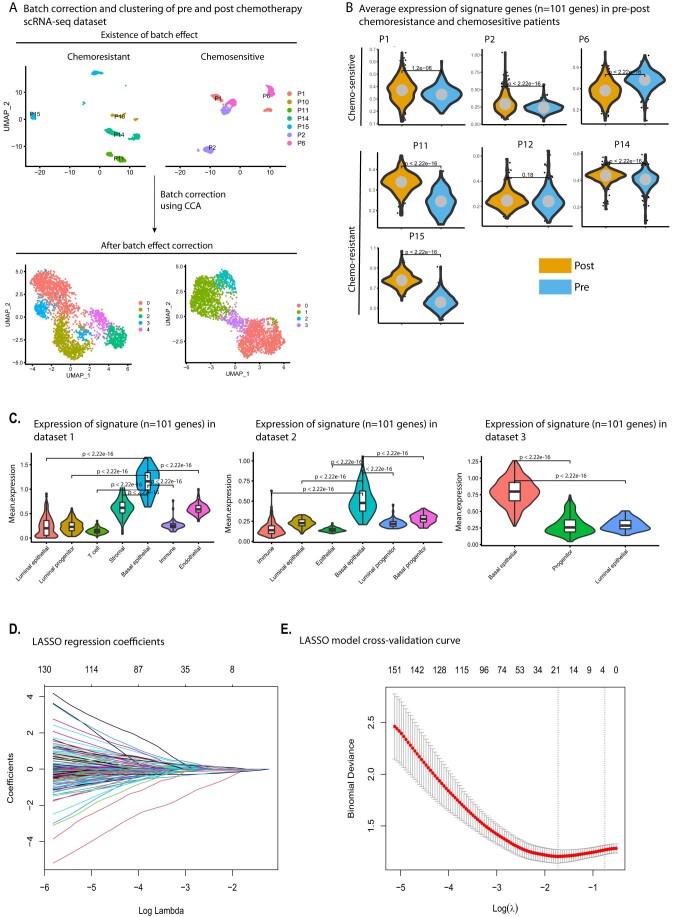
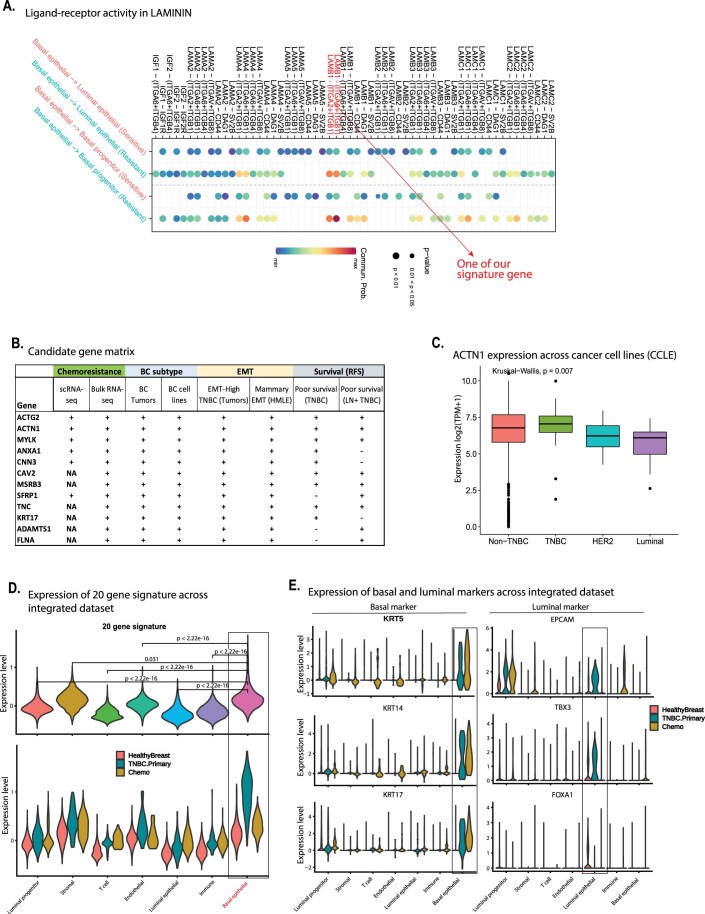
Triple-negative breast cancer (TNBC) is the most aggressive breast cancer subtype, characterized by extensive intratumoral heterogeneity, high metastasis, and chemoresistance, leading to poor clinical outcomes. Despite progress, the mechanistic basis of these aggressive behaviors remains poorly understood. Using single-cell and spatial transcriptome analysis, here we discovered basal epithelial subpopulations located within the stroma that exhibit chemoresistance characteristics. The subpopulations are defined by distinct signature genes that show a frequent gain in copy number and exhibit an activated epithelial-to-mesenchymal transition program. A subset of these genes can accurately predict chemotherapy response and are associated with poor prognosis. Interestingly, among these genes, elevated ITGB1 participates in enhancing intercellular signaling while ACTN1 confers a survival advantage to foster chemoresistance. Furthermore, by subjecting the transcriptional signatures to drug repurposing analysis, we find that chemoresistant tumors may benefit from distinct inhibitors in treatment-naive versus post-NAC patients. These findings shed light on the mechanistic basis of chemoresistance while providing the best-in-class biomarker to predict chemotherapy response and alternate therapeutic avenues for improved management of TNBC patients resistant to chemotherapy.

Keywords: Breast Cancer; EMT; Genomics; Metastasis; Therapy Resistance.


Figures

Figure 1
Figure 1. Single-cell transcriptomic analysis reveals cell populations associated with TNBC aggressiveness.
(A) Schematic workflow of the study. We utilized scRNA-seq datasets of treatment-naive primary and chemotherapy-treated TNBC patients and identified small cell populations of basal epithelial cells associated with chemoresistance-like characteristics. The spatial arrangements of these aggressive cells within tissue sections of resistant TNBC tumors was identified. Further, genes defining these subpopulations were validated in bulk RNA-seq of tumors chemoresistance tumors and utilized for building a predictive model in stratifying patients with residual disease and pathological complete response. The potential drug candidates against chemoresistant cells was identified using drug repurposing approach. (B) The scRNA-seq data analysis shows cellular heterogeneity profile within six primary TNBC tumors. The genes defining each cluster were annotated against cellmarker database to assign cell-types identity to each cluster. (C) Violin plot showing expression of signature genes associated with metastasis (right plot) signatures. The expression of metastasis signature of 49 genes from Lawson et al, was plotted across each cluster. The chemoresistance signature (left plot) of 143 genes from Balko et al, expression was plotted across each cell type. In the box-and-whisker within violin plots, the horizontal lines mark the median, the box limits indicate the 25th and 75th percentiles, and the whiskers extend to 1.5× the interquartile range from the 25th and 75th percentiles. The statistical testing of expression levels of metastasis and chemoresistant genes between the cell types was performed using two-tailed unpaired Wilcoxon test in stat_compare_means() of ggpubr package. (D) The infercnv analysis of TNBC epithelial cells. The upper heatmap plot shows copy number alternation profile in healthy mammary epithelial cells. The lower heatmap plot showing CNV profile in TNBC epithelial cells. We have used total 240 healthy mammary epithelial cells to compute somatic copy number alteration in TNBC epithelial, including basal epithelial cells. Regions of chromosomal amplification manifest as blocks of red, while chromosomal deletions manifest as blue blocks, providing a visual representation of the copy number changes. (E) Copy number score, “infercnv scores” computed from inferCNV analysis of normal vs TNBC epithelial cells. The top left histogram plot shows binomial distribution of infercnv score of normal epithelial vs TNBC epithelial cells. The infercnv scores less than 0.2 defined normal epithelial cells and score greater than 0.2 defined TNBC epithelial cell types. The right histogram plot shows cell-type level infercnv score distribution. The red dotted lines shows infercnv scores threshold separating normal epithelial from TNBC epithelial cells. The lower left boxplot was used to plot to calculate statistical difference of infercnv score between the normal and TNBC epithelial cell types. In the box-and-whisker plots, the horizontal lines mark the median, the box limits indicate the 25th and 75th percentiles, and the whiskers extend to 1.5× the interquartile range from the 25th and 75th percentiles. The statistical testing of infercnv score between the normal and TNBC epithelial cells was performed using two-tailed unpaired Wilcoxon test in stat_compare_means() of ggpubr package. (F) Spatial transcriptome dataset of aggressive TNBC tumor. Left plot is an H&E-stained image of TNBC patient with recurrence within 9.4 months. The right plot shows the cell-type annotation of spot-level data. The annotation was assigned from spatial deconvolution using the primary TNBC tumor scRNA-seq dataset used in Fig. 1B. The yellow line in left plot is discriminating the fibrous cells (encircled) and tumor epithelial cells. (G) Venn diagram showing basal epithelial populations defining genes, reproducible across three datasets. Basal epithelial cell-type-defining genes overlapped between all three datasets and genes evident in at least two datasets were considered as reproducible signature genes. (H) Kaplan–Meier survival analysis plot showing correlation of signature gene expression with 5-year relapse-free survival (RFS) in TNBC patients. Analysis was performed using mean expression levels of all 101 signature genes in 417 TNBC patients using kmplotter. Source data are available online for this figure.
Figure 2
Figure 2. Chemoresistance is associated with an active EMT program in treatment naive tumors enriched for our signature genes.
Expression analysis of signature genes in seven TNBC tumors (collected pre-treatment and after six cycles of NAC (docetaxel and epirubicin) (post treatment) were analyzed. (A) UMAP plot of chemosensitive and chemoresistance patients indicating pre and post-treated cells. (B) Cell-type annotation of pre and post-treated chemosensitive (n = 2497 cells) and chemoresistance (n = 2492 cells) shown in (A). (C) The UMAP plot showing mean expression profile of signature genes between the resistant and sensitive groups. (D) The mean expression profile of signature genes between the pre and post-treated resistant and sensitive groups is indicated in the violin plot. (E) Plot showing expression of signature genes across pre- and posttreatment subclones in chemoresistant patients. (D, E) In the box-and-whisker within violin plots, the horizontal lines mark the median, the box limits indicate the 25th and 75th percentiles, and the whiskers extend to 1.5× the interquartile range from the 25th and 75th percentiles. The statistical testing of expression levels of signature genes between groups was performed using two-tailed unpaired Wilcoxon test in stat_compare_means() of ggpubr package. (F) Differentially expressed genes between untreated chemosensitive and chemoresistant cells are shown in the volcano plot. Gene highlighted with names inside the volcano plot are within our 101 signature gene list. The dot plot present on each side of the volcano plot represents enrichment of gene ontology biological processes for genes that were downregulated (left panel) and upregulated (right panel) in chemoresistant versus chemosensitive cells. The significantly altered genes was identified using combined binomial and normal–theory likelihood ratio test in MAST. (G) The Heatmap shows enrichment of 50 hallmark signature pathways in chemosensitive and chemoresistance subpopulations using the Molecular Signatures Database (MSigDB). The pathways highlighted in the red and orange boxes are enriched in chemoresistance and chemosensitive subpopulations. (H) The violin plot shows enrichment of EMT and TGF-b pathway genes in resistant and sensitive group of cells. In the box-and-whisker within violin plots, the horizontal lines mark the median, the box limits indicate the 25th and 75th percentiles, and the whiskers extend to 1.5× the interquartile range from the 25th and 75th percentiles. The significance test was performed using two-tailed unpaired Wilcoxon test. (I) Violin plot showing expression of hallmark EMT genes across pre and post-treated chemoresistance and chemosensitive patients. Source data are available online for this figure.
Figure 3
Figure 3. Chemoresistance-associated signature genes are induced during EMT and are expressed at higher levels in EMT-high TNBC tumors.
Chemoresistance-associated signature genes are TNBC subtype-specific and have activated EMT programs. (A) The dot plot shows gene ontology analysis of our signature genes enriched for biological processes associated with EMT. (B) The boxplot showing the mean expression of our signature genes across molecular subtypes of TNBC patients. The mean expression levels of our signature genes were plotted across TNBC molecular subtype luminal androgen receptor (LAR), basal-like 1 (BL1), basal-like 2 (BL2), and mesenchymal (M) in two independent cohorts i.e., METABARIC and TCGA-BRCA cohorts. (C) Boxplot of TCGA breast cancer cohort showing mean expression of signature genes across different subtypes of breast cancer. Expression profile of signature genes extracted from TCGA breast cancer cohort and each tumor classified into four subtypes i.e., LuminalA, LuminalB, HER2, and TNBC based on ER, PR, HER2 status. Next, the average expression of our signature genes was plotted across subtypes of breast cancers. (D) Boxplot showing mean expression of signature genes in bulk RNA-seq datasets of 74 chemotherapy-treated TNBC patients. (E) Expression of signature genes in EMT-High, Hybrid and EMT-Low TNBC tumors. Heatmap showing the classification of TCGA TNBC tumors into EMT-high (Mesenchymal), Hybrid and EMT-low (Epithelial) groups based on the expression of hallmark epithelial (4 genes) and mesenchymal (6 genes) genes. (F) Boxplot showing average expression of signature genes in EMT-High, Hybrid and EMT-Low TNBC (TCGA) cohort. (BD, F) In the box-and-whisker plots, the horizontal lines mark the median, the box limits indicate the 25th and 75th percentiles, and the whiskers extend to 1.5× the interquartile range from the 25th and 75th percentiles. The statistical testing of expression levels of signature genes between the groups was performed using two-tailed unpaired Wilcoxon test in stat_compare_means() of ggpubr package. (G) The Heatmap showing expression dynamics of signature genes across different EMT timepoints (TGFβ treated) of mammary epithelial cells (HMLE) RNA-seq. The time point labeled with d0 are untreated and d1-d20 are different EMT timepoints treated with TGF-b from day 1 to day 20. The upper cluster represents the expression of hallmark EMT genes during TGFβ-induced EMT. The lower heatmap shows a cluster of genes represented by C is on the right side of the heatmap representing EMT induction time-specific genes. The mean expression of signature genes during TGFβ induced EMT in HMLE cells is shown on the top of the barplot. The Error bar plotted based on the standard deviation calculated using three replicates of each timepoints. (AF) The “n” represents total number of samples taken for the analysis. Source data are available online for this figure.
Figure 4
Figure 4. Elevated expression of signature genes in TNBC associated with an increased copy numbers, particularly in HRD subtype with basal-like characteristics.
Signature genes elevated in tumors of HRD subtype with increase copy numbers changes. (A) Oncoprint heatmap showing mutations and copy number alteration in METABARIC cohort. The left and right heatmap shows alternations in signature genes through deep deletion, amplification, missense, and truncating mutations in both chemotherapy-treated and -untreated TNBC patients. The bar graph in the center represents the frequency of mutations of each gene in TNBC patients. The boxplot in the center shows overall mutational frequency between chemotherapy-treated and untreated tumors. The significance test between chemotherapy-treated and untreated groups was performed using one-tailed paired t test. (B) The boxplot showing the expression of our signature genes among six previously defined CNA subtypes of TNBC (Jiang et al, 2019). (C) Boxplot showing mean expression of signature genes in four mutational subtypes of TNBC patients, homologous recombination deficiency (HRD), APOBEC, clock-like and mixed. HRD mutation type is defined by alteration in HRD-related genes; APOBEC type is defined by a mutation in APOBEC-related genes; clock-like is defined by a genetic alteration in clock-like genes, and mixed is defined by no dominant gene signature. The significance test between mutation subtypes was performed using two-tailed unpaired Wilcoxon test. (A, C) In the box-and-whisker plots, the horizontal lines mark the median, the box limits indicate the 25th and 75th percentiles, and the whiskers extend to 1.5× the interquartile range from the 25th and 75th percentiles. Source data are available online for this figure.
Figure 5
Figure 5. A 20-gene panel can accurately predict chemotherapy response in TNBC patients.
The predictive model development and validation with 20 gene expression levels using the least absolute shrinkage and selection operator (LASSO) regression method. (A) Predictive model building workflow. (B) Clinical details of TNBC samples used for model building and validation. (C) Ranking of genes based on the lambda score obtained from glmnet. (D) Mean expression of 20 genes on the spatial transcriptome dataset. The bottom violin plot shows mean expression of 20 genes within cell types of spatial transcriptome dataset. (E) The receiver operating characteristic (ROC) curves of the discovery cohort TNBC dataset (n = 177, 2 datasets—GSE25055, GSE25065) for pCR and RD prediction using 20 gene expressions as a feature. (F) The ROC curves of the TNBC validation dataset (n = 130, 2 datasets—GSE20194, GSE20271) and NCT00455533 trial dataset (GSE41998, n = 139) for pCR and RD prediction using 20 gene expressions as a feature. (G) The ROC curves were generated for all 20 gene features (red); after the removal of one gene (cadetblue); and the removal of 5 genes (purple) to assess the impact of the combination of genes on the model performance. The ROC curve highlighted with the red line used all 20 genes, whereas the model with reduced gene sets (highlighted with cadetblue and purple line) showed a difference in discriminating ability in predicting pCR vs RD in TNBC. (H) The ROC curve shows the comparative performance of our model (QUB signature gene panel) with five published signatures. Here we used the same cohort for all five gene signatures to compare the performance of our model with the published ones. (I) Kaplan–Meier survival analysis plot showing correlation of 20 gene expression with 5-year relapse-free survival (RFS) in TNBC (top) (n = 417). Source data are available online for this figure.
Figure 6
Figure 6. Chemoresistant cells communicate through distinct signaling pathways which is enhanced following exposure to chemotherapy.
(A) UMAP clusters of scRNA-seq datasets of primary TNBC tumors. (B) Circle plot showing number of interactions between the cell types in primary TNBC scRNA-seq dataset. (C) Cell–cell communication of the epithelial cells including basal epithelial with other cell types within TNBC spatial transcriptome dataset. The line and its width represent the strength of the cellular communications between the cell types on the histological section. (D) Circle plot showing key signaling pathways involved in intercellular communications between the basal and other cell types in TNBC. (E) Bar plot showing ligand-receptor interaction of LAMININ signaling pathway for intercellular communication in TNBC. (F, G) UMAP plot of post chemotherapy-treated chemoresistance and chemosensitive cells. (H) Bar plot showing the total number of interactions in the resistant and sensitive group of cells. (I) Circle plot showing the number of interactions between the cell types in chemosensitive and chemoresistant datasets. (J) Plot shows key signaling pathways enriched in chemoresistant and chemosensitive cells. (K) Circle plot showing the number of interactions of the intercellular signaling pathway in chemosensitive and chemoresistant cells. Source data are available online for this figure.
Figure 7
Figure 7. Drug repurposing analysis of chemoresistant cells identifies potential FDA-approved drugs to overcome chemoresistance.
(A) UMAP showing cell clusters of pre- and post-NAC-treated TNBC tumors. The single-cell RNA-seq datasets used in Fig. 2 were utilized for drug repurposing analysis using ASGARD pipeline. (B) The top and bottom dot plot show top-ranked drugs (FDR <0.05) that had high drug scores for pre- and post-NAC-treated resistant cells, respectively, for all patients combined (overall) as well as in each chemoresistant TNBC patient. Source data are available online for this figure.
Figure 8
Figure 8. The cancer dependency map of our signature genes and its correlation with drug sensitivity in TNBC lines.
(A) The workflow of cancer dependency analysis and candidate gene validation performed in the present study. (B) The scatter plot shows the genetic dependency of ACTN1 in TNBC lines. The X and Y axis indicate dependency score derived from CRISPR and RNAi-based perturbation screens, respectively. The dependency score was obtained from CRISPR (CRISPR, Chronos, Depmap) and RNAi (Achilles, DEMETR2) from DeepMap (https://depmap.org/portal/download/). (C) UMAP plot is the integrated scRNA-seq profiles of healthy breast, primary TNBC and pre-post chemotherapy-resistant and -sensitive cells. (D) The expression of the ACTN1 gene was plotted in the violin plot, showing mRNA levels across different cell types of integrated healthy breast, primary TNBC and chemotherapy-treated TNBC cells. The right violin plot shows expression of ACTN1 across healthy, primary TNBC and chemotreated-resistant and -sensitive TNBC cells. The significance test of expression levels of ACTN1 between the cell types was performed using two-tailed unpaired Wilcoxon test in stat_compare_means() of ggpubr package. (E) IHC staining (scale bar, 10 μm) analysis of protein levels of ACTN1 in samples of healthy breast and breast cancer, derived from human protein atlas (HPA). (F) ACTN1 expression level in a TNBC spatial transcriptome dataset. The left plot shows the expression of ACTN1 in the spatial transcriptome dataset. The right plot shows the enrichment of the ACTN1 gene in spatially annotated cell types (deconvoluted from the primary TNBC scRNA-seq dataset used in Fig. 1B). The significance test of expression levels of ACTN1 between the cell types was performed using two-tailed unpaired Wilcoxon test in stat_compare_means() of ggpubr package. (G) Candidate gene ACTN1 knockdown and drug-sensitivity workflow. (H) Barplot shows knockdown efficiency of ACTN1 in HCC1806 and MDAMB-468 cell line. The data with error bars are shown as mean ± SD. Statistical significance was calculated by two-tailed Student t test. (I) Barplot shows cell viability after transfection with the indicated siRNAs of control (siControl) and candidate genes (siACTN1) knockdown in combination with Paclitaxel chemotherapy in micromolar concentration (μM). Data are representative of two experiments conducted in triplicates. The dot on each bar shows individual data points of two experiments. Source data are available online for this figure.
Figure EV1
Figure EV1
(A) scRNA-seq data analysis of pre-treated primary TNBC patients identified a similar subpopulation in two independent scRNA-seq of TNBC datasets. The cell clusters marked under lines are representing, cells belonging to the breast cancer subtype. The genes defining each cluster were annotated against the cellmarker database and cell-type identities were assigned to each cluster. (B) Expression of metastasis-associated genes in pre-treated TNBC patients scRNA-seq datasets. The metastasis signature of 49 genes was used by Lawson et al, and their average expression was plotted across each cluster in both datasets. (C) Chemoresistance signature of 143 genes was used by Balko et al, and their average expression was plotted across each cell types in both datasets. (B, C) The significance test of expression levels of metastasis and chemoresistance genes between the cell types was performed using two-tailed unpaired Wilcoxon test in stat_compare_means() of ggpubr package. (D) The violin plots show expression of malignant cell markers of Luminal and basal breast cancer type. The cancer cell marker of basal and luminal epithelial type was retrieved from CellMarker database and plotted on our primary TNBC dataset. (E) Spatial transcriptome data of two recurrent TNBC patients. The left plots show the H&E staining (scale bar, 10 μm) of two TNBC tumors. The middle plot shows the spatial location of basal epithelial cells within these spatial datasets. Right plot showing the mean expression of our 101 signature genes in these spatial transcriptome datasets.
Figure EV2
Figure EV2
(A) The upper umap plot shows existence of possible batch effect in resistant and sensitive datasets. The batch effects regress out using canonical correlation analysis (CCA) and samples were integrated. The bottom umap plots shows removal of possible batch effects from the datasets. Total cluster identified in the single-cell datasets of 7 TNBC patients pre- and post chemotherapy are also shown in the same bottom plot. (B) The average expression profile of signature genes in each patient of pre- and post-treated groups. The significance testing of expression of signature genes between the chemotherapy-treated and untreated groups was performed using two-tailed unpaired Wilcoxon test in stat_compare_means() of ggpubr package. (C) Violin plot showing average expression of signature genes across clusters of all three primary TNBC tumor datasets. The average expression of all 101 signature genes was plotted in all three primary TNBC scRNA-seq datasets and confirmed their activation in similar subpopulations of basal epithelial cells. In the box-and-whisker within violin plots, the horizontal lines mark the median, the box limits indicate the 25th and 75th percentiles, and the whiskers extend to 1.5× the interquartile range from the 25th and 75th percentiles. The significance test of expression levels of signature genes between the cell types was performed using two-tailed unpaired Wilcoxon test in stat_compare_means() of ggpubr package. (D) The coefficients from the Lasso fit represent the contributions of the 20 genes expression in the model. The plot shows lasso regression coefficient values in which each curve corresponds to a variable. It shows the path of its coefficient against the Log Lamda of the whole coefficient vector as λ varies. The axis above indicates the number of nonzero coefficients at the current λ, which is the effective degrees of freedom (df) for the lasso. (E) The selection of tuning parameter (λ) in the LASSO model based on the tenfold cross-validation. The plots are showing a cross-validation curve (red dotted line) along with mean binomial deviance against a range of Log(λ). The vertical dotted lines represent lambda. min and lambda.1se. This panel shows the changes in partial likelihood deviance with λ values. The 20 genes were selected according to the most regularized model such that the error is within one standard error of the minimum.
Figure EV3
Figure EV3
(A) Bar plot showing ligand receptor involved in intercellular signaling of LAMININ signaling pathway. The significance test between signaling pathway signals was computed using two-tailed unpaired Wilcoxon test using the presto package. (B) Table showing candidate gene ranking matrix. The “+” symbol indicates the presence and the “–“ sign indicates the absence of a parameter in each of the genes. (C) Expression of ACTN1 in TNBC, HER2, Luminal, and non-TNBC cell lines. Expression values were obtained from CCLE. The axis shows TNBC, HER2, Luminal, and non-TNBC cancer cell lines and the y axis is their mRNA expression levels. In the box-and-whisker plots, the horizontal lines mark the median, the box limits indicate the 25th and 75th percentiles, and the whiskers extend to 1.5× the interquartile range from the 25th and 75th percentiles. The significance test of expression levels of ACTN1 was performed using Kruskal–Wallis test in ggpubr package. (D) The expression of the 20-gene signature across the cell types shown in upper plot of healthy breast, primary TNBC and chemotherapy-treated TNBC data sets and lower plot shows dataset-wise expression profile. The statistical testing of expression levels of 20 gene was performed using two-tailed unpaired Wilcoxon test in stat_compare_means() of ggpubr package. (E) The expression of basal markers (left violin plots) and luminal epithelial (right violin plot) markers across cell types of the healthy breast, primary TNBC and chemotherapy-treated TNBC cells.

References

    1. Adriance MC, Inman JL, Petersen OW, Bissell MJ. Myoepithelial cells: good fences make good neighbors. Breast Cancer Res. 2005;7:190–197. doi: 10.1186/bcr1286. - DOI - PMC - PubMed
    1. Alluri P, Newman LA. Basal-like and triple-negative breast cancers: searching for positives among many negatives. Surg Oncol Clin N Am. 2014;23:567–577. doi: 10.1016/j.soc.2014.03.003. - DOI - PMC - PubMed
    1. Almendro V, Cheng YK, Randles A, Itzkovitz S, Marusyk A, Ametller E, Gonzalez-Farre X, Munoz M, Russnes HG, Helland A, et al. Inference of tumor evolution during chemotherapy by computational modeling and in situ analysis of genetic and phenotypic cellular diversity. Cell Rep. 2014;6:514–527. doi: 10.1016/j.celrep.2013.12.041. - DOI - PMC - PubMed
    1. Ashburn TT, Thor KB. Drug repositioning: identifying and developing new uses for existing drugs. Nat Rev Drug Discov. 2004;3:673–683. doi: 10.1038/nrd1468. - DOI - PubMed
    1. Balko JM, Cook RS, Vaught DB, Kuba MG, Miller TW, Bhola NE, Sanders ME, Granja-Ingram NM, Smith JJ, Meszoely IM, et al. Profiling of residual breast cancers after neoadjuvant chemotherapy identifies DUSP4 deficiency as a mechanism of drug resistance. Nat Med. 2012;18:1052–1059. doi: 10.1038/nm.2795. - DOI - PMC - PubMed

MeSH terms