. 2024 Jun;20(6):751-760.
doi: 10.1038/s41589-024-01562-z. Epub 2024 Mar 13.

De novo-designed transmembrane proteins bind and regulate a cytokine receptor

Affiliations

De novo-designed transmembrane proteins bind and regulate a cytokine receptor

Marco Mravic et al. Nat Chem Biol. 2024 Jun.

Abstract

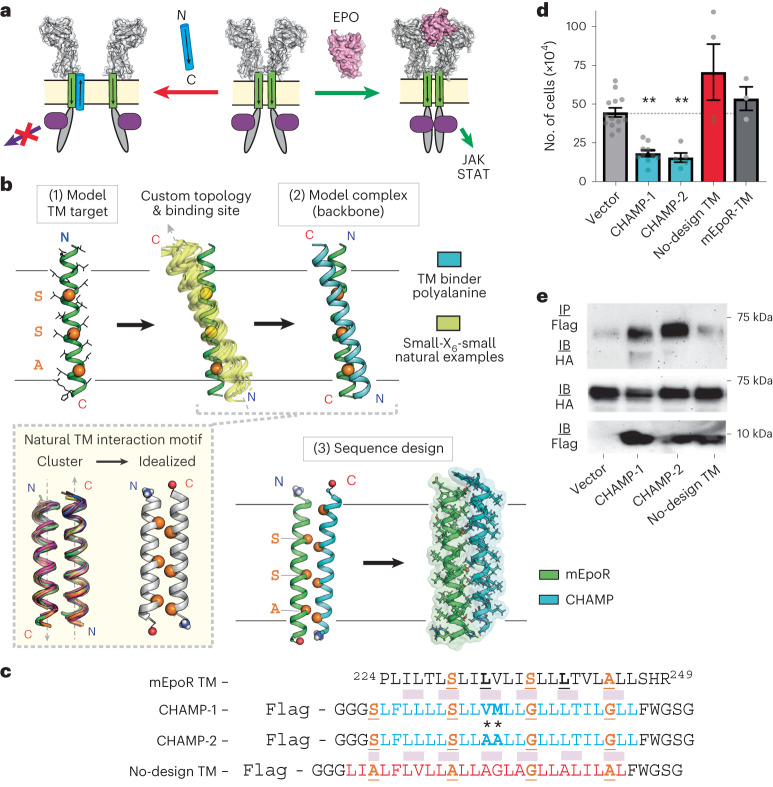
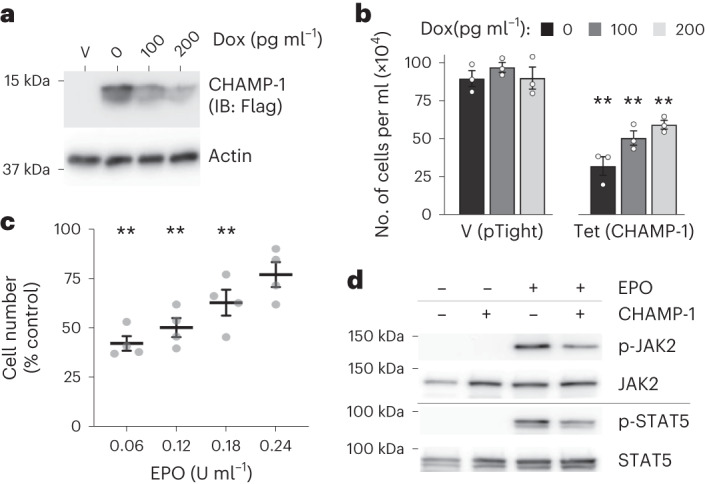
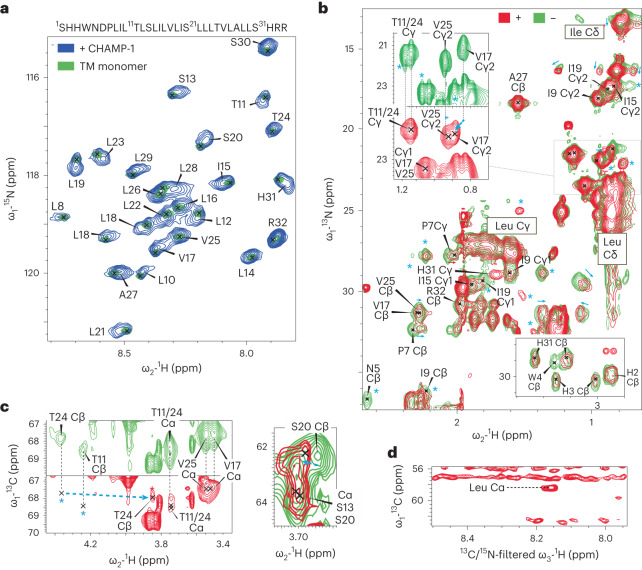
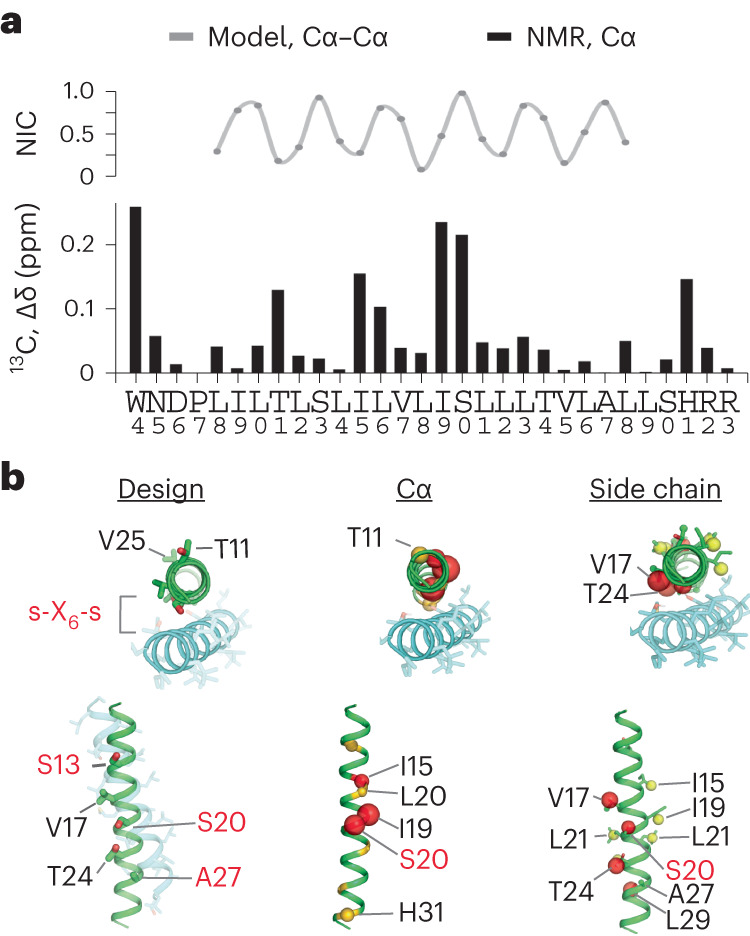
Transmembrane (TM) domains as simple as a single span can perform complex biological functions using entirely lipid-embedded chemical features. Computational design has the potential to generate custom tool molecules directly targeting membrane proteins at their functional TM regions. Thus far, designed TM domain-targeting agents have been limited to mimicking the binding modes and motifs of natural TM interaction partners. Here, we demonstrate the design of de novo TM proteins targeting the erythropoietin receptor (EpoR) TM domain in a custom binding topology competitive with receptor homodimerization. The TM proteins expressed in mammalian cells complex with EpoR and inhibit erythropoietin-induced cell proliferation. In vitro, the synthetic TM domain complex outcompetes EpoR homodimerization. Structural characterization reveals that the complex involves the intended amino acids and agrees with our designed molecular model of antiparallel TM helices at 1:1 stoichiometry. Thus, membrane protein TM regions can now be targeted in custom-designed topologies.


Conflict of interest statement

The authors declare no competing interests.

Figures

Fig. 1
Fig. 1. Design of TM proteins binding to mEpoR.
a, CHAMPs (blue) targeting mEpoR’s TM domain (green) designed with antiparallel TM domain topology to competitively inhibit mEpoR homodimerization and impair cross-membrane activation of JAK−STAT signaling induced by EPO (pink) and JAK2 (purple). b, CHAMP algorithm. mEpoR’s TM helix (green) is modeled. A binding polyalanine CHAMP (blue) is positioned to mEpoR’s small-X6-small motif (orange, spheres) using a structural informatics approach modeling an idealized helix−helix geometry based on data mining natural examples of the TM motif (yellow, inset). De novo CHAMP sequences were designed with RosettaMP. c, TM sequences of mEpoR (leucine zipper repeat, bolded; small-X6-small, orange) and Flag-tagged synthetic TM constructs: no-design control (red) and CHAMPs (blue). Protein−protein interface, pink. Asterisks designate key differences. d, Mouse BaF3/mEpoR cell counts on day 6 in IL-3-free medium with 0.06 U ml−1 EPO stimulating proliferation when expressing the empty vector or synthetic TM domain constructs (vector, n = 13; CHAMP-1, n = 9 (P < 0.001); CHAMP-2, n = 5 (P < 0.001); no-design TM, n = 4; mEpoR-TM, n = 3; where n is the number of biological replicates). Error bars, standard error. Asterisks indicate P values reaching <0.05 from two-tailed unpaired Welch’s t-test compared with empty vector transduced cell counts. e, Flag-tagged TM proteins pull down HA-tagged mEpoR after co-expression in BaF3/mEpoR cells (representative of n = 3). IB, immunoblot; IP, immunoprecipitated. Source data
Fig. 2
Fig. 2. De novo TM domains target mEpoR in the intended dimeric antiparallel type II topology.
a, Top, equilibrium thiol-disulfide exchange wherein mEpoR-TM peptide with an N-terminal cysteine (green) and each designed TM peptide with a C-terminal cysteine (blue) were reversibly oxidized by mixed glutathione in POPC small unilamellar vesicles (1:50 peptide to lipid ratio). Middle, legend of disulfide-bonded species: mEpoR homodimer (green), antiparallel CHAMP−mEpoR heterodimer (purple), TM design homodimer (blue). Bottom, molar fractions of covalent dimer species (parts of a whole plot) quantified by HPLC (Supplementary Fig. 1; n = 3). Blue, N terminus; red, C terminus. b, Competitive thiol-disulfide exchange (detailed scheme in Extended Data Fig. 3). Top, legend of peptides. Biotin−nCys−mEpoR-TM peptide (green) reconstituted with both nCys−CHAMP-1 (red) and cCys−CHAMP-1 (purple) was reversibly oxidized all together in C14-Betaine micelles, testing the preference for parallel and antiparallel dimeric species, respectively. Bottom, covalent species captured (streptavidin beads) were reduced, eluted as monomeric peptides and quantified by HPLC (representative of n = 3). c, Split GFP complementation assay and flow cytometry of BaF3 cells expressing mEpoR−GFP1-10 or hEpoR−GFP1-10 in the presence or absence of co-expressed N-terminal GFP11−CHAMP-1 fusion (representative of n = 3 trials). GFP reconstitution indicates GFP11 cytoplasmic localization and CHAMP-1 type II TM orientation. d, mEpoR:CHAMP-1 stoichiometry. Dots represent the mean relative (Rel.) donor fluorescence emission quenching of 1.5 µM 7-diethylamino-4-methylcoumerin-labeled mEpoR-TM peptide titrated with fluorescein-labeled CHAMP-1 in C14B at a fixed equimolar total peptide concentration (n = 3; bars, standard error). Theoretical FRET curves overlaid for monomer, dimer (1:1) and trimer (2:1) assemblies.
Fig. 3
Fig. 3. Expression of designed TM protein CHAMP-1 inhibits the EPO−mEpoR signaling cascade.
a, Dox repression of Flag-tagged CHAMP-1 expression levels from a tetracycline-responsive promoter in BaF3/mEpoR cells expressing the tTA tetracycline transactivator, measured by SDS−PAGE and anti-Flag immunoblot of cells treated with Dox titration. Performed once (n = 1). Actin is a loading control. V, empty vector. b, Mean number of cells after growth in medium supplemented with 0.06 U ml−1 EPO treated with 0, 100 or 200 pg ml−1 Dox for cells expressing CHAMP-1 compared to empty vector (pTight) transduced cells (from left to right, P = 0.002, 0.002 and 0.037, respectively; n = 3). Bars, standard error; P-values from unpaired Welch’s t-test. c, Mean number of BaF3/mEpoR cells expressing CHAMP-1 after incubation for 6 days in medium containing EPO concentrations of 0.06, 0.12, 0.18 and 0.24 U ml−1 (from left to right, P = 0.033, 0.025, 0.003 and 0.08, respectively; unpaired two-tailed Welch’s t-test; n = 4 replicate experiments) relative to the number of cells not transduced with CHAMP-1 similarly treated with EPO. d, BaF3/mEpoR cell extracts having CHAMP-1 expression and/or 1 U ml−1 EPO treatment for 10 min subjected to SDS−PAGE and immunoblotted with antibodies recognizing either phosphorylated or total JAK2 or STAT5 (n = 1). **P < 0.05. Source data
Fig. 4
Fig. 4. Sequence-specific interaction between mEpoR and CHAMP-1.
a, Wild-type sequences for core TM regions of mEpoR, hEpoR and CHAMP-1. Dissimilar residues between mEpoR and hEpoR are indicated by bold letters and red asterisks. Mutated CHAMP-1 residues expected to be in contact with mEpoR from the design model include those in the small-X6-small repeat S1-S8-G15-G22 (red) and other amino acids at intermediate helix turns (orange). b, BaF3 cells stably expressing mEpoR mutants with single or double mEpoR-to-hEpoR amino acid substitutions co-expressed with wild-type CHAMP-1 were cultured in medium supplemented with 0.06 U ml−1 EPO. Day 6 mean cell counts are shown as a percentage, relative to the number of cells of wild-type BaF3/mEpoR/ cells with EPO-stimulation and CHAMP-1 expression (n = 3; bars, standard error) with significant increases denoted by asterisks; one-tailed Student’s t-test. P-values: L235V, 0.390; S237L, 0.082; L238V, 0.002; L235V/S237L, 0.005; L235V/L238V, 0.005; S237L/L238V, <0.001. c, BaF3/mEpoR cells stably expressing CHAMP-1 mutants were cultured in medium supplemented with 0.06 U ml−1 EPO. Mean cell counts at day 6 are shown normalized to the number of cells in the absence of CHAMP-1 expression (n = 3; bars, standard error). Asterisks denote a significant decrease in inhibitory potency relative to wild-type CHAMP-1 (increase in cell count, normalized to vector-only control) using a one-tailed Student’s t-test, P-values: S1Q, 0.488; S8Q, 0.001; S8D, <0.001; S8E, <0.001; S8N, 0.001; T19Q, 0.013; I-I-I-I, 0.035; V11F, 0.23; M12I, 0.454; L13A, <0.001; L14A, 0.178. d, Design model of mEpoR (green) and CHAMP-1 (cyan) TM complex with residues subjected to mutation labeled. Top, mEpoR (sticks) and red Cα atoms (spheres); bottom, CHAMP-1 with Cα atoms (spheres) colored as in a. WT, wild-type. **P < 0.05.
Fig. 5
Fig. 5. Solution NMR of the side chain-mediated CHAMP-1−mEpoR complex in DPC micelles.
a, mEpoR-TM2 sequence and [1H-15N]-HSQC spectra in [2H]-DPC at 200 µM U-15N,13C,1H with 40 mM sodium acetate pH 5.2, 20 mM NaCl, 0.5 mM EDTA and 5 mM dithiothreitol (DTT) (45 °C, 800 MHz). Monomeric (green; peaks, X’s) and CHAMP-1-bound states (blue; 1 mol %) were independently assigned,. b, [1H-13C]-HSQC spectra of mEpoR-TM2 monomer (green) and CHAMP-1-bound (red) states from a have widespread differences: chemical shift perturbations (cyan arrows); new or broadened peaks (cyan asterisks). Top inset (5⨯ contour), V17 Cɣ2-Hɣ2 peak shift. c, Target epitope residues. Left, shift perturbation of T24 Cβ (cyan arrow), new unassigned peaks (cyan asterisks), and broadening of T11 Cα/Cβ and T24 Cα resonances. Right, shift perturbation of S20 Cβ−Hβ resonance, alongside broadening of S13 Cα, S13 Cβ and S20 Cα. d, Two-dimensional F1-[13C]-edited/F3-[13C,15N]‐filtered HSQC‐NOESY spectrum. Transferred NOE crosspeaks indicate direct contact between mEpoR-TM2 13C atoms, for example, leucine Cα and CHAMP-1 14N/12C-attached protons, for example, backbone amide proton(s).
Fig. 6
Fig. 6. Mapping the CHAMP-1−mEpoR TM interface from chemical shift perturbations.
a, Helical periodicity in mEpoR-TM2 Cα shift perturbation upon CHAMP-1 binding and its agreement with expected CHAMP-1−mEpoR Cα−Cα distances from the design model, plotted as normalized interhelical closeness (NIC; Methods), a metric tracking the minimum interhelical Cα−Cα distance for each residue in the model of the complex. b, Left, CHAMP-1 (cyan) and mEpoR (green) design model noting protein-facing and lipid-facing side chains (sticks) and targeted small-X6-small repeats (red). Middle, perturbed Cα atoms (scaled spheres, green−red color scale) lie on one face of mEpoR’s TM α-helix, overlapping the targeted epitope and CHAMP-1 interface; minimally perturbed Cα atoms are lipid-facing in the design model. Right, perturbed side chain atoms enriched at one helix face, including V17, S20 and T24.
Extended Data Fig. 1
Extended Data Fig. 1. Protein design and ranking of output anti-mEpoR CHAMP sequences.
(a) Scatter plot of each sequence design trajectory, showing each resulting model’s Rosetta energy and RosettaHoles1 interface packing voids ‘Packstat’ score. Red dashed box represents designed proteins with Rosetta energy less than the mean and top 10% of Packstat. (b) Sequence logo CHAMP designs. Below denotes positions designed or fixed. Black hyphen, lipid-facing position fixed to an apolar residues (AFILV); red X, any lipid-friendly residue (GATSVLIFM); orange X, small-X6-small positions (GAS). Residues in hydrogen bonds with mEpoR are denoted as 1 and 2 with purple and red squares, respectively. (c) Left, model of CHAMP-1/mEpoR TM domain complex of antiparallel helices (green, mEpoR; cyan, CHAMP). Two key hydrogen inter-helical bond groups denoted in purple and red squares, numbered as in (b). Right, ESMfold ab initio predicted model of the complex (gray) overlaid, agreeing in helix register and sidechain interactions. (d) Rules-based selection of the ‘No Design’ control TM sequence based on TM domain helix-helix pairs filtered from a database of antiparallel left-handed close-packing having the small-X6-small consensus sequence. More details in Methods. The mEpoR sequence was threaded onto one helix aligned with the small-X6-small motif and assessed for sidechain steric clashes with the native adjacent TM domain sidechains. Only in 1 structural case was compatible with mEpoR’s sequence modeled. (e) The source structure, Photosystem II light harvesting complex (PDB:3bz1, chain B), comprised of TM 1 and 2. mEpoR could be threaded onto TM 2, which has only 22% sequence identity. Orange, small-X6-small positions. (f) Schematic of selecting the ‘No Design’ sequence based Photosystem II TM domain 1 interface residues. Orange spheres, small-X6-small positions. (g) Final sequence selection of the ‘No Design’ sequence (interface residues in red retained, purple ransomized lipid-facing positions randomized) and comparison to the Photosystem II source TM domain.
Extended Data Fig. 2
Extended Data Fig. 2. Effects of exogenous synthetic TM proteins on EpoR expressing BaF3 cells.
(a) BaF3/mEpoR cells transduced with empty vector or a TM proteins (CHAMP-1, CHAMP-1, No Design TM, or CHAMP-1 mutant ‘L-L-L-L’) grown in media not treated with IL-3 and EPO. The number of live cells at day 4 is shown for a single experiment (n = 1). EPO-treated cells transduced only empty vector are the positive control for EPOR-dependent proliferation. (b) Mean cell counts on day 4 of BaF3/mEpoR cell proliferating in medium supplemented with IL-3 (5% WEHI-conditioned medium as source) stably expressing empty vector (n = 2), CHAMP-1 (n = 2), CHAMP-1 (n = 2), or No Design TM (n = 1) with bars representing standard error. (c) Mean live cell count of BaF3/mEpoR cells expressing empty vector, a short mEpoR TM domain protein construct, or a previous published PDGFβR TM domain construct (Ref. ) after 8-day incubation in medium supplemented with 0.06 U/mL EPO (n = 3). Error bars as standard error. (d) Upper, western blots of BaF3/mEpoR cells stably expressing the mEpoR TM construct (C20 cytoplasmic epitope antibody) and PDGFβR TM construct. The PDGFβR TM construct was first immunoprecipitated to increase concentration then immunoblotted using PDGFβR-targeted rabbit anti-serum (C-terminal epitope) as in Ref. . Performed once (n = 1). (e) BaF3/hEPOR cells expressing empty vector, CHAMP-1, CHAMP-1, or No Design TM were incubated for four days in medium supplemented with 0.06 U/mL EPO. The number of live cells is shown for a single experiment (n = 1). (f) mhmEpoR construct having the cytoplasmic and extracellular domain sequences of mEpoR but the TM domain of hEpoR. (g) Mean live cell count of BaF3/mhmEpoR cells expressing empty vector, CHAMP-1, CHAMP-1, or No Design TM after 8-day incubation with 0.06 U/mL EPO (n = 3). Error bars show standard error. Source data
Extended Data Fig. 3
Extended Data Fig. 3. Schematic and SDS-PAGE of the three peptide thiol-disulfide exchange with biotin capture.
(a) Thio-disulfide exchange experiment Fig. 2a repeated with peptide reconstituted in dodecylphosphocholine (DPC) detergent micelles, showing similar results. Bars represent fraction of total integrated peak area of each species’ peak in the HPLC UV chromatogram, representative of 3 experiments; error bars bootstrapped from the 5% curve fitting error to HPLC UV peaks. (b) Workflow for equilibrium thiol-disulfide exchange modified for biotin capture and isolation of only mEpoR-containing disulfide bonded TM dimers, followed by reduction and quantification of the interacting TM helices by reverse phase high-performance liquid chromatography (RP-HPLC). SA, Streptavidin; GSSG, GSH, oxidized and reduced glutathione, respectively; Eq., equilibrium. (c) Sodium dodecyl sulfate polyacrylamide gel electrophoresis (SDS-PAGE) of equilibrated oxidized TM peptides in 20 mM myristyl sulfobetaine (C14B) micelles (lanes 1, 5), or purified peptides (lanes 2, 3, 4) reduced in 10 molar equivalents of tris(2-carboxyethyl)phosphine (TCEP), performed once (n = 1). Lane 1, mixture of 100 µM Biotinylated nCys-mEpoR with 4-fold molar excess of CHAMP – 2 equivalents of each nCys-CHAMP1 and cCys-CHAMP1 V2 oxidized overnight at a molar ratio of oxidized to reduced glutathione of 0.2. Lane 5, 100 µM Biotinylated nCys-mEpoR alone oxidized under the same conditions. Green arrows denote mEpoR monomer and dimer bands. Ox., oxidizing conditions; Mon., Monomer; kDa, kilodaltons; Rxn., Reaction. Source data
Extended Data Fig. 4
Extended Data Fig. 4. Control split GFP protein complement experiments.
(a) Left, flow cytometry histogram showing fluorescence of parental BaF3 cells and BaF3 cells expressing mEpoR-GFP1-10 and GFP11-CHAMP-1 together or separately. Right, flow cytometry histogram showing fluorescence of BaF3/mEpoR-GFP1-10 cells co-expressing empty vector, GFP11-CHAMP-1, a GlycophorinA (GpA) TM domain construct fused at its c-terminus to GFP11, or ErbB2 TM domain construct fused to GFP11 at its c-terminus (Supplementary Table 1). (b) Extracts were prepared from mEpoR-GFP1-10 cells expressing empty vector or FLAG-tagged CHAMP-1 with a fused N-terminal GFP11 (GFP11-CHAMP-1) or a fused C-terminal GFP11 (CHAMP-1-GFP11). Extracts were subjected to SDS-PAGE directly (input) or after immunoprecipitation with anti-FLAG antibody, which recognizes both FLAG-tagged CHAMP-1 proteins. Performed once (n = 1). Blots were probed with antibodies that recognize FLAG to detect the CHAMP-1 proteins or HA to detect HA-tagged mEpoR-GFP1-10. (c) Extracts from cells expressing either the mEpoR or the hEpoR C-terminally fused to GFP1-10 were subjected to SDS-PAGE and immunoblotted with antibodies that recognize HA fused to EpoR or actin as a loading control. Performed once (n = 1). The numbers below the lanes are the relative expression of the EpoR normalized to actin. (d) BaF3 (tTa) cells expressing ErbB2 C-terminally fused to GFP1-10 transduced with empty pTight vector or pTight containing the TM domain of ErbB2 fused to GFP11 (ErbB2TM-GFP11). Flow cytometry was performed on cells incubated in 1 nM doxycycline to repress ErbB2TM-GFP11 (left panel) or in 1 pM doxycycline expressing ErbB2TM-GFP11 (right panel). Source data
Extended Data Fig. 5
Extended Data Fig. 5. Fluorescence quenching of labeled-mEpoR by CHAMP-1 in C14B micelles at different peptide:detergent ratios and theoretical FRET from non-specific peptide crowding effects.
(a) Theoretical FRET curves expected for monomeric (Mon.), dimeric, and trimeric complexes are plotted as solid lines. Dotted lines represent FRET curves of each potential oligomerization state also including the micelle crowding factor, which accounts for the contribution to quenching from non-specific co-habitation of donor and acceptor TM peptides in the same micelle, which we modeled as a Poission distribution dependent on the peptide to detergent molar ratio and the detergent’s aggregation number (molecules per micelle). The expected FRET curves with the micelle crowding factor at 1:100 peptide to detergent ratio mole ratio is displayed, given the estimated aggegration number for C14B of 90. (b) Theoretical FRET curves with the micelle crowding factor 1:175 peptide: C14B molar ratio, plotted as in panel a. (c) Dots represent mean relative (Rel.) 460 nm fluorescence emission of 1.5 µM 7-diethylamino-4-methylcoumerin-labeled (DACM-labelled) mEpoR TM peptide (n = 3, independent samples; standard error bars) decaying linearly due to FRET quenching as fluorescein-labeled CHAMP-1 is titrated. Samples were reconstituted in C14-betaine with a detergent to total peptide ratio of 100:1 (1.1 micelles per total peptide) in 50 mM Tris-HCl pH 8, 100 mM NaCl, 0.5 mM EDTA, 5 mM TCEP buffer at fixed equimolar total peptide concentration across the donor titration. (d) Mean fluorescence emission of analogous experiment and plot details as in panel c, but reconstituted at a detergent to total peptide ratio of 250:1 (2.8 micelles per total peptide).
Extended Data Fig. 6
Extended Data Fig. 6. CHAMP-1 mutagenesis and ab initio prediction of CHAMP-1 mutant complexes.
(a) Extracts from BaF3/mEpoR expressing empty vector or FLAG-tagged CHAMP-1 or mutant SQ8 were immunoprecipitated with anti-FLAG, subjected to SDS-PAGE, and probed with anti-HA to detect HA-tagged mEpoR. Bottom panel shows samples without prior immunoprecipitation. (b) Western blots of extracts of BaF3/mEpoR cells stably expressing wildtype or mutant CHAMP-1. Blots were probed with antibodies recognizing CHAMP (anti-FLAG), mEpoR (anti-HA), and actin as a loading control. Performed once (n = 1). (c) ESMfold predictions of CHAMP-1 and mutants with the mEpoR TM domain. Left, mEpoR (green) with CHAMP-1 wildtype (WT, cyan). Right, predictions for the EpoR/CHAMP-1 complex baring point mutations on CHAMP-1: V11F (orange), M12I (pink), L13A (magenta), L14A (yellow), overlain with the wildtype complex. (d) Top view of point mutant predictions of CHAMP-1 in complex with mEpoR, overlain and colored as in panel c. (e) ESMfold prediction of mEpoR (green) with CHAMP-1 ‘I-I-I-I’ mutant (gray, Ile in sticks) results in two distant non-interacting helices. Source data
Extended Data Fig. 7
Extended Data Fig. 7. 15N mEpoR-TM2 monomer-homodimer behavior in C14-Betaine micelles and binding to CHAMP-1.
(a) The 1H-15N HSQC spectra of 0.3 mM 15N mEpoR-TM2 at 45 °C, pH 5.2, and 800 MHz when diluted in myristyl-sulfobetaine (C14B) micelles at 180 and 520 molar equivalents of detergent (54 mM, red; 156 mM, green). The more concentrated sample (180x, red) shows a strong second set of peaks emerging in exchange that is slow on the NMR time scale, likely representing the mEpoR-TM2 in the homodimeric state. Right inset, example pair of related, interconverting peaks dependent on the detergent concentration. (b) Titration of 1, 2, 3, 4, and 6 molar equivalents (eqv.) of CHAMP (navy, dark green, red, purple, black, respectively) to 0.3 mM 15N mEpoR-TM2 where additional C14-B is added alongside each eqv. CHAMP to maintain a constant molar ratio of C14-B to total peptide of 180:1. Reference spectra (no CHAMP, green) in (b) is predominantly the monomeric species at 520:1 ratio C14-B:mEpoR-TM2. Insets track shifting resonances at lower contour.
Extended Data Fig. 8
Extended Data Fig. 8. mEpoR-TM2 monomer-homodimer equilibrium and binding to CHAMP-1 in DHPC/DMPC q = 0.3 bicelles.
(a) 1H-15N HQSC spectral changes of 0.5 mM 15N-mEpoR-TM2 at 45 °C, pH 5.2, and 800 MHz upon titration of DMPC/DMPC q = 0.3 bicelles at 38%, 13%, and 3% (w/v) at constant mEpoR-TM2 (navy, green, red, respectively). (b) 1H-15N HQSC spectral changes titration of of 0.5 mM 15N-mEpoR-TM2 at 45 °C, pH 5.2, and 800 MHz upon titration of 1, 2, 3, and 4 molar equivalent (eqv.) unlabeled CHAMP (cyan, orange, maroon, red, respectively) at a constant bicelle concentration of 10%. Spectra are overlaid on the CHAMP-free reference spectra in 10% bicelles. Both the mEpoR homo-oligomer (likely homodimer, panel a) and mEpoR-CHAMP heterodimer complex (panel b) exhibit chemical shift perturbation relative to monomer resonances with ‘fast’ chemical exchange. Numbered resonances denote key induced chemical shift changes that differ significantly between the two different types of titrations, differentiating that mEpoR-TM2 experiences distinct chemical environment in the mEpoR homodimer state versus in complex with CHAMP. Peaks 1, 2, 3, 6 and 7 do not shift as mEpoR converts from monomer to homodimer, but shift significantly upon CHAMP binding. Peak 4 shifts upon homodimerization but not upon CHAMP binding. Peak 5 shifts in different directions in panel a versus panel b. Lowercase letters denote resonances experiencing peak shift similar between panel a and panel b.
Extended Data Fig. 9
Extended Data Fig. 9. mEpoR Monomer-Homodimer equilibrium in DPC.
(a) Assigned 1H-15N HSQC spectrum of 0.1 mM 15N mEpoR at high DPC molar ratio (600x, green) with the spectrum at low DPC concentration (50x, red) overlaid; the latter [DPC] concentration corresponds to approximately 1 TM peptide per 1 micelle. Recorded at 45 °C, 800 MHz, pH 5.2, with the predominantly monomer spectra (green) contoured 10-fold higher than the largely homodimer spectra (red). (b) SDS-PAGE of mEpoR showing non-covalent monomer-dimer equilibrium, representative gel of n = 3 replicate lanes. Mon, monomer. (c) Examples of newly emerging peaks (starred, bolded residues in panel a) of the mEpoR TM homodimer species upon reduction of DPC detergent concentration, titrated at 600, 200, 100, 75, and 50 molar ratios of detergent to TM peptide, showing the mEpoR TM peptide monomer-homodimer equilibria in the absence of CHAMP. Further concentrating mEpoR-TM2 to only 25x DPC molar ratio results in a sparse spectrum suggestive on peptide aggregation, where only 2 peaks (R32 and R33) are observed. M, monomer (green arrow); D, dimer, (red arrow). Source data
Extended Data Fig. 10
Extended Data Fig. 10. Comparison of 1H-13C HSQC spectra of mEpoR-TM2 from monomeric (green), CHAMP-1-bound (red), and partially homodimeric (purple) samples.
(a-i) Different spectral regions perturbed. More monomeric resonances assigned from backbone-backbone and backbone sidechain experiments. Noted heterodimer assignments were derived independently by backbone-backbone, backbone-sidechain, and 15N-edited NOESY. Cyan inset, location of the isolated 13C resonance having a transfer NOE to a 14N-attached amide 1H peaks in the 13C-edited/13C,15N-filtered HSQC-NOESY (Fig. 5).

References

    1. Westerfield JM, Barrera FN. Membrane receptor activation mechanisms and transmembrane peptide tools to elucidate them. J. Biol. Chem. 2020;295:1792–1814. doi: 10.1074/jbc.REV119.009457. - DOI - PMC - PubMed
    1. Stone TA, Deber CM. Therapeutic design of peptide modulators of protein−protein interactions in membranes. Biochim. Biophys. Acta. 2017;1859:577–585. doi: 10.1016/j.bbamem.2016.08.013. - DOI - PubMed
    1. Yin H, et al. Activation of platelet αIIbβ3 by an exogenous peptide corresponding to the transmembrane domain of αIIb. J. Biol. Chem. 2006;281:36732–36741. doi: 10.1074/jbc.M605877200. - DOI - PubMed
    1. Ovchinnikov V, Stone TA, Deber CM, Karplus M. Structure of the EmrE multidrug transporter and its use for inhibitor peptide design. Proc. Natl Acad. Sci. USA. 2018;115:E7932–E7941. doi: 10.1073/pnas.1802177115. - DOI - PMC - PubMed
    1. Alves DS, et al. A novel pH-dependent membrane peptide that binds to EphA2 and inhibits cell migration. elife. 2018;7:36645. doi: 10.7554/eLife.36645. - DOI - PMC - PubMed

Publication types