. 2024 Nov;20(11):1443-1452.
doi: 10.1038/s41589-024-01584-7. Epub 2024 Mar 13.

Functional genomic screens with death rate analyses reveal mechanisms of drug action

Affiliations

Functional genomic screens with death rate analyses reveal mechanisms of drug action

Megan E Honeywell et al. Nat Chem Biol. 2024 Nov.

Abstract

A common approach for understanding how drugs induce their therapeutic effects is to identify the genetic determinants of drug sensitivity. Because 'chemo-genetic profiles' are performed in a pooled format, inference of gene function is subject to several confounding influences related to variation in growth rates between clones. In this study, we developed Method for Evaluating Death Using a Simulation-assisted Approach (MEDUSA), which uses time-resolved measurements, along with model-driven constraints, to reveal the combination of growth and death rates that generated the observed drug response. MEDUSA is uniquely effective at identifying death regulatory genes. We apply MEDUSA to characterize DNA damage-induced lethality in the presence and absence of p53. Loss of p53 switches the mechanism of DNA damage-induced death from apoptosis to a non-apoptotic death that requires high respiration. These findings demonstrate the utility of MEDUSA both for determining the genetic dependencies of lethality and for revealing opportunities to potentiate chemo-efficacy in a cancer-specific manner.


Figures

Extended Data Fig. 1:
Extended Data Fig. 1:. Characterizing the DNA damage-induced coordination between growth and death using GRADE analysis. Related to Fig. 1.
(a) Schematic of the FLICK assay and equations for calculating relative viability (RV), fractional viability (FV), and normalized growth rate inhibition values (GR). (b) Sensitivity of WT and p53-null cell lines to DNA-damaging chemotherapeutics, measured using FLICK and analyzed using GRADE. Drug doses are colored in pseudocolor with higher doses in deeper blue shades. Measurements were made 72 hours after drug exposure. The grey area reflects the full set of possible GR/LF relationships given a comprehensive simulation of drug-induced changes to the growth rate and death rate. Cell doubling times (DT, time in hours for 1 population doubling) highlighted, as DT affects the zone of possible GR/LF relationships. Data are mean ±SD from n=3 independent experiments.
Extended Data Fig. 2:
Extended Data Fig. 2:. Variation in drug-induced coordination between growth and death obscures the level of cell death in relative viability-based evaluation of drug sensitivity. Related to Fig. 1.
(a) Growth and death rates for HDAC inhibition (Vorinostat), BH3 mimetic (ABT-737), or a ferroptotic drug (RSL3), compared to 6 DNA-damaging chemotherapeutics. Data were generated using FLICK with GRADE analysis, with responses evaluated over the first 72 hours following drugging. Doses used were 1-10 μM for each compound which caused > 80% LF at assay endpoint. Data are the mean from n=9-11 independent experiments, with each dot representing an individual replicate. (b-c) DNA damage signaling measured using phosphorylation of H2AX at serine 139 (pH2AX) in response to etoposide. (b) Response kinetics for 31.6 μM Etoposide over time. (c) pH2AX in U2OS (WT) and U2OSp53KO (KO) measured across doses of Etoposide, 2 hours after drug exposure. For (b-c), quantified values below the blots are the mean ±SD from 2 independent experiments. (d) Gating strategy used for cell cycle analysis in (e). (e) Cell cycle position evaluated using propidium iodide (PI) and phospho-histone H3 (pH-H3). (left) Examples of U2OS cells exposed to DMSO or 10 μM Nutlin for 24 hours. (right) Quantification of cell cycle phase. Data are mean ±SD from n=3 independent experiments. (f) Live cell counts over time for U2OS and U2OSp53KO cells treated with a sub-lethal dose of etoposide. Data collected using a hemacytometer. Data are mean ±SD from n=3 independent experiments. (g-i) Simulation of population dynamics following exposure to DNA damage. (g) Relative cell number over time for different growth and death models. Growth and death rates are parameterized from observed rates in p53WT and KO cells. (h) Relative viability dose-response function calculated from simulated data in (g). (i) Sensitivity of the RV metric to cell death. The expected change in RV at different points in time, for simulations of drugs with different death rates. Red curve is the average death rate observed for DNA-damaging agents.
Extended Data Fig. 3:
Extended Data Fig. 3:. p53 deletion switches the mechanism of DNA damage-induced cell death from apoptotic to nonapoptotic. Related to Fig. 1.
(a) Death onset times (DO) for data in Extended Data 1b. For each drug, data are shown for all doses that induce death across all 10 WT or p53-null cells. See also Supplementary Table 1. (b) Flow cytometry gating strategy for monitoring activation of apoptosis (cleaved-CASP3, cleaved-PARP double-positive cells). Untreated U2OS cells (top row) and U2OS cells treated with an apoptotic drug (31.6 μM Etoposide, bottom row) are shown for comparison. (c-e) Evaluation of inflammatory cell death in U2OS and U2OSp53KO cells. (c) Schematic for conditioned media experiment. Cells were exposed to 31.6 μM etoposide for 48 hours. Conditioned media (CM) was removed and filtered, then applied to untreated U2OS cells for 8 hours before cells were processed for RNA-sequencing. (d) RNA-seq for CM-induced gene expression changes. Volcano plot showing the −log10FDR p-values and log2-fold change (L2FC) for U2OS cells treated with conditioned media from either U2OS or U2OSp53KO cells (log2(U2OSp53KO/U2OS)). (e) Pathway-level enrichment using GSEA, highlighting enrichment for inflammatory signatures in cells treated with media conditioned by U2OSp53KO cells. NES = normalized enrichment score. FDR-adjusted p-value cut-off shown with dashed red line.
Extended Data Fig. 4:
Extended Data Fig. 4:. p53 deletion does not alter the capacity to activate apoptosis. Related to Fig. 1.
(a-b) Apoptotic priming evaluated using BH3 profiling. Numbers of the y-axis in (a) and (b) report the μM concentrations of the listed peptides. (a) Basal BH3 profiles in U2OS and U2OSp53KO cells. Data are the mean ±SD for n=4 independent experiments. (b) Change in apoptotic priming level following exposure to the listed dose of Etoposide (Etop) for the listed time. (c) Sensitivity to BH3 mimetic, ABT-199 using FLICK assay. (left) dose-response profile 48 hours after drug exposure. (right) Death kinetics for the same doses of ABT-199 as shown on left, starting with 100 μM. Data are mean ±SD of n=3 independent experiments.
Extended Data Fig. 5:
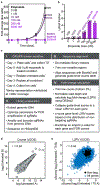
Extended Data Fig. 5:. Chemo-genetic screening analysis strategy and replicate correlation. Related to Fig. 2.
(a-b) U2OS cells treated with Etoposide for 12 days. (a) Live cells were counted to determine the growth defect of each dose. ED = “Effective Dose” (e.g., ED30 = effective dose for 30% reduction in population size after 12 days, compared to untreated). Data collected using hemacytometer-based cell counting. (b) Lethal fraction evaluated using using hemacytometer-based cell counting and trypan blue-exclusion following 12-day drug exposure. Data in (a-b) demonstrate that conventional “ED20” effect sizes are non-lethal for DNA damage. Lethality is not observed until > ED99. For (a) and (b) data are mean of n=2 independent experiments with individual replicates shown. (c) Analysis pipeline for calculating L2RV from chemo-genetic screens. (d) Example of correlation between counts for two replicates of the same screen condition. Pearson Correlation Coefficient (r) shown. (e) Example of correlation between gene-level L2RV values for two screen replicates. z-scored L2RV was calculated for each replicate. Non-targeting (Non-targ.) sgRNAs shown in black. All other genes shown in blue.
Extended Data Fig. 6:
Extended Data Fig. 6:. Validation of MEDUSA. Related to Fig. 3 and 4.
(a) Probability density function (PDF) for nontargeting sgRNAs or DNA repair genes in Untreated vs. T0 comparison. Knockout of DNA repair genes causes reduced growth rate. (b) Schematic of method used to validate hits from the whole-genome CRISPR screen. For (c), (e), and (f) validation conditions replicate the chemo-genetic profiling conditions. (c) Validation data generated using FLICK, grey = non-targeting sgRNA, blue = targeted gene. Data are mean ±SD for n=4 independent experiments. (d-f) Validation of gene knockouts that cause reduced growth rates. (d) Phase diagram from MEDUSA highlighting 16 genes in the validation set whose knockout causes reduced growth rate. Purple are genes predicted by MEDUSA to increase death rate when knocked out; Green are genes predicted by MEDUSA to decrease death rate when knocked out. (e) Scatter plot comparing MEDUSA-inferred rates on x-axis versus FLICK validation on y-axis. p-values and odds ratios (OR) calculated using a one-tailed Fisher’s exact test. (f) as in (e) but for L2RV analysis on x-axis compared versus FLICK validation on y-axis. (g) MEDUSA-inferred growth and death rates in U2OS and U2OSp53KO. Non-targeting genes in black; apoptotic regulatory genes in blue; all other genes in grey.
Extended Data Fig. 7:
Extended Data Fig. 7:. Validation of respiration-dependent death in p53 KO cells. Related to Fig. 5.
(a-b) Validation of MEDUSA-based inferences for genes encoding subunits of ETC Complex I (NDUFB8 and NDUFC1) and Complex V (ATP5F1 and ATP5I), compared to non-targeting sgRNA (Non-targ.). Validation was performed using the FLICK assay, with conditions replicating the chemo-genetic profiling experiment (5 μM Etoposide, 4 days). (a) Death kinetics. (b) Lethal fraction (LF) at end point. In (b), lines represent the mean, with individual replicates shown (n=3 for targeted sgRNAs, n=6 for non-targeting). Statistical evaluation performed using pairwise t-tests (two-sided) with FDR correction for multiple hypotheses. FDR adjusted p-values for WT: NDUFB8: 0.1349; NDUFC1: 0.0864; ATPF51: 0.1349: ATPFI: 0.1236. FDR for KO: NDUFB8: 0.0004; NDUFC1: <0.0001; ATP5F1: <0.0001; ATP5I: 0.0003. (c) Basal respiration rates for WT and KO cells measured using the Seahorse Mitochondrial Stress Test. p values: basal: <0.0001; ATP-linked: <0.0001; Proton Leak: <0.0001; Max rate: <0.0001; Spare capacity: 0.0002, Non-mito: <0.0001. (d-e) Mitochondrial abundance in U2OS and U2OSp53KO. (d) qPCR of mitochondrial DNA. Delta CT (cycle time) used to quantify relative abundance. (e) MitoTracker Green fluorescence level. Data are mean ±SD from n=3 independent experiments. No sequential gating used in the analysis. (f) MEDUSA-based chemo-genetic profiles for etoposide in U2OS and U2OSp53KO cells, highlighting MDM2. (g) FLICK-based validation of MDM2 knockout. Conditions replicate chemo-genetic profiling experiment. (h) Relative abundance of ETC Complexes I-V. (left) Representative immunoblot. (right) Quantification from n=3 independent experiments. (i) Blue native PAGE of ETC complexes. Representative blot shown from n=3 independent experiments that produced similar results. ETC protein complexes highlighted. (j) Death kinetics following 31.6μM etoposide ±Rotenone (Rot.). Data for U2OS and 3 independent clones of p53KO. Clone 2 was used as “U2OSp53KO” throughout the study. For (c), data are mean ±SD from n=6 independent experiments. For all other panels with error bars, data are mean ±SD from n=3 independent experiments. For panels (b-e) statistical evaluation was performed using pairwise t-tests (two-sided). p-values (c-e) are not corrected for multiple hypothesis testing. ns = not significant; *** p < 0.05.
Extended Data Fig. 8:
Extended Data Fig. 8:. Steady state metabolite levels. Related to Fig. 6.
(a) Metabolite levels quantified using LC-MS, shown for vehicle-treated U2OS and U2OSp53KO cells at T0. (b) Metabolite levels shown for intermediate metabolites involved in glycolysis, PPP, or TCA cycle for U2OS and U2OSp53KO. Data are shown for vehicle and etoposide treated samples at 48 hours. Data are mean ±SD from n=3 independent experiments. Statistical evaluation was performed using pairwise t-tests (two-sided) with FDR correction for multiple hypotheses. Exact FDR values shown in red if FDR<0.05 and grey if FDR>0.05. See also Supplementary Table 7.
Extended Data Fig. 9:
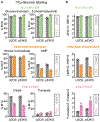
Extended Data Fig. 9:. Proportional enrichment of glucose-derived metabolites is not altered by the loss of p53. Related to Fig. 6.
(a) Isotope tracing using 13C6-Glucose. Cells were labeled for 8 hours. Fractional enrichment for intermediate metabolites in glycolysis, PPP, and TCA cycle shown for U2OS and U2OSp53KO cells treated with etoposide for 48 hours. See also Supplementary Table 8. (b) Data collected as in (a) but analyzed to compare the fractional enrichment of glucose-derived metabolites for upstream and downstream components of glycolysis, PPP, or the TCA cycle. Abbreviations: glucose 6-phosphate (G6P), 2-phosphoglycerate (2PG), ribose 5-phosphate (R5P), uridine monophosphate (UMP). Data are mean ±SD of n=3 independent experiments.
Extended Data Fig. 10:
Extended Data Fig. 10:. Hyperactive respiration in p53-deficient cells promotes the lethality of DNA damage through production of NAD+. Related to Fig. 6.
(a) FLICK-based analysis of FK866 sensitivity in cells exposed to DNA damage. Data are the log2-scaled change in DNA damage-induced LF-max in 1 μM FK866 treated vs. DMSO treated samples. Data collected 48 hours after exposure to 0.1μM Idarubicin or 3.16 μM Teniposide. (b) NAD+ levels evaluated using LC-MS after 4-hour exposure to DMSO, 1 μM FK866, or 1 μM Rotenone. (c) As in (b) but for NADH. (d) Seahorse Mitochondrial Stress Test in the presence and absence of 1 μM FK866. For (a-c), data are mean ±SD of n=3 independent experiments. For (d), data are mean ±SD of n=6 independent experiments.
Fig. 1:
Fig. 1:. Varied coordination of growth and death masks high levels of non-apoptotic death activated by DNA damage in the absence of p53.
(a) Simplified schematic of the DNA damage response. (b) Etoposide (Etop) sensitivity in 10 p53-WT and 10 p53-null cell lines, evaluated using Relative Viability. Inset shows cumulative distribution function (CDF) for EC50 in p53-WT and null cells. (c) Schematic of GRADE analysis. (d) GRADE analysis for U2OS (p53-WT) and A431 (p53-null) treated with 9 DNA damaging drugs. Proliferation and death rates at GR50 effect size shown for the full panel of cells in (b). p-value calculated using KS test (p < 0.0001 for proliferation and death rate). (e) EC50 of Fractional Viability dose response (FV50) for 10 p53-WT cells treated with etoposide in the presence and absence of p53-targeted siRNA. For (b-e) data were collected using FLICK, 72 hours after drugging. (f) Generation of U2OSp53KO. 2-hour exposure to 10 μM Camptothecin (Camp) used to stabilize p53. Domain structure of TP53 gene shown, with sgRNA targeting the transactivation domain (TAD). PRD: proline rich domain; DBD: DNA binding domain; OD: oligomerization domain; RD: regulatory domain. (g) Etoposide sensitivity of U2OS and U2OSp53KO. Fractional Viability (FV) measured using FLICK 48 hours after drugging. (h) Death kinetics measured using STACK in U2OS and U2OSp53KO treated with 31.6 μM etoposide. Death onset time (DO) and Death Rate (DR) shown on right (DO: p=0.0022; DR: p=0.0049 . (i) As in (h), but ±30 μM zVAD. U2OS ±zVAD: p=0.0020; U2OS vs. p53KO: p=0.0022; p53KO ±zVAD: p=0.1925. (j) Apoptotic death evaluated using flow cytometry. Example for U2OS ±31.6 μM Etop for 24 hours (left), quantified over time (right). (k) Death morphology in U2OS and U2OSp53KO evaluated in STACK assay. Example images are taken following exposure to 31.6 μM Etoposide, at the DO for Etoposide in each genotype. Scale bar represents 20 μm. For panels (f) and (k), data shown are representative of three experiments repeated independently with similar results. For all panels with error bars, data are the mean ±SD from n=3 independent experiments. *** < 0.05 p-value using two-sided t-test.
Fig. 2:
Fig. 2:. Chemo-genetic profiles fail to identify death regulatory genes due to confounding effects of varied growth rates.
(a) Schematic of chemo-genetic profiling using a pooled sgRNA library. (b-c) Parameterization of drug dose and assay time for pooled screen. Selected dose and time are highlighted with grey vertical lines. (b) Screen dose selected to produce intermediate levels of lethality in both cell types. Data generated using the FLICK assay 96 hours after drug exposure. (c) Assay length at screening dose selected to maintain a population size >300x coverage of the sgRNA library throughout the assay. Data collected using hemacytometer-based cell counting following exposure to 5 μM Etoposide. (d-g) Chemo-genetic profile, analyzed using conventional methods. (d) Evaluation of screen performance. Distribution of gene-level log-2-relative viability (L2RV) scores for core essential genes (Essential) vs. all genes in untreated vs. T0 comparison. Two-sided KS test p-value shown. (e) Gene set enrichment analysis (GSEA) for etoposide vs. untreated sample comparison in U2OS. Most enriched gene signatures shown. Apoptosis is not significant, shown for comparison. NES = normalized enrichment score. Empiric FDR adjusted p-value cut-off shown based on bootstrapping. (f) GSEA as in (e) for 74 published genome-wide chemo-genetic profiles of apoptotic agents. Apoptotic genes are consistently missed, while screens typically enrich for known proliferation genes. (g) Gene-level L2RV for U2OS (p53 WT) compared to U2OSp53KO (p53 KO). DNA repair genes (Repair) and core essential genes (Essential) shown to demonstrate enrichment for genes that reduce growth fitness in chemo-genetic profiling data. Negative L2RV is generally interpreted as sensitization (Sens.), while a positive L2RV is interpreted as resistance (Resist.). For all panels with error bars, data are mean ±SD from n=3 independent experiments.
Fig. 3:
Fig. 3:. MEDUSA, a method for inferring the death regulatory function of each gene in chemo-genetic profiling.
(a) Simulation used to model the relationship between the drug-induced growth rate (GR), death rate (DR), and relative viability (L2RV). In the example, cells containing a single gene knockout (KO) die twice as fast, and have a modest 20% growth defect, which creates a large difference in population size in the fast-growing untreated population (Δ1). L2RV would be positive (i.e., enrichment) despite a higher death rate in the knockout cells. WTunt and KOunt are the WT and KO population sizes, respectively, in untreated conditions; WTtx and KOtx are the WT and KO population sizes in the drug-treated conditions. (b) GRADE for U2OS and U2OSp53KO cells treated with 5 μM etoposide. Data collected using FLICK. (c) Results of a simulation of all possible combinations of growth and death rates. Phase diagram shows, in color, how changes to growth/death combine to create population sizes that are commonly interpreted as drug sensitization (Sens.) or drug resistance. (d) MEDUSA-based inference of drug-induced growth and death rates for each gene knockout. Inference of death rate occurs in three steps: (i) identify growth/death combinations that could have generated the observed relative abundance; (ii) select a drug-induced growth rate, assuming growth rate prior to death onset (GRtx) is proportional to the experimentally measured knockout growth rate in the absence of treatment (GRunt); (iii) calculate the death rate, using observed L2RV and relative KO growth rate. For (d(ii)) and (d(iii)) the values shown highlight the experimentally calculated growth rate or inferred death rate for the example shown. (e) Gene-level chemo-genetic profiling data for etoposide in U2OS cells, projected into phase diagram. DNA repair genes and non-targeting sgRNAs highlighted. (f) Error in inference of death regulatory function if inference was based on conventional L2RV-based measurements. (g) Validation of MEDUSA-inferred growth/death rates, focusing on TDP2, a gene encoding a DNA repair protein. Growth rate in absence of drug (left) and etoposide-induced death rate (right) quantified using FLICK, replicating screening conditions (5 μM Etoposide, 4 days). Data are mean ±SD from n=4 independent experiments.
Fig. 4:
Fig. 4:. MEDUSA accurately identifies death-regulatory genes.
(a-d) Expanded validation of 40 genes that score strongly by MEDUSA or conventional L2RV analysis. (a) Genes selected for validation highlighted. Genes are colored according to whether they scored by L2RV, MEDUSA (log2 death rate, L2DR) or both. For validation, chemo-genetic profile parameters were replicated (5 μM Etoposide, 4 days) and death rates were quantified using FLICK. (b) Validation results for 40 genes compared to MEDUSA-inferred death rates (L2DR). (c) As in (b), but validation results are compared to conventional L2RV. (d) Fisher’s exact test for the subset of gene knockouts within the validation set with reduced growth rates. For (b-d) odds ratio (OR) and p-values shown based on one-tailed Fisher’s exact test (i.e., hypergeometric distribution). For (b-c), data are mean from n=4 independent experiments. See also Extended Data Fig. 6.
Fig. 5:
Fig. 5:. MEDUSA identifies a respiration-dependent form of non-apoptotic death activated by DNA damage in p53-null cells.
(a) GSEA of Hallmark Apoptosis for U2OS and U2OSp53KO chemo-genetic screens analyzed with L2RV or MEDUSA-based analysis. Apoptotic genes are enriched only in U2OS, analyzed using MEDUSA. *** FDR < 0.05; ns = not significant. Exact FDR adjusted p-values are: WT L2DR: 0.048; p53KO L2DR: 0.758; WT: L2RV: 1; p53KO L2RV: 0.55. (b) GSEA for MEDUSA-inferred L2DR of etoposide-treated cells, showing signatures most enriched in U2OSp53KO. Negative normalized enrichment scores (NES) indicate a decrease in death rate, positive NES indicates an increase in death rate. FDR-based significance cut-offs shown in red dashed lines. (c) MEDUSA analysis on chemo-genetic profiles for etoposide in U2OS and U2OSp53KO cells. OXPHOS genes highlighted, including four ETC genes that regulate death in U2OSp53KO cells, but not in U2OS. (d) FLICK-based validation of ATP5F1 knockout, a gene encoding a subunit of ETC Complex V. See also Extended Data Fig. 7. Validation replicates the conditions used in chemo-genetic profiling (5 μM Etoposide, 4 days). (e) Oxygen consumption rate (OCR) in U2OS and U2OSp53KO treated with etoposide for indicated times. Colored areas in the figure are based on the p53KO traces, highlighting the respiratory features evaluated using the Seahorse mitochondrial stress test. Drugs used in stress test were oligomycin (Oligo), FCCP, rotenone (Rot), and antimycin A (Ant A). (f-g) Lethal Fraction (LF) kinetics measured using FLICK in U2OS and U2OSp53KO cells exposed to 31.6 μM etoposide in the presence and absence of ETC inhibitors. (f) 1 μM Rotenone (Rot.) to inhibit ETC Complex I. (g) 0.03 μM Oligomycin (Oligo.) to inhibit ETC Complex V. For validation data in (b-c), data are mean ±SD from n=4 independent experiments. For (e), data are mean ±SD from n=3-6 independent experiments. For all other panels with error bars, data are mean ±SD from 3 independent experiments.
Fig. 6:
Fig. 6:. High NAD+ levels potentiate DNA damage sensitivity in p53-null cells.
(a) LC-MS-based profiling of metabolites. Volcano plot shows changes in metabolite levels in p53KO following exposure to either 5 or 31.6 μM etoposide for indicated times. (b-c) Pathway enrichment among significantly altered metabolites. (b) Highlighted with red text are pathways changed in p53KO but not p53WT using metabolic pathways defined by MetaboAnalyst. FDR-based cut-off for enrichment based on hypergeometic distribution shown as dashed red line. (c) Detailed view of metabolites changed within glycolysis, Pentose Phosphate Pathway (PPP), and TCA cycle (TCA). Metabolites that differ following 24- or 48-hour etoposide exposure are highlighted red/blue. (d) NAD+ levels measured using LC-MS at steady-state in untreated samples or following exposure to 31.6 μM Etoposide for 48-hours. *** < 0.05 p-value using two-sided t-test. Exact p-values are: U2OS ±Etop: 0.5421; U2OS vs. p53KO: 0.0445; p53KO ±Etop: 0.0009; U2OS+Etop vs. p53KO+Etop: 0.0001. (e-h) Perturbation of NAD+ levels. (e) Schematic of the NAD+ Salvage Pathway. (f) LF kinetics measured using FLICK following exposure to 31.6 μM etoposide ±1 μM FK866. (g) FK866 sensitivity in Etoposide-treated cells across a panel of cell lines with functional (grey) or dysfunctional (red) p53. LF was measured as in (f). Data shown are the log2-scaled change in etoposide-induced LF-max, comparing FK866 to the no inhibitor condition. p53KO #1-3 were derived from U2OS. NOTE: the p53KO clone used throughout the study was p53KO #2. Abbreviations: glucose 6-phosphate (G6P), fructose 6-phosphate (F6P), fructose 1,6-bisphosphate (FBP), dihydroxyacetone phosphate (DHAP), 3-phosphoglycerate (3PG), 2-phosphoglycerate (2PG), phosphoenolpyruvate (PEP), ribose 5-phosphate (R5P), a-ketoglutarate (a-KG), nicotinamide (NAM), nicotinamide riboside (NR), uridine monophosphate (UMP). For all panels with error bars, data are mean ±SD from n=3 independent experiments.

References

    1. Galluzzi L et al. Molecular mechanisms of cell death: recommendations of the Nomenclature Committee on Cell Death 2018. Cell Death Differ 25, 1–56 (2018). - PMC - PubMed
    1. Tsvetkov P et al. Copper induces cell death by targeting lipoylated TCA cycle proteins. Science 375, 1254–1261 (2022). - PMC - PubMed
    1. Maltese WA & Overmeyer JH Methuosis Nonapoptotic Cell Death Associated with Vacuolization of Macropinosome and Endosome Compartments. Am J Pathology 184, 1630–1642 (2014). - PMC - PubMed
    1. Holze C et al. Oxeiptosis, a ROS-induced caspase-independent apoptosis-like cell-death pathway. Nat Immunol 19, 130–140 (2018). - PMC - PubMed
    1. Chonghaile TN et al. Pretreatment Mitochondrial Priming Correlates with Clinical Response to Cytotoxic Chemotherapy. Science 334, 1129–1133 (2011). - PMC - PubMed

METHODS REFERENCES

    1. Tabe Y et al. MDM2 Antagonist Nutlin-3 Displays Antiproliferative and Proapoptotic Activity in Mantle Cell Lymphoma. Clin Cancer Res 15, 933–942 (2009). - PMC - PubMed
    1. Yukselen O, Turkyilmaz O, Ozturk AR, Garber M & Kucukural A DolphinNext: a distributed data processing platform for high throughput genomics. Bmc Genomics 21, 310 (2020). - PMC - PubMed
    1. Fraser C, Ryan J & Sarosiek K BCL-2 Family Proteins, Methods and Protocols. Methods Mol Biology 1877, 61–76 (2018). - PMC - PubMed
    1. Fraser C, Ryan J & Sarosiek K BH3 profiling: a functional assay to measure apoptotic priming and dependencies. Methods Mol Biology 1877, 61–76 (2019). - PMC - PubMed
    1. Jha P, Wang X & Auwerx J Analysis of Mitochondrial Respiratory Chain Supercomplexes Using Blue Native Polyacrylamide Gel Electrophoresis (BN-PAGE). Curr Protoc Mouse Biology 6, 1–14 (2016). - PMC - PubMed

Substances