Cancer anorexia-cachexia syndrome is characterized by more than one inflammatory pathway
- PMID: 38481033
- PMCID: PMC11154782
- DOI: 10.1002/jcsm.13430
Cancer anorexia-cachexia syndrome is characterized by more than one inflammatory pathway
Abstract
Background: The interdependence of cytokines and appetite-modifying hormones implicated in cancer anorexia-cachexia syndrome (CACS) remains unclear. This study aimed to regroup these cytokines and hormones into distinct inflammatory (or non-inflammatory) pathways and determine whether these pathways can classify patients with CACS phenotypes.
Methods: Clinical characteristics of 133 patients [61.7% male; mean age = 63.4 (SD: 13.1) years] with advanced cancer prior to oncology treatments were documented, including weight loss history. Patients completed the Functional Assessment of Anorexia-Cachexia Therapy (FAACT) questionnaire and Timed Up and Go test and had their sex-standardized skeletal muscle index (z-SMI) and fat mass index (z-FMI) derived using computed tomography scans. Their plasma levels of cytokines and appetite-modifying hormones were also determined. Date of death was recorded. Exploratory factor analysis (EFA) was used to regroup 15 cytokines and hormone into distinct inflammatory pathways (factors). For each patient, regression factor scores (RFS), which tell how strongly the patient associates with each factor, were derived. Two-step cluster analysis on the RFS was used to classify patients into groups. CACS phenotypes were correlated with RFS and compared between groups. Groups' survival was estimated using Kaplan-Meier analysis.
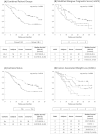
Results: Patients had low z-SMI (mean = -3.78 cm2/m2; SD: 8.88) and z-FMI (mean = 0.08 kg2/m2; SD: 56.25), and 62 (46.6%) had cachexia. EFA identified three factors: (F-1) IFN-γ, IL-1β, Il-4, IL-6, IL-10, IL-12, TGFβ1 (positive contribution), and IL-18 (negative); (F-2) IL-8, IL-18, MCP-1, TGFβ1, TNF-α (positive), and ghrelin (negative); and (F-3) TRAIL and leptin (positive), and TGFβ1 and adiponectin (negative). RFS-1 was associated with cachexia (P = 0.002); RFS-2, with higher CRP (P < 0.0001) and decreased physical function (P = 0.01); and RFS-3 with better appetite (P = 0.04), lower CRP (P = 0.002), higher z-SMI (P = 0.04) and z-FMI (P < 0.0001), and less cachexia characteristics (all P < 0.001). Four patient groups were identified with specific RFS clusters aligning with the CACS continuum from no cachexia to pre-cachexia, cachexia, and terminal cachexia. Compared to the other two groups, groups 1 and 2 had higher plasma levels of IL-18 and TRAIL. Group 1 also had lower inflammatory cytokines, adiponectin, and CRP compared to the other three groups. Group 3 had inflammatory cytokine levels similar to group 2, except for TNF-α and leptin which were lower. Group 4 had very high inflammatory cytokines, adiponectin, and CRP compared to the other 3 groups (all P < 0.0001). Groups 3 and 4 had worse cachexia characteristics (P < 0.05) and shorter survival (log rank: P = 0.0009) than the other two groups.
Conclusions: This exploratory study identified three distinct pathways of inflammation, or lack thereof, characterizing different CACS phenotypes.
Keywords: Anorexia; Cachexia; Cancer; Cytokines; Inflammation; Survival analysis.
© 2024 The Authors. Journal of Cachexia, Sarcopenia and Muscle published by Wiley Periodicals LLC.
Conflict of interest statement
The authors declare no conflict of interest.
Figures
References
-
- Lippitz BE. Cytokine patterns in patients with cancer: a systematic review. Lancet Oncol 2013;14:e218–e228. - PubMed
-
- Tisdale MJ. Mechanisms of cancer cachexia. Physiol Rev 2009;89:381–410. - PubMed
-
- Martin L, Senesse P, Gioulbasanis I, Antoun S, Bozzetti F, Deans C, et al. Diagnostic criteria for the classification of cancer‐associated weight loss. J Clin Oncol 2015;33:90–99. - PubMed
MeSH terms
Substances
LinkOut - more resources
Full Text Sources
Medical
Research Materials
Miscellaneous


