. 2023 Dec 20;9(3):635-648.
doi: 10.1016/j.ekir.2023.12.008. eCollection 2024 Mar.

Hybrid Immunity Overcomes Defective Immune Response to COVID-19 Vaccination in Kidney Transplant Recipients

Affiliations

Hybrid Immunity Overcomes Defective Immune Response to COVID-19 Vaccination in Kidney Transplant Recipients

Nicolas Gemander et al. Kidney Int Rep. .

Abstract

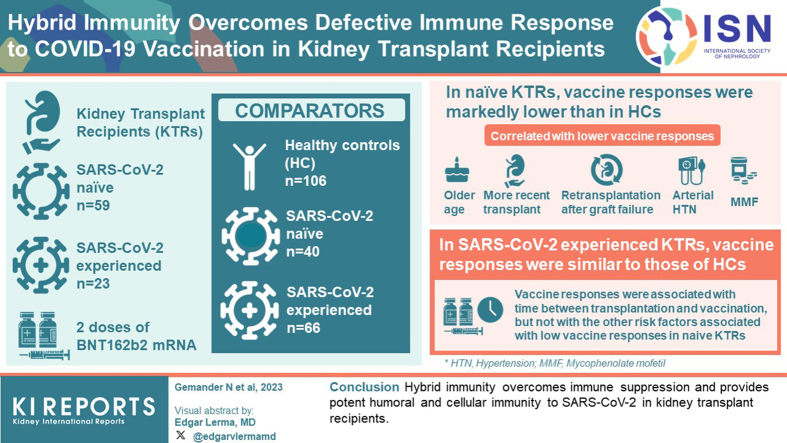
Introduction: Comorbidities and immunosuppressive therapies are associated with reduced immune responses to primary COVID-19 mRNA vaccination in kidney transplant recipients (KTRs). In healthy individuals, prior SARS-COV-2 infection is associated with increased vaccine responses, a phenotype called hybrid immunity. In this study, we explored the potential influence of immune suppression on hybrid immunity in KTRs.

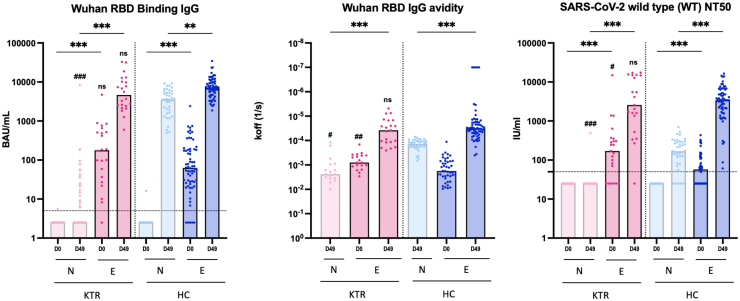
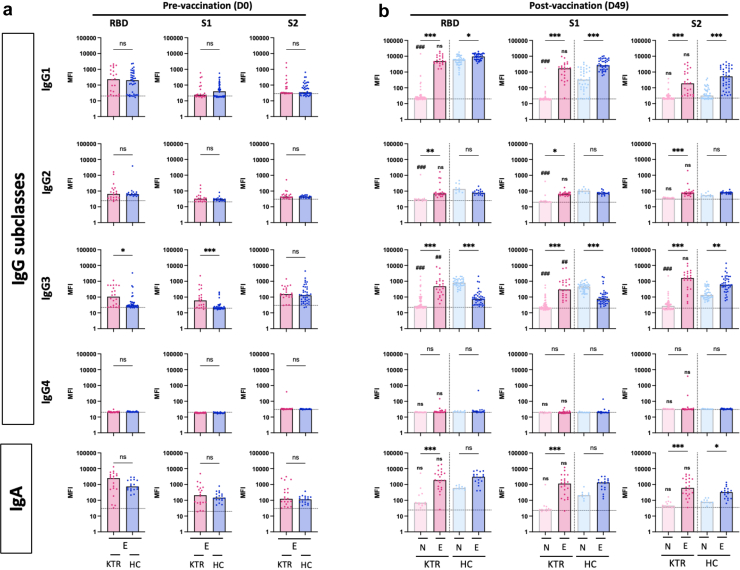
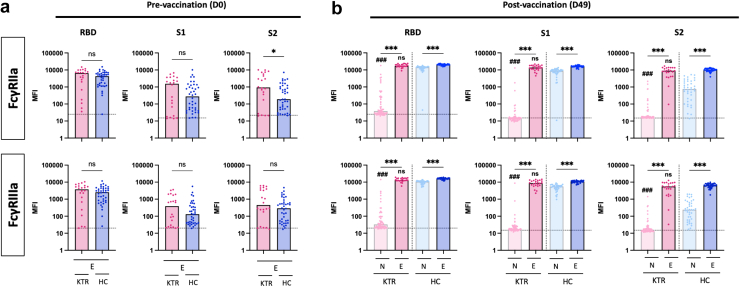
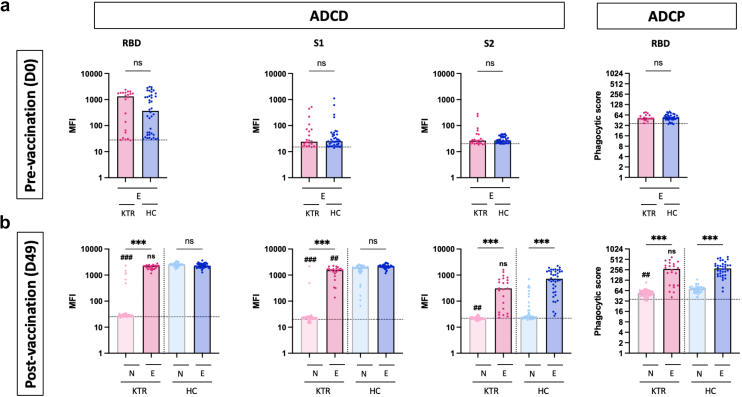
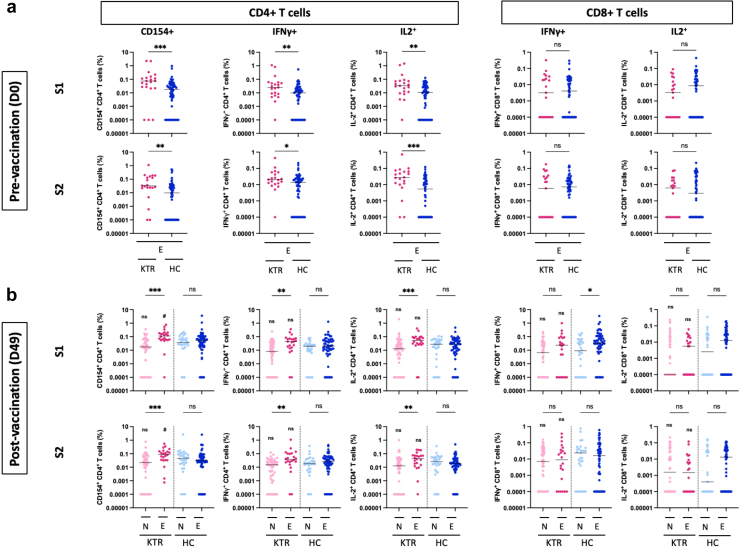
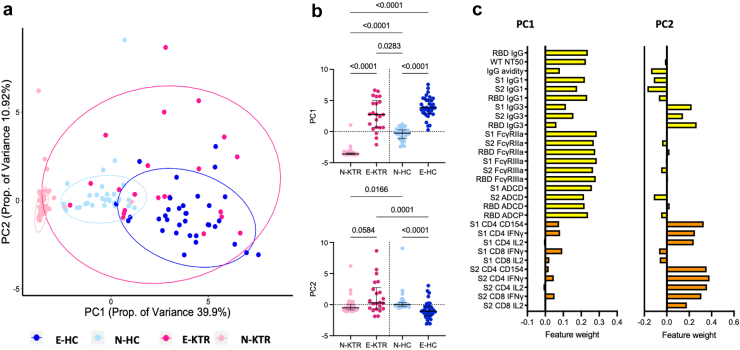
Methods: Eighty-two KTRs, including 59 SARS-CoV-2-naïve (naïve KTRs [N-KTRs]) and 23 SARS-CoV-2-experienced (experienced KTRs [E-KTRs]) patients, were prospectively studied and compared to 106 healthy controls (HCs), including 40 SARS-CoV-2-naïve (N-HCs) and 66 SARS-CoV-2-experienced (E-HCs) subjects. Polyfunctional antibody and T cell responses were measured following 2 doses of BNT162b2 mRNA vaccine. Associations between vaccine responses and clinical characteristics were studied by univariate and multivariate analyses.

Results: In naïve KTRs, vaccine responses were markedly lower than in HCs and were correlated with older age, more recent transplantation, kidney retransplantation after graft failure, arterial hypertension, and treatment with mycophenolate mofetil (MMF). In contrast, vaccine responses of E-KTRs were similar to those of HCs and were associated with time between transplantation and vaccination, but not with the other risk factors associated with low vaccine responses in naïve KTRs.

Conclusion: In conclusion, hybrid immunity overcomes immune suppression and provides potent humoral and cellular immunity to SARS-CoV-2 in KTRs.

Keywords: COVID-19; hybrid immunity; kidney transplantation; mRNA vaccination; nonneutralizing antibodies; systems immunology.


Figures

None
Graphical abstract
Figure 1
Figure 1
Binding IgG, RBD IgG avidity, and neutralizing antibody responses to SARS-CoV-2 mRNA vaccination in naïve and experienced KTRs. Serum levels of SARS-CoV-2 RBD specific binding IgG (BAU: binding antibody units), RBD specific IgG avidity (koff: dissociation rate constant) and titers of neutralizing antibodies (NT50: 50% neutralization titer) were measured before vaccination (D0) and 1 month after 2 doses of mRNA vaccine (D49) in naïve KTRs (N-KTRs, light pink), experienced KTRs (E-KTRs, dark pink), naïve HCs (N-HCs, light blue) and experienced HCs (E-HCs, dark blue). Bars indicate median values. Horizontal grid lines indicate a technical negative signal (blank). Groups were compared using the analysis of variance Kruskal-Wallis test with Dunn’s correction. For within HC or KTR comparisons, ns; aP < 0.05; bP < 0.01; cP < 0.001. For comparisons between HC and KTR, ns; dP < 0.05; eP < 0.01; fP < 0.001. HC, healthy control; KTR, kidney transplant recipient; ns, not significant; RBD, receptor binding domain.
Figure 2
Figure 2
IgG Subclasses and IgA responses to SARS-CoV-2 mRNA vaccination in naïve and experienced KTRs. Serum levels of SARS-CoV-2 RBD specific, spike S1 subunit specific, and spike S2 subunit specific IgG1, IgG2, IgG3, IgG4 and IgA were measured before vaccination (D0, panel a) and 1 month after vaccination (D49, panel b) in naïve KTRs (N-KTRs, light pink), experienced KTRs (E-KTRs, dark pink), naïve HCs (N-HCs, light blue) and experienced HCs (E-HC, dark blue). Bars indicate median values. Horizontal grid lines indicate a technical negative signal (blank). Groups were compared using the analysis of variance Kruskal-Wallis test with Dunn’s correction. For within HC or KTR comparisons, aP < 0.05; bP < 0.01; cP < 0.001. For comparisons between HC and KTR, ns; dP < 0.05; eP < 0.01; fP < 0.001. HC, healthy control; KTR, kidney transplant recipient; MFI, median fluorescent intensity; ns, not significant; RBD, receptor binding domain.
Figure 3
Figure 3
Fcγ receptors binding antibody responses to SARS-CoV-2 mRNA vaccination in naïve and experienced KTRs. Serum levels of SARS-CoV-2 RBD specific, spike S1 subunit specific, and spike S2 subunit specific antibodies binding the Fcγ receptors, FcγRIIa and FcγRIIIa were measured before vaccination (D0, panel a) and 1 month after vaccination (D49, panel b) in naïve KTRs (N-KTRs, light pink), experienced KTRs (E-KTRs, dark pink), naïve HCs (N-HCs, light blue) and experienced HCs (E-HC, dark blue). Bars indicate median values. Horizontal grid lines indicate a technical negative signal (blank). Groups were compared using the analysis of variance Kruskal-Wallis test with Dunn’s correction. For within HC or KTR comparisons, ns; aP < 0.05; bP < 0.01; cP < 0.001. For comparisons between HC and KTR, ns; dP < 0.05; eP < 0.01; fP < 0.001. HC, healthy control; KTR, kidney transplant recipient; MFI, median fluorescent intensity; ns, not significant; RBD, receptor binding domain
Figure 4
Figure 4
IgG-dependent complement deposition and phagocytosis responses to SARS-CoV-2 mRNA vaccination in naïve and experienced KTRs. Serum levels of SARS-CoV-2 RBD specific, spike S1 subunit specific, and spike S2 subunit specific IgG promoting complement deposition (ADCD) and cellular phagocytosis (ADCP) were measured before vaccination (D0, panel a) and 1 month after vaccination (D49, panel b) in naïve KTRs (N-KTRs, light pink), experienced KTRs (E-KTRs, dark pink) naïve HCs (N-HCs, light blue) and experienced HCs (E-HCs, dark blue). Levels of ADCD are expressed as MFI. Levels of ADCP are expressed as phagocytic score (see methods). Bars indicate median values. Horizontal grid lines indicate a technical negative signal (blank). Groups were compared using the analysis of variance Kruskal-Wallis test with Dunn’s correction. For within HC or KTR comparisons, ns; aP <0.05; bP < 0.01; cP < 0.001. For comparisons between HC and KTR, ns; dP < 0.05; eP < 0.01; fP < 0.001. HC, healthy control; KTR, kidney transplant recipient; MFI, median fluorescent intensity; ns, not significant; RBD, receptor binding domain.
Figure 5
Figure 5
CD4 and CD8 T cell responses to SARS-CoV-2 mRNA vaccination in naïve and experienced KTRs. Percentage of SARS-CoV-1 spike S1 subunit and spike S2 subunit specific CD4 T cells expressing CD154, IFNγ and IL2, and of CD8 T cells expressing IFNγ and IL-2 were measured in peripheral blood before vaccination (D0, panel a) and 1 month after vaccination (D49, panel b) in naïve KTRs (N-KTRs, light pink), experienced KTRs (E-KTRs, dark pink), naïve HCs (N-HCs, light blue) and experienced HCs (E-HC, dark blue). Bars indicate median values. Groups were compared using the analysis of variance Kruskal-Wallis test with Dunn’s correction. HC, healthy control; KTR, kidney transplant recipient; ns, not significant. For within HC or KTR comparisons, ns; aP < 0.05; bP < 0.01; cP < 0.001. For comparisons between HC and KTR, ns; dP < 0.05; eP < 0.01; fP < 0.001.
Figure 6
Figure 6
Principal component analysis of immune responses to SARS-CoV-2 mRNA vaccination in naïve and experienced KTRs. (a) Scatter plot of PCA including all immune response parameters except IgG2, IgG4 and IgA measured 1 month after vaccination (D49) in naïve KTRs (N-KTRs, light pink), experienced KTRs (E-KTRs, dark pink), naïve HCs (N-HCs, light blue) and experienced HCs (E-HC, dark blue). (b) Comparison of PC1 and PC2 values between groups by analysis of variance Kruskal-Wallis test with Dunn’s correction with P < 0.1. (c) Relative weighting of individual immune response parameters in PC1 and PC2. HC, healthy control; KTR, kidney transplant recipient, PC, principal component; PCA, principal component analysis.

Similar articles

Cited by

References

    1. Jager K.J., Kramer A., Chesnaye N.C., et al. Results from the ERA-EDTA Registry indicate a high mortality due to COVID-19 in dialysis patients and kidney transplant recipients across Europe. Kidney Int. 2020;98:1540–1548. doi: 10.1016/j.kint.2020.09.006. - DOI - PMC - PubMed
    1. Hilbrands L.B., Duivenvoorden R., Vart P., et al. COVID-19-related mortality in kidney transplant and dialysis patients: results of the ERACODA collaboration. Nephrol Dial Transplant. 2020;35:1973–1983. doi: 10.1093/ndt/gfaa261. - DOI - PMC - PubMed
    1. Williamson E.J., Walker A.J., Bhaskaran K., et al. Factors associated with COVID-19-related death using OpenSAFELY. Nature. 2020;584:430–436. doi: 10.1038/s41586-020-2521-4. - DOI - PMC - PubMed
    1. Caillard S., Chavarot N., Francois H., et al. Is COVID-19 infection more severe in kidney transplant recipients? Am J Transplant. 2021;21:1295–1303. doi: 10.1111/ajt.16424. - DOI - PMC - PubMed
    1. Sattler A., Schrezenmeier E., Weber U.A., et al. Impaired humoral and cellular immunity after SARS-CoV-2 BNT162b2 (tozinameran) prime-boost vaccination in kidney transplant recipients. J Clin Invest. 2021;131 doi: 10.1172/JCI150175. - DOI - PMC - PubMed