. 2024 Mar 6:36:238-255.
doi: 10.1016/j.bioactmat.2024.02.026. eCollection 2024 Jun.

Tumor-derived apoptotic extracellular vesicle-mediated intercellular communication promotes metastasis and stemness of lung adenocarcinoma

Affiliations

Tumor-derived apoptotic extracellular vesicle-mediated intercellular communication promotes metastasis and stemness of lung adenocarcinoma

Xiaotian He et al. Bioact Mater. .

Abstract

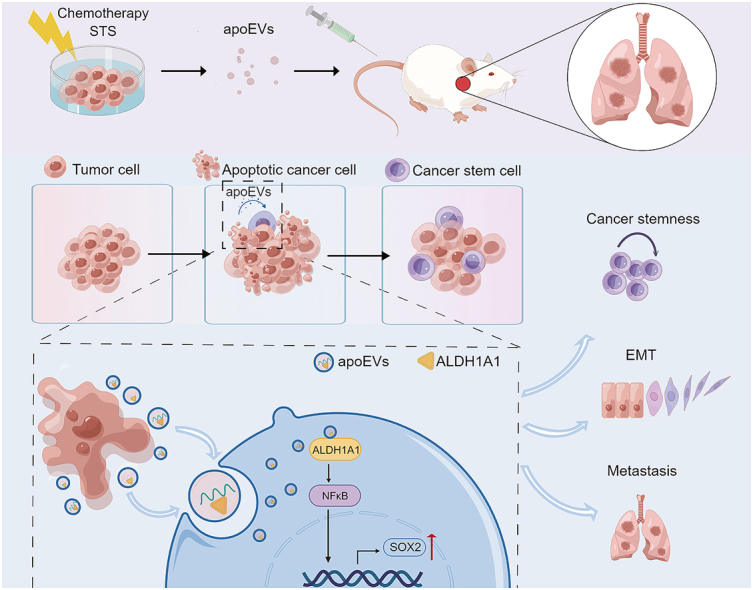
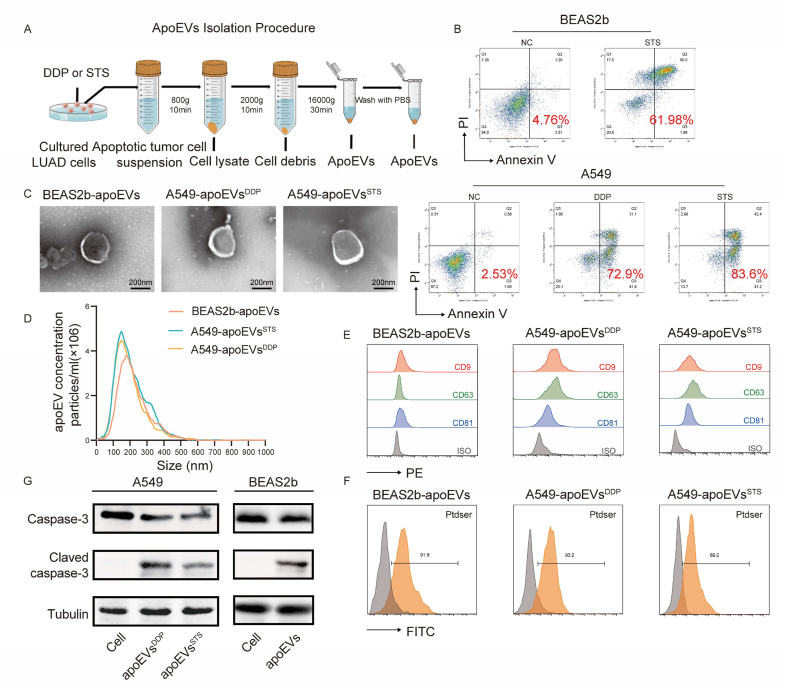
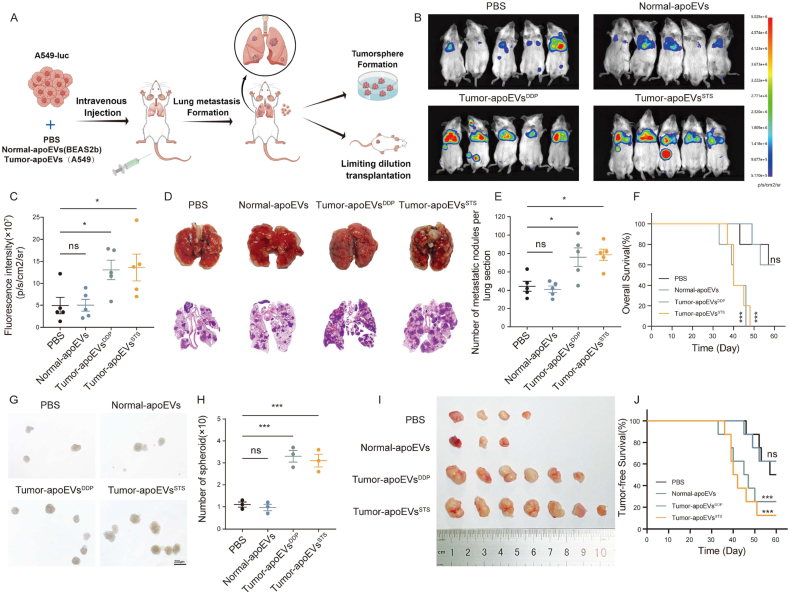
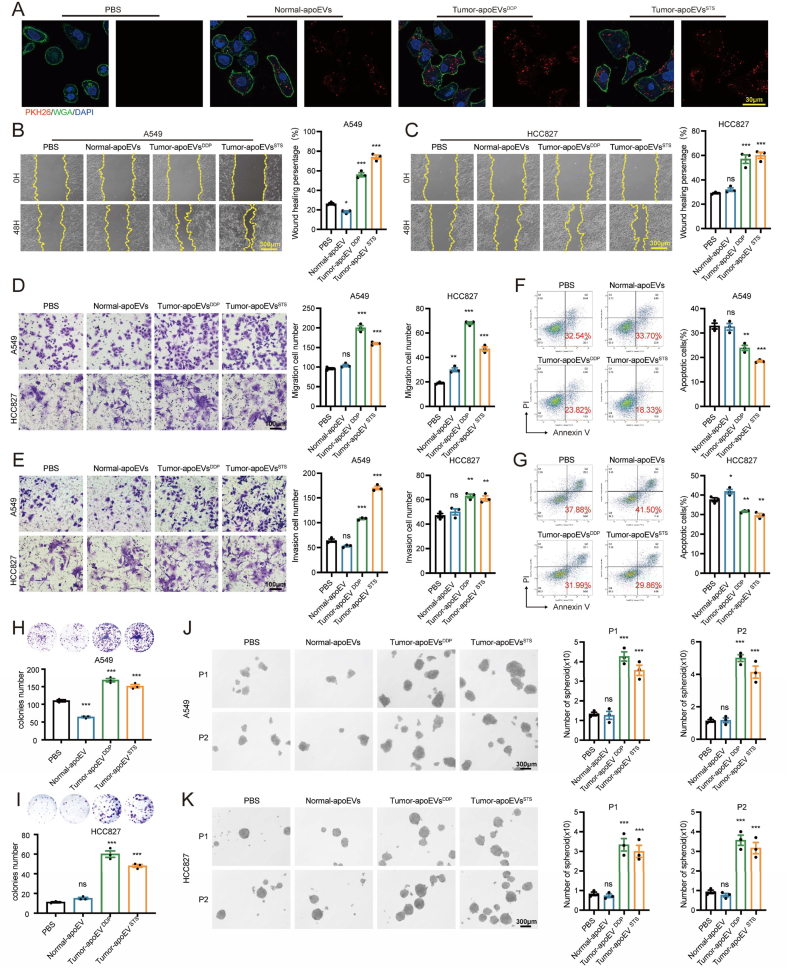
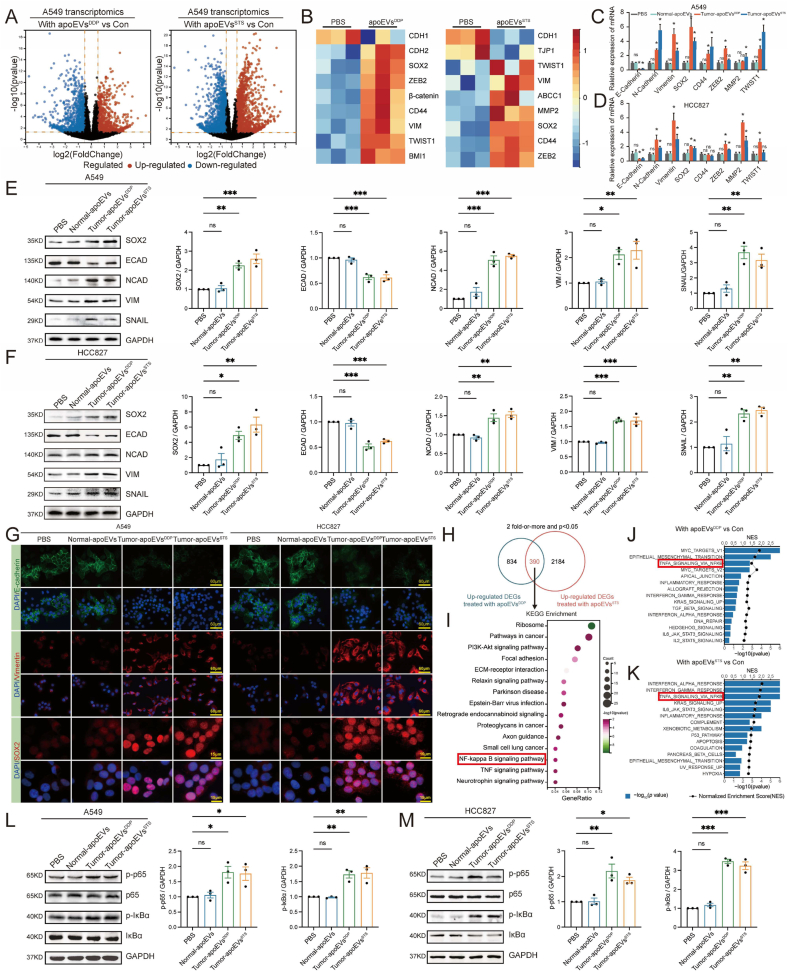
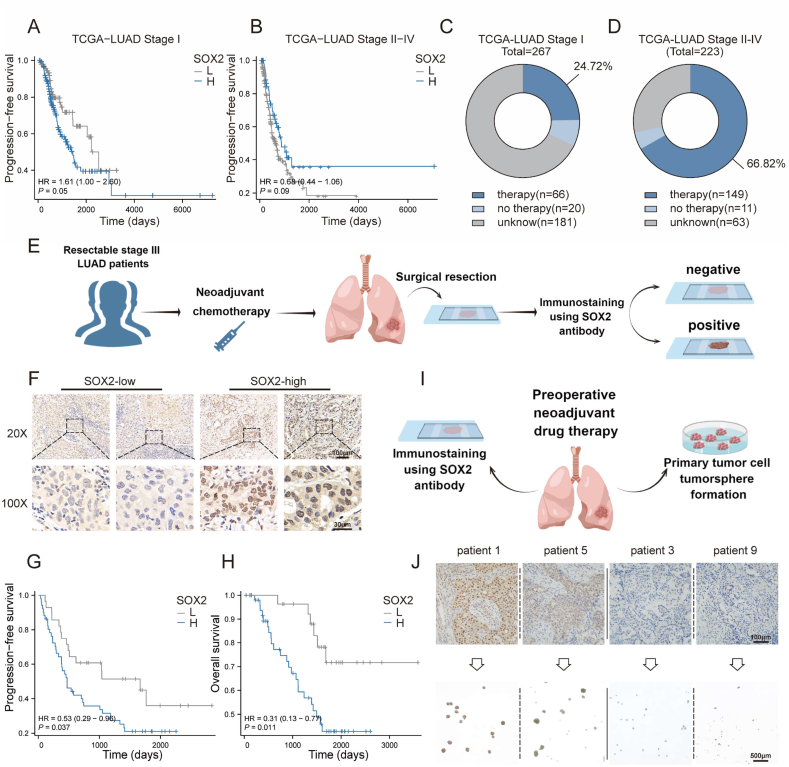
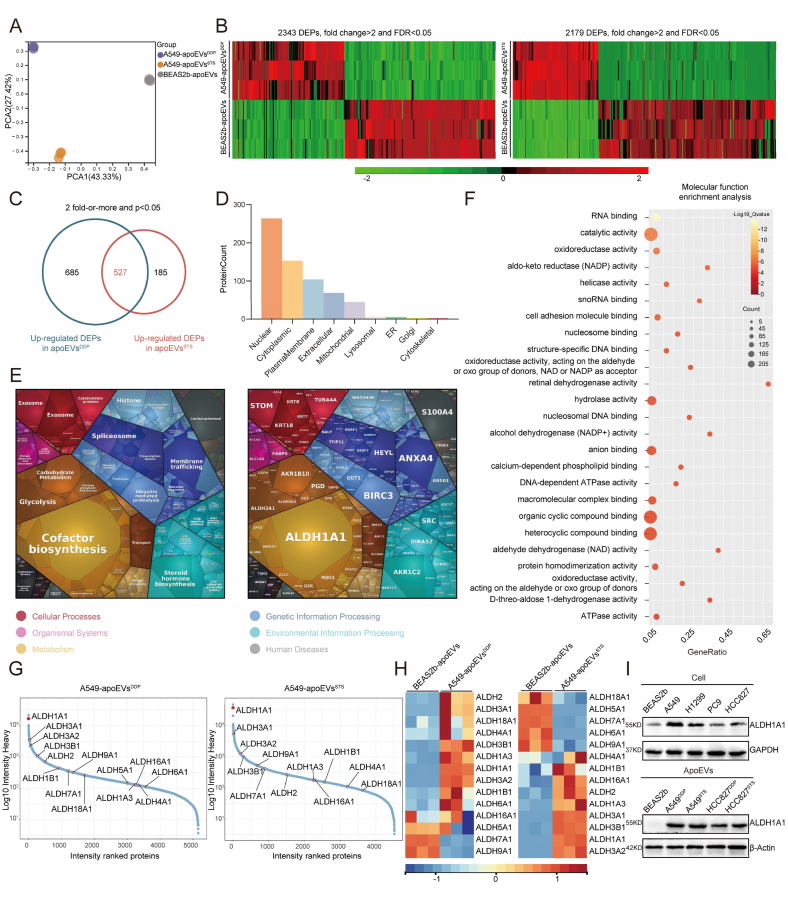
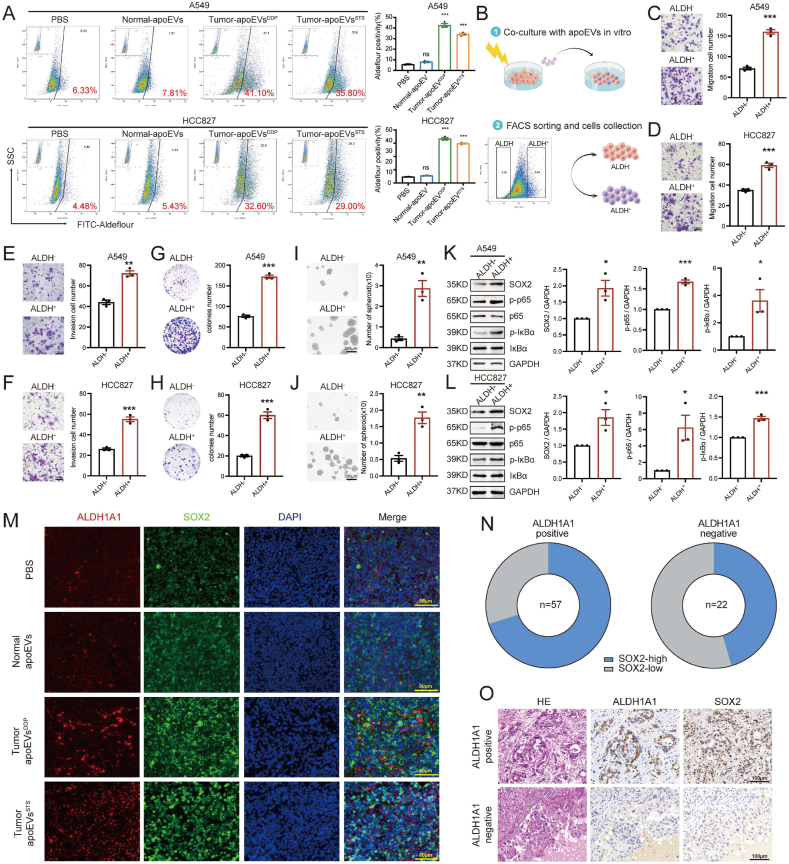
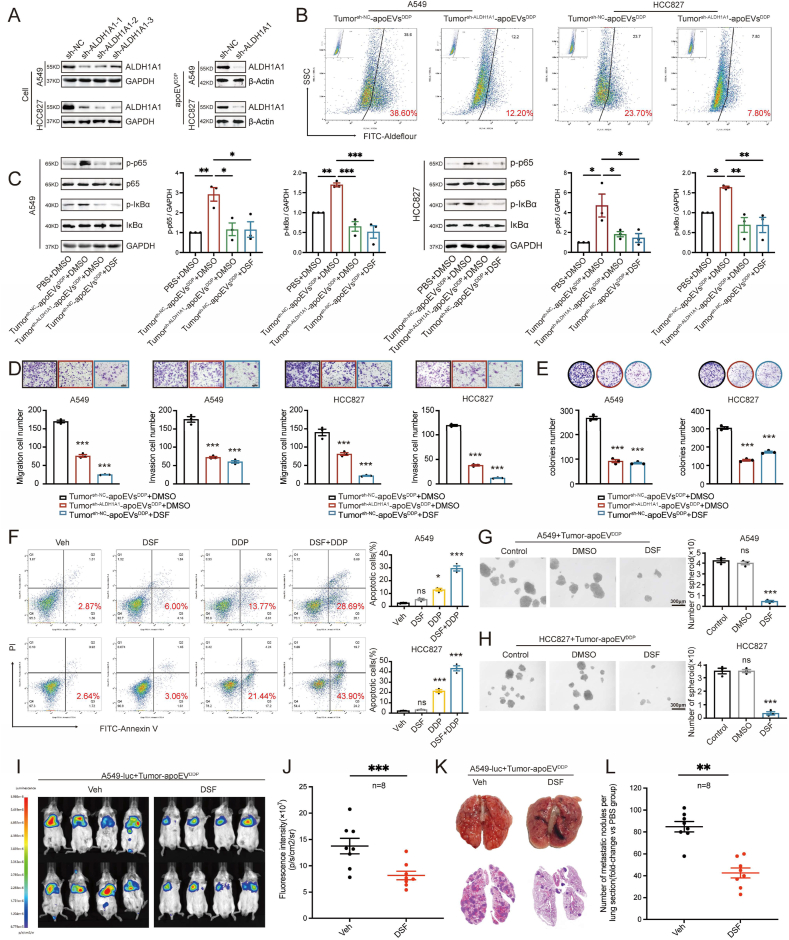
Apoptosis has long been recognized as a significant mechanism for inhibiting tumor formation, and a plethora of stimuli can induce apoptosis during the progression and treatment of tumors. Moreover, tumor-derived apoptotic extracellular vesicles (apoEVs) are inevitably phagocytosed by live tumor cells, promoting tumor heterogeneity. Understanding the mechanism by which apoEVs regulate tumor cells is imperative for enhancing our knowledge of tumor metastasis and recurrence. Herein, we conducted a series of in vivo and in vitro experiments, and we report that tumor-derived apoEVs promoted lung adenocarcinoma (LUAD) metastasis, self-renewal and chemoresistance. Mechanistically, we demonstrated that apoEVs facilitated tumor metastasis and stemness by initiating the epithelial-mesenchymal transition program and upregulating the transcription of the stem cell factor SOX2. In addition, we found that ALDH1A1, which was transported by apoEVs, activated the NF-κB signaling pathway by increasing aldehyde dehydrogenase enzyme activity in recipient tumor cells. Furthermore, targeting apoEVs-ALDH1A1 significantly abrogated these effects. Collectively, our findings elucidate a novel mechanism of apoEV-dependent intercellular communication between apoptotic tumor cells and live tumor cells that promotes the formation of cancer stem cell-like populations, and these findings reveal that apoEVs-ALDH1A1 may be a potential therapeutic target and biomarker for LUAD metastasis and recurrence.

Keywords: Apoptotic extracellular vesicles; Lung adenocarcinoma; Proteomics; SOX2; Stemness.


Conflict of interest statement

The authors declare no conflict of interest.

Figures

Image 1
Graphical abstract
Fig. 1
Fig. 1
Characteristics of apoptotic extracellular vesicles (apoEVs) derived from LUAD cells and normal lung epithelial cells. (A) Schematic diagram of apoEVs isolation. A549 and BEAS2b are induced by STS or Cisplatin (DDP) for 24 h and then apoptotic cell suspensions are isolated using a differential centrifugation to obtain apoEVs. (B) Representative flow cytometry analysis of BEAS2b apoptosis after STS treatment, and A549 apoptosis after Cisplatin (DDP) and STS treatment. (C) Representative TEM micrographs of apoEVs collected from the conditioned medium after apoptosis induction treatment of A549 and BEAS2b cells evaluated are shown. Scale bar, 200 nm. (D) Size distribution of BEAS2b- and A549-apoEVs were measured by nanoparticle tracking analyzer (NTA). (E) Representative histograms show the profile of the CD9, CD63 and CD81 levels in comparison to isotype control-stained for the BEAS2b and A549-derived apoEVs. (F) Nanoflow cytometry show apoEVs express apoptotic vesicles-specific surface markers Ptdser (shown by Annexin V staining). (G) Western blot of the indicated proteins in apoEVs, Tubulin (loading control) were used, western blotting was repeated at least three times and representative data are shown.
Fig. 2
Fig. 2
Tumor-derived apoEVs promote metastasis and stemness of LUAD in vivo. (A) Schematic diagram illustrating the procedure of experimental lung metastasis formation assay. (B) Bioluminescence imaging of lung metastasis formation model, which tumor-bearing mice treated with PBS or apoEVs (n = 5). (C) Scatter plot depicting the ROI quantification of A549-luc whole-body metastatic tumor radiance from mice described in (B), tumor-bearing mice treated with PBS was used as control group. (D) Representative images of the lung and H&E staining of tissue sections taken from the lung metastasis formation model. (E) The number of metastatic nodules in lung sections described in (D). (F)Kaplan–Meier plot for the OS of lung metastasis mice from the experiment described in (A), tumor-bearing mice treated with PBS was used as control group, all p values are based on log-rank (Mantel–Cox test). (G, H) Dissociated fresh A549-luc single cells from lung metastasis formation model performing tumorsphere formation assay in vitro. The numbers and volumes of tumorsphere were quantified. (I) Image of tumors formed by 1000 A549-luc cells from lung metastasis formation model before subcutaneous injection into NOD/SCID mice (n = 8). (J) Kaplan–Meier plot for the tumor-free survival of lung metastasis mice from the experiment described in (I), all p values are based on log-rank (Mantel–Cox test). Data represent means ± SEM of three independent experiments. *p < 0.05; **p < 0.01; ***p < 0.001; ns., not significant.
Fig. 3
Fig. 3
Tumor-derived apoEVs increase migration, chemo-resistance and stemness of LUAD in vitro (A) Representative confocal microscopy images showing uptake of apoEVs (red) by LUAD cells in vitro. Cells nuclear staining with DAPI (blue) and membrane staining with WGA (green). apoEVs were stained with the PKH26 (red). Scalebars, 30 μm. (B, C) Wound healing assays of LUAD cells pre-treated with PBS or apoEVs. Scale bars, 300 μm. (D, E) Migration and invasion assays of LUAD cells pre-treated with PBS or apoEVs. Scale bars, 100 μm. (F, G) Cisplatin-induced apoptosis assay in LUAD cells pre-treated with PBS or apoEVs were stained with PI and Annexin V-FITC. Flow cytometry was conducted to determine the percentage of apoptotic cells. (H–I) Colony formation assay of LUAD cells pre-treated with PBS or apoEVs. (J–K) Tumorsphere formation assay of LUAD cells pre-treated with PBS or apoEVs. Representative photographs of spheroids formed after incubation. The histogram indicates the number of spheres formed per 1000 cells. Scale bars, 300 μm. P1 and P2 represent passage 1 and 2, respectively. LUAD cell lines treated with PBS was used as control group. Data represent means ± SEM of three independent experiments and p values are based on a two-tailed Student's t-test. *p < 0.05; **p < 0.01; ***p < 0.001; ns., not significant.
Fig. 4
Fig. 4
Tumor-apoEVs activate EMT phenotype and NF-κB/SOX2 signaling in LUAD cells. (A) Volcano plots indicating differentially expressed genes between A549 pretreated with A549-apoEVsDDP or A549-apoEVsSTS compared with PBS-treated A549 (A549-Con). Significant differences (log2 fold-change >0.5, FDR <0.05) are indicated in red (up-regulated) and blue (down-regulated), RNA-seq was performed using biologically independent samples (n = 3). (B) A heatmap showing the expression of EMT-related genes and pluripotency genes in each up-regulated DEGs (n = 3). (C, D) EMT-related genes and pluripotency genes were described in (B) was quantified by qPCR. (E, F) The protein expression of SOX2 and EMT-related genes was verified by Western blot analysis. (G)Representative immunofluorescence images show fluorescence localization and intensity of E-cadherin, Vimentin and SOX2 in LUAD cells pre-treated with apoEVs or PBS. (H) Venn diagram representing the numbers of unique and overlapping up-regulated genes between two groups described in (A). (I) KEGG analysis with 390 selected genes that were significantly up-regulated in A549 pre-treated with A549-apoEVsDDP and A549-apoEVsSTS. (J, K) Gene set enrichment analysis (GSEA) shows that both A549-apoEVs mediate multiple hallmark pathways. (L, M) Western blot showing activation of enhanced phosphorylation of p65 and IκBα in tumor-apoEVs treated LUAD cells. LUAD cell lines treated with PBS was used as control group. Western blotting and IF were repeated at least three times and representative data are shown. All data are represented as mean ± SEM of three independent experiments and p values are based on a two-tailed Student's t-test. *p < 0.05; ns., not significant.
Fig. 5
Fig. 5
High SOX2 expression is associated with poor prognosis and CSCs in LUAD patients following conventional treatment. (A)Kaplan-Meier survival analysis of PFS of stage I patients' high level (n = 164) versus low level (n = 97) mRNA expression of SOX2 in TCGA-LUAD cohort. Data were analyzed using the log-rank test. Patients who had not progressed at the time of analysis were censored. (B) Kaplan-Meier survival analysis of PFS of stage II-IV patients' high level (n = 56) versus low level (n = 154) mRNA expression of SOX2 in TCGA-LUAD cohort. Data were analyzed using the log-rank test. Patients who had not progressed at the time of analysis were censored. (C, D) Distribution of patients receiving treatment or not from the TCGA-LUAD cohort described in (A) and (B) (Undergoing radiotherapy, chemotherapy, or targeted therapy, collectively referred to as the therapy group). (E) Schematic representation of the analysis of patient samples for SOX2 expression in LUAD. SOX2 immunostaining was performed on tissue specimens (surgical resection samples) from 79 LUAD patients with neoadjuvant chemotherapy containing platinum drugs. The IHC samples were scored by independent pathologists as either SOX2-high (The IHC score≥4) or SOX2-low (The IHC score≤3). (F) Representative microscopic images of SOX2-high and SOX2-low cases in LUAD tissue samples described in (D). Scale bars, 100 μm and 20 μm. (G, H) Kaplan–Meier analysis of the probability of OS and PFS in 79 LUAD patients according to SOX2-high expression (n = 50) or SOX2-low expression (n = 29). Data were analyzed using the log-rank test. Patients whose survival time or disease progression could not be accurately recorded at the time of analysis were censored. (I) Schematic protocol for assessing tumorsphere formation ability with regard to SOX2 expression of the resected tumor taken from patients after neoadjuvant target or chemotherapy. (J) The expression of SOX2 was evaluated in LUAD specimens by immunohistochemistry (n = 9). Their corresponding isolated cells were plated in stem cell medium. Scale bars represent 100 μm in the upper panels and 500 μm in the lower panels.
Fig. 6
Fig. 6
Quantitative proteomic analysis revealed that ALDH1A1 was a functional protein within apoEVs. (A) PCA plot of protein expression of apoEV-A549DDP, apoEV-A549STS and apoEV-BEAS2b. (B) Heatmaps depict the clustering of differentially expressed proteins (DEPs) between Beas2b and A549-apoEVs (n = 3). (C) The Venn diagram illustrates the number of proteins that were significantly up-regulated DEPs in both A549-apoEVsDDP and A549-apoEVsSTS compared with BEAS2b-apoEVs. (D) Subcellular localization of DEPs described in (C). (E) The Proteomaps demonstrate the KEGG functional categories of the up-regulated DEPs in both A549-apoEVsDDP and A549-apoEVsSTS. Each polygon depicted in the Proteomaps represents a distinct KEGG pathway, with its size indicating the protein's quantitative intensity determined through diaPASEF quantitative proteomic analysis. (F) ‘Molecular function’ enrichment analysis of the DEPs in (C). The top 25 enriched GO terms were presented as a bubble chart. The Y-axis of the graph represents Gene Ontology (GO) terms, while the X-axis represents the rich factor GeneRatio. The color of each bubble on the graph indicates the level of enrichment significance, while the size of the bubble corresponds to the number of DEPs. (G) The quantified proteins in A549-apoEVsDDP and A549-apoEVsSTS are ranked based on their heavy intensity. The ALDH protein family in apoEVs is highlighted in the scatter plots. (H) Heatmap showing the detected ALDH protein family expression in A549-apoEVs compared with BEAS2b-apoEVs (n = 3). (I) Western blot showing ALDH1A1 expression in the indicated LUAD cell lines and apoEVs, with GAPDH and β-actin as the loading standard.
Fig. 7
Fig. 7
apoEVs-ALDH1A1 is involved in activating NF-κB -SOX2 axis. (A)ALDH enzyme activity assay of LUAD cells pre-treated with PBS or apoEVs. Aldefluor-positive cells were quantified by flow cytometry. Each sample treated with the ALDH inhibitor DEAB was used as a negative control. (B)Schematic diagram illustrating the experimental design for subsequent cell function assays in vitro. (C–F) Migration and invasion assays of ALDH+ and ALDH- LUAD cell populations. ALDH+ and ALDH- cell populations were sorted from LUAD cells pre-treated with apoEVsDDP. Scale bars, 100 μm. (G, H) Colony formation assay of ALDH+ and ALDH- cell populations. (I, J) Tumorsphere formation assay of ALDH+ and ALDH- cell populations. Representative photographs of spheroids formed after incubation. The histogram indicates the number of spheres formed per 1000 cells. Scale bars, 200 μm. (K, L) The activation of the p-p65 and p- IκBα signaling and upregulated SOX2 expression were in ALDH + LUAD cell populations pre-treated with tumor-apoEVsDDP analyzed by Western blot. (M) Representative immunofluorescence images of ALDH1A1 (red), SOX2 (green), and DAPI nuclear counterstaining (blue) in tissue samples taken from the mouse lung metastases formation assay in Fig. 2. The presented data are a representative image of n = 5. Scale bars, 80 μm. (N, O) Representative microscopic images of H&E staining and IHC analyses of ALDH1A1 and SOX2 expression in human clinical LUAD tissue samples. The presented data are a representative image of n = 5. Scale bars, 100 μm. Western blotting and IF were repeated at least three times and representative data are shown. All data are represented as mean ± SEM of three independent experiments and p values are based on a two-tailed Student's t-test. *p < 0.05; **p < 0.01; ***p < 0.001; ns., not significant.
Fig. 8
Fig. 8
Targeting apoEVs-ALDH1A1 diminished the activity of apoEVs-ALDH1A1 in promoting migration, invasion, drug resistance, and stemness of LUAD. (A) Western blot analysis showing ALDH1A1 level in ALDH1A1 knockdown (sh-ALDH1A1) LUAD cells and apoEVs (apoEVs-ALDH1A1) derived from the knockdown LUAD cell. (B)ALDH enzyme activity assay of LUAD cells pre-treated with indicated tumor-apoEVs. Each sample treated with the ALDH inhibitor DEAB was used as a negative control. The presented data are a representative image of three independent experiments. (C)Western blot showing the activation of p-p65 and p- IκBα signaling in LUAD cells treated with apoEVsDDP derived from control LUAD cells (sh-NC) can be reversed by Disulfiram (DSF), while p-p65 and p-IκBα signaling in LUAD cells treated with apoEVsDDP derived from ALDH1A1 knockdown LUAD cells (sh-ALDH1A1) were not significantly up-regulated. Colony formation (E), migration and invasion (D) assay showing the effect of indicated apoEVs and DSF on tumor-apoEVs treated cell model. (F) Flow cytometry analysis of apoptotic cells exhibiting the synergistic response of DSF and cisplatin on tumor-apoEVs treated cell model. The percentages of apoptotic cells were plotted. (G, H) Estimation of the suppressing effect of DSF on tumor-apoEVs treated cell model using the tumorsphere formation assay. The tumor-apoEVs treated cell model was treated with the DSF (0.15 μM) for 5 days. Scale bars, 300 μm. (I) Bioluminescence imaging of animals treated with tumor-derived apoEVs to estimate the suppressing effect of DSF on the lung metastasis formation model. (J) Scatter plot depicting the ROI quantification of A549-luc whole-body metastatic tumor radiance from mice described in (I). Animals treated with DSF orally (n = 8); Animals treated with an equal volume of the vehicle orally (n = 8). (K) Representative images of the lung and H&E staining of tissue sections taken from the lung metastasis formation model. (L) The number of metastatic nodules in lung sections described in (K). Data represent means ± SEM of three independent experiments. *p < 0.05; **p < 0.01; ***p < 0.001; ns., not significant.

Similar articles

Cited by

References

    1. Sung H., Ferlay J., Siegel R.L., Laversanne M., Soerjomataram I., Jemal A., Bray F. Global cancer Statistics 2020: GLOBOCAN estimates of incidence and mortality worldwide for 36 cancers in 185 countries. Ca - Cancer J. Clin. 2021;71:209–249. doi: 10.3322/caac.21660. - DOI - PubMed
    1. Travis W.D., Brambilla E., Noguchi M., Nicholson A.G., Geisinger K.R., Yatabe Y., Beer D.G., Powell C.A., Riely G.J., Van Schil P.E., Garg K., Austin J.H.M., Asamura H., Rusch V.W., Hirsch F.R., Scagliotti G., Mitsudomi T., Huber R.M., Ishikawa Y., Jett J., Sanchez-Cespedes M., Sculier J.-P., Takahashi T., Tsuboi M., Vansteenkiste J., Wistuba I., Yang P.-C., Aberle D., Brambilla C., Flieder D., Franklin W., Gazdar A., Gould M., Hasleton P., Henderson D., Johnson B., Johnson D., Kerr K., Kuriyama K., Lee J.S., Miller V.A., Petersen I., Roggli V., Rosell R., Saijo N., Thunnissen E., Tsao M., Yankelewitz D. International association for the study of lung cancer/american thoracic society/european respiratory society international multidisciplinary classification of lung adenocarcinoma. J. Thorac. Oncol. 2011;6:244–285. doi: 10.1097/JTO.0b013e318206a221. - DOI - PMC - PubMed
    1. Reya T., Morrison S.J., Clarke M.F., Weissman I.L. Stem cells, cancer, and cancer stem cells. Nature. 2001;414:105–111. doi: 10.1038/35102167. - DOI - PubMed
    1. Visvader J.E., Lindeman G.J. Cancer stem cells: current status and evolving complexities. Cell Stem Cell. 2012;10:717–728. doi: 10.1016/j.stem.2012.05.007. - DOI - PubMed
    1. Laplane L., Solary E. Towards a classification of stem cells. Elife. 2019;8 doi: 10.7554/eLife.46563. - DOI - PMC - PubMed