. 2024 Feb 11;20(5):1578-1601.
doi: 10.7150/ijbs.88539. eCollection 2024.

NK-92MI Cells Engineered with Anti-claudin-6 Chimeric Antigen Receptors in Immunotherapy for Ovarian Cancer

Affiliations

NK-92MI Cells Engineered with Anti-claudin-6 Chimeric Antigen Receptors in Immunotherapy for Ovarian Cancer

Junping Li et al. Int J Biol Sci. .

Abstract

Background: The application of chimeric antigen receptor (CAR) NK cells in solid tumors is hindered by lack of tumor-specific targets and inefficient CAR-NK cell efficacy. Claudin-6 (CLDN6) has been reported to be overexpressed in ovarian cancer and may be an attractive target for CAR-NK cells immunotherapy. However, the feasibility of using anti-CLDN6 CAR-NK cells to treat ovarian cancer remains to be explored. Methods: CLDN6 expression in primary human ovarian cancer, normal tissues and cell lines were detected by immunohistochemistry and western blot. Two types of third-generation CAR NK-92MI cells targeting CLDN6, CLDN6-CAR1 NK-92MI cells with domains containing self-activated elements (NKG2D, 2B4) and CLDN6-CAR2 NK-92MI cells with classical domains (CD28, 4-1BB) were constructed by lentivirus transfection, sorted by flow cytometry and verified by western blot and qPCR. OVCAR-3, SK-OV-3, A2780, Hey and PC-3 cells expressing the GFP and luciferase genes were transduced. Subcutaneous and intraperitoneal tumor models were established via NSG mice. The ability of CLDN6-CAR NK cells to kill CLDN6-positive ovarian cancer cells were evaluated in vitro and in vivo by live cell imaging and bioluminescence imaging. Results: Both CLDN6-CAR1 and CLDN6-CAR2 NK-92MI cells could specifically killed CLDN6-positive ovarian cancer cells (OVCAR-3, SK-OV-3, A2780 and Hey), rather than CLDN6 negative cell (PC-3), in vitro. CLDN6-CAR1 NK-92MI cells with domains containing self-activated elements (NKG2D, 2B4) exhibited stronger cytotoxicity than CLDN6-CAR2 NK-92MI cells with classical domains (CD28, 4-1BB). Furthermore, CLDN6-CAR1 NK cells could effectively eliminate ovarian cancer cells in subcutaneous and intraperitoneal tumor models. More importantly, CAR-NK cells combined with immune checkpoint inhibitors, anti-PD-L1, could synergistically enhance the antitumor efficacy of CLDN6-targeted CAR-NK cells. Conclusions: These results indicate that CLDN6-CAR NK cells possess strong antitumor activity and represent a promising immunotherapeutic modality for ovarian cancer.

Keywords: Claudin-6; NK cells; PD-1; PD-L1; chimeric antigen receptor; ovarian cancer.


Conflict of interest statement

Competing Interests: The authors have declared that no competing interest exists.

Figures

Figure 1
Figure 1
Analysis of CLDN6 expression in human normal tissue, primary ovarian cancer tissues, and human ovarian cancer cells. (A) Different levels of CLDN6 expression in primary ovarian cancer tissues were evaluated by two experienced pathologists using a 4-point scale at 400× magnification; scale bar, 50 µm. (B) The percentage of CLDN6-positive staining with different scores in 62 primary ovarian cancer samples is indicated. (C) Expression of CLDN6 in human ovarian cancer cell lines assessed by western blot with the anti-CLDN6 mAb. (D) Relative expression of CLDN6mRNA normalized to GAPDH in various human ovarian cancer cell lines was assessed by qPCR. (E) Ten human normal tissue samples were immunostained with an anti-CLDN6 antibody to determine the expression of CLDN6 at 200× magnification; scale bar, 100 µm.
Figure 2
Figure 2
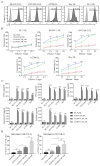
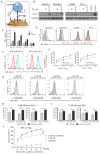
Cytotoxicity activities and cytokine secretion of CLDN6-specific NK-92MI cells in vitro. (A) Luciferase and GFP (GL) expression detected in the indicated genetically modified human ovarian cancer cells by FACS. GFP was used as a detection marker. (B) The indicated genetically modified and parental NK cells were coincubated with different target cells at varying effector to target (E:T) ratios for 8 h. Cell lysis was tested using a standard nonradioactive cytotoxicity assay. The graphed results are presented as the mean ± SD of three or more independent experiments. Error bars denote SD. ***p < 0.001, ****p < 0.0001, two-tailed Student's t test adjusted p value. (C) The production of TNF-α, IFN-γ, GM-CSF, granzyme B, and perforin by CAR-NK cells after coculture with target cells for 24 h at a 1:1 E:T ratio was determined by enzyme-linked immunosorbent assay (ELISA). CLDN6-CAR1 NK and CLDN6-CAR2 NK are statistically compared with NK-92MI and CD19-CAR NK samples (p < 0.0001). Error bars denote SD. ns, not significant, * p < 0.05, **p < 0.01, ****p < 0.0001, two-tailed Student's t test adjusted p value. (D) Detection of the cell surface activation marker CD107a on CAR-NK cells after stimulation with SK-OV-3 and OVCAR-3 cells at an E:T ratio of 1:1 or no stimulation. We defined the y-axis as the ΔCD107a+ percentage of NK cells minus the CD107a+ percentage in resting NK cells from the CD107a+ percentage of NK cells stimulated with target cells. Error bars denote SD. ns, not significant, *p < 0.05, **p < 0.01, one-way ANOVA with Holm-Sidak test adjusted p value. See also Figure S4.
Figure 3
Figure 3
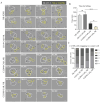
Analysis of CAR-NK92MI cell cytotoxicity based on live cell imaging for SK-OV-3 cells. (A) Representative time-lapse images of the interaction between different CAR-NK cells (yellow lines) and SK-OV-3cells (white lines). (B-C) Time for killing (B) and the number of NK cells engaging with a cancer cell (C). Error bars denote SD. ns, not significant, **p < 0.01, ****P<0.0001, Mann-Whitney test adjusted p value. See also Figure S5 and S6 and online supplementary videos S1-4. A time display on the left upper corner indicated in (A) represents the changed time post CAR-NK cell coculture with target cells.
Figure 4
Figure 4
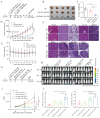
CLDN6-CAR1 NK92MI cells suppress tumor growth in NSG mice without causing evident toxicity. (A) Schematic representation of the s.c. xenograft model experiments. NSG mice received 1 × 10⁶ SK-OV-3 cells with subcutaneous injection; 5 × 10⁶ CAR-NK cells were administered through the tail vein on day 11, and tumor volume and mouse body weight were regularly measured. (B-E) Tumors dissected from different groups at the end point (B), tumor weight in each group (C), tumor volume curves (D), and mouse body weight (E) (5 mice/group). Error bars denote SD. **p < 0.01, ***p < 0.001, ****p < 0.0001, one-way ANOVA with Holm-Sidak test adjusted p value. (F) Histopathological analysis of mouse organ tissues by hematoxylin and eosin (H&E) staining. Representative photomicrographs are shown (magnification ×20). Each scale bar represents 100 µm. (G) Schematic representation of the experiments. NSG mice received 1 × 10⁶ OVCAR-3 GL cells with subcutaneous (s.c.) injection; 5 × 10⁶ CAR-NK cells were administered intravenously (i.v.) or peritumorally (p.t.) on days 10 and 17, and BLI was performed regularly. (H and I) Representative bioluminescence images (H) and bioluminescence kinetics ROI (I) of OVCAR-3 GL tumor growth in the model shown in (G) (4 mice/group). (J) Mice were euthanized 12-14 days post CAR-NK cell infusion to analyze the infiltration percentages of CAR-NK cells in tumors and PB by flow cytometry. Error bars denote SD. *p < 0.05, **p < 0.01, ***p < 0.001, one-way ANOVA with Holm-Sidak test adjusted p value.
Figure 5
Figure 5
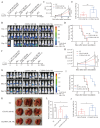
CLDN6-CAR1 NK92MI cells showed strong antitumor activity in vivo in both intraperitoneal and systemic metastatic OC models. (A) Schematic representation of the experiments. NSG mice received 1 × 10⁶ SK-OV-3 GL cells intraperitoneally; 5 × 10⁶ CAR-NK cells were administered intraperitoneally on days 14 and 21, and BLI was performed on days 13, 20 and 34. (B and C) Representative bioluminescence images (B) and bioluminescence kinetics ROI (C) of SK-OV-3 GL tumor growth in the model shown in (A) (5 mice/group). Error bars denote the SD. **p < 0.01, ****p < 0.0001, one-way ANOVA adjusted p value. (D) Kaplan-Meier survival curve of SK-OV-3 GL cells intraperitoneally injected into mice (5 mice/group). ***p = 0.0006, log-rank test. (E) Twelve to 14 days after CAR-NK cell infusion, the infiltration percentages of CAR-NK cells in PB were analyzed by flow cytometry. Error bars denote SD. **p < 0.01, two-tailed Student's t test adjusted p value. (F) Schematic representation of the mouse OC systemic metastatic model experiments. NSG mice received 1 × 10⁶ OVCAR-3 GL cells via the tail vein; 5 × 10⁶ CAR-NK cells were administered intraperitoneally on days 17 and 25, and BLI was performed on days 16, 24 and 36. (G and H) Representative bioluminescence images (G) and bioluminescence kinetics (H) of OVCAR-3 GL tumor growth in the model shown in (F) (5 mice/group). Error bars denote the SD. ns, not significant, *** p < 0.001, **** p < 0.0001, one-way ANOVA adjusted p value. (I) Kaplan-Meier survival curve of OVCAR-3 GL cells intravenously injected mice (5 mice/group). ** p = 0.0011, log-rank test. (J) Fourteen days after CAR-NK cell infusion, the infiltration percentages of CAR-NK cells in PB were analyzed by flow cytometry. Error bars denote SD. *p < 0.05, two-tailed Student's t test adjusted p value. (K and L) Lung dissected from different groups (K) and the number of nodules (blank arrow) on the lung surface at the end point (L) (3 mice/group). Error bars denote SD. *p < 0.05, one-way ANOVA adjusted p value.
Figure 6
Figure 6
Contribution of CLDN6-CAR1 NK92MI cells to immunotherapy mediated by PD-1/PD-L1 blockade. (A) A cartoon depicting the tumor cell and CAR-NK cell interaction through the PD-1/PD-L1 axis. (B-D) The PD-L1 expression level of target cells after CAR-NK cells were cocultured with target cells (SK-OV-3, OVCAR-3, A2780 and PC-3) 6 hours was detected by western blot (B) with the anti-PD-L1 mAb and flow cytometry (D) with anti-PD-L1 conjugated with APC fluorochromes. A549 cells were used as a negative control, and H358 cells were used as a positive control. Relative expression of CLDN6 normalized to GAPDH was analyzed by ImageJ software (C). Error bars denote SD. (E) The PD-L1 expression levels of SK-OV-3 and OVCAR-3 cells pretreated with IFN-γ 6 hours were detected by flow cytometry with anti-PD-L1 conjugated with APC fluorochromes. (F) SK-OV-3 GL, SK-OV-3 GL with IFN-γ pretreated (IFN-γ-SK-OV-3 GL), OVCAR-3 GL, OVCAR-3 GL with IFN-γ pretreated (IFN-γ-OVCAR-3 GL) target cells were incubated with CLDN6-CAR1 NK effector cells 8 hours at varying effector to target (E:T) ratios. Cell lysis was tested using a standard nonradioactive cytotoxicity assay. Error bars denote SD. ** p < 0.01, two-tailed Student's t test adjusted p value. (G) The PD-1 expression level of CLDN6-CAR1 NK cells stimulated by SK-OV-3, IFN-γ-SK-OV-3, OVCAR-3, and IFN-γ-OVCAR-3 was detected by anti-PD-1 conjugated with APC fluorochromes. (H and I) SK-OV-3 GL, IFN-γ-SK-OV-3 GL, OVCAR-3 GL, and IFN-γ-OVCAR-3 GL target cells were incubated with CLDN6-CAR1 NK effector cells at the indicated E:T ratios of 1:1 with or without 10 μg/mL anti-PD-L1 (H) and anti-PD-1 (I) in triplicate wells of white 96-well plates for 8 hours. Error bars denote SD. ns, not significant, * p < 0.05, ** p < 0.01, two-tailed Student's t test adjusted p value. (J) Hey GL (PD-L1 positive, Figure S7) cells were incubated with CLDN6-CAR1 NK cells at the indicated E:T ratios of 1:1 with or without 10 μg/mL anti-PD-L1 in triplicate wells of white 96-well plates. Target cell viability was monitored every 2 hours, 6 times in total. Error bars denote the SD. *** p < 0.001, two-way ANOVA adjusted p value. See also Figure S7-S9.
Figure 7
Figure 7
Anti-PD-L1 enhanced the antitumor efficacy of CLDN6-CAR1 NK92MI cells in NSG mice. (A) Schematic representation of the treatment scheme. NSG mice received 1 × 10⁶ Hey GL cells with subcutaneous (s.c.) injection; 5 × 10⁶ CAR-NK cells and 10mg/kg anti-PD-L1 were administered peritumorally (p.t.) at the indicated time, and BLI was performed regularly. (B and C) Representative bioluminescence images (B) and bioluminescence ROI (C) of Hey GL tumor growth in the model shown in (A) (5 mice/group). Error bars denote SD. ns, not significant, * p < 0.05, **** p < 0.001, one-way ANOVA adjusted p value. (D) Mice were euthanized 12-14 days post CAR-NK cell infusion to analyze the infiltration percentages of CAR-NK cells in tumors, PB and spleen by flow cytometry. Error bars denote SD. ns, not significant, ** p < 0.01, *** p <0.001, one-way ANOVA test adjusted p value. (E) Schematic representation of the treatment scheme. NSG mice received 1 × 10⁶ Hey GL cells with intraperitoneal (i.p.) injection; 5 × 10⁶ CAR-NK cells and anti-PD-L1 were administered intraperitoneally on the indicated time, and BLI was performed regularly. (F and G) Representative bioluminescence images (G) and bioluminescence ROI (H) of Hey GL tumor growth in the model shown in (F) (5 mice/group). Error bars denote SD. * p < 0.05, **** p < 0.0001, one-way ANOVA adjusted p value. (H) Kaplan-Meier survival curve of Hey GL cells intraperitoneally injected into mice (5 mice/group). **** p < 0.0001 (CLDN6-CAR1 NK group versus control group), * p < 0.05 (CLDN6-CAR1 NK+anti-PD-L1 group versus CLDN6-CAR1 NK group), Log rank (Mantel-Cox) test. (I) Infiltration percentages of CAR-NK cells in PB were analyzed by flow cytometry two weeks after CAR-NK cell infusion. Error bars denote SD. *p < 0.05, two-tailed Student's t test adjusted p value.

References

    1. Xia C, Dong X, Li H. et al. Cancer statistics in China and United States, 2022: profiles, trends, and determinants. Chin Med J (Engl) 2022;135(5):584–590. - PMC - PubMed
    1. Peremiquel-Trillas P, Frias-Gomez J, Alemany L, Predicting Ovarian-Cancer Burden in Catalonia by 2030: An Age-Period-Cohort Modelling. Int J Environ Res Public Health. 2022. 19(3) - PMC - PubMed
    1. Henderson JT, Webber EM, Sawaya GF. Screening for Ovarian Cancer: Updated Evidence Report and Systematic Review for the US Preventive Services Task Force. JAMA. 2018;319(6):595–606. - PubMed
    1. Lorusso D, Ceni V, Muratore M. et al. Emerging role of immune checkpoint inhibitors in the treatment of ovarian cancer. Expert Opin Emerg Drugs. 2020;25(4):445–453. - PubMed
    1. Suh YJ, Lee B, Kim K. et al. Bevacizumab versus PARP-inhibitors in women with newly diagnosed ovarian cancer: a network meta-analysis. BMC Cancer. 2022;22(1):346. - PMC - PubMed