. 2024 Feb 11;20(5):1547-1562.
doi: 10.7150/ijbs.83040. eCollection 2024.

Inhibition of BRD4 Attenuates ER Stress-induced Renal Ischemic-Reperfusion Injury

Affiliations

Inhibition of BRD4 Attenuates ER Stress-induced Renal Ischemic-Reperfusion Injury

Paula Diaz-Bulnes et al. Int J Biol Sci. .

Abstract

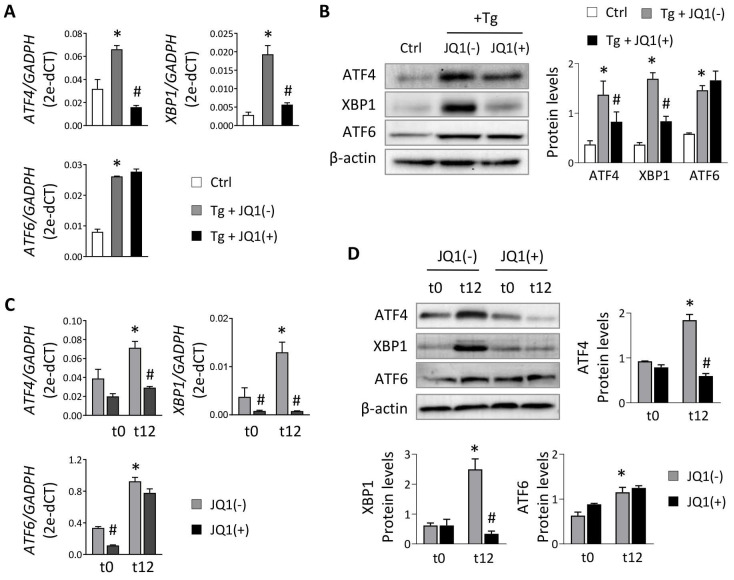
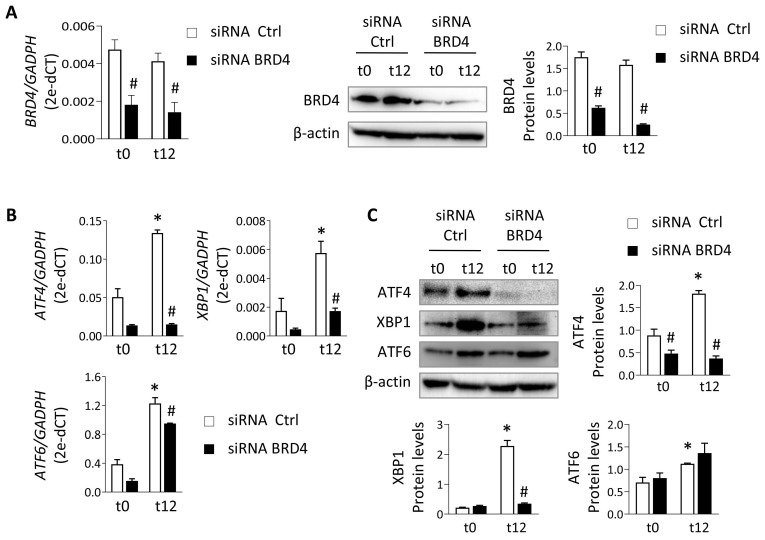
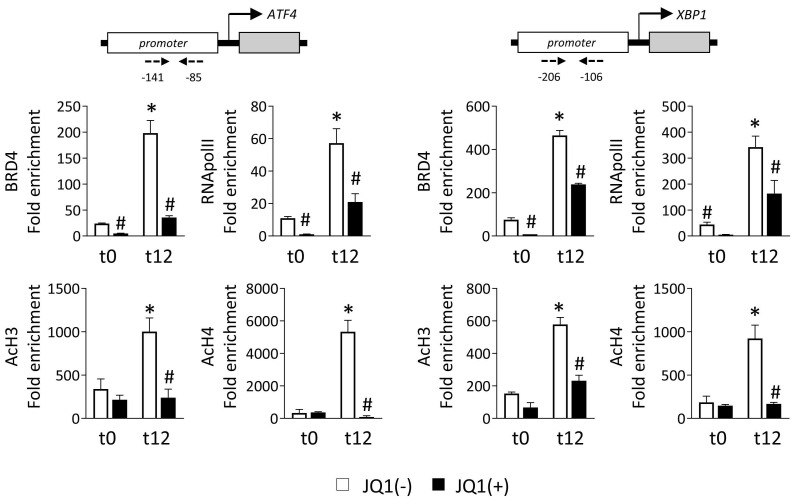
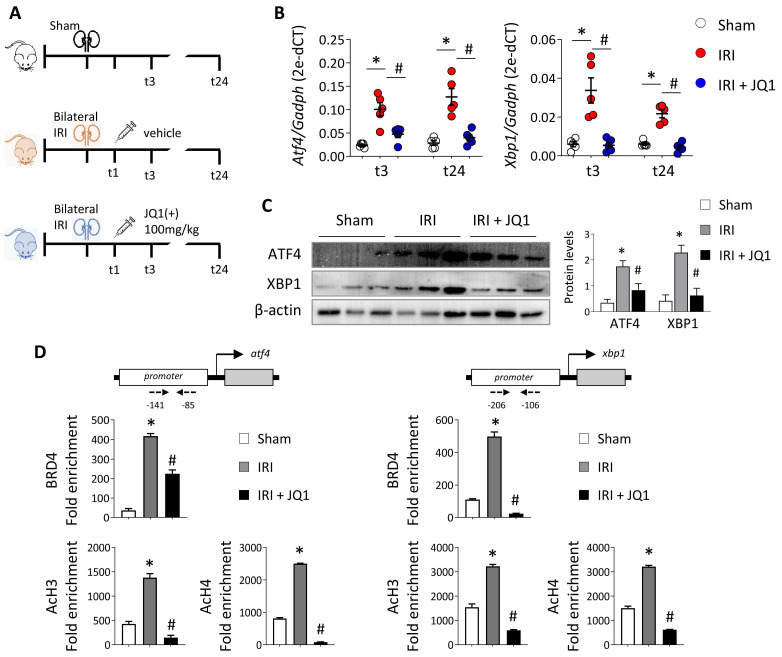
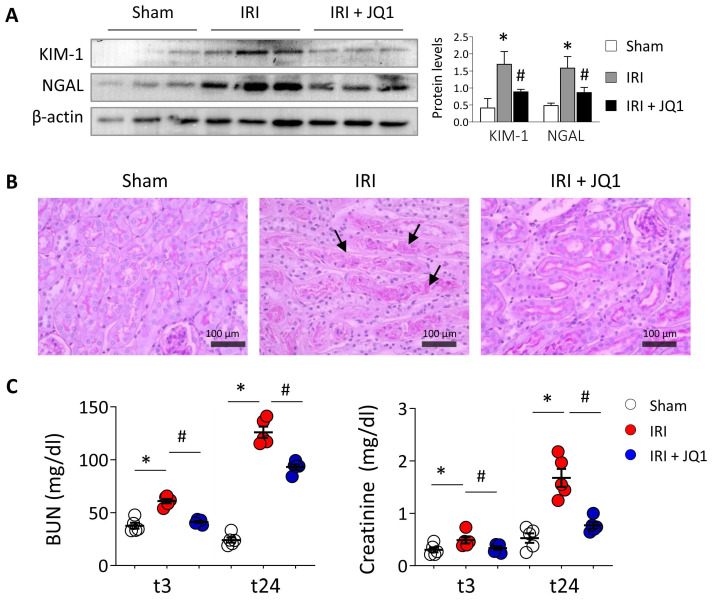
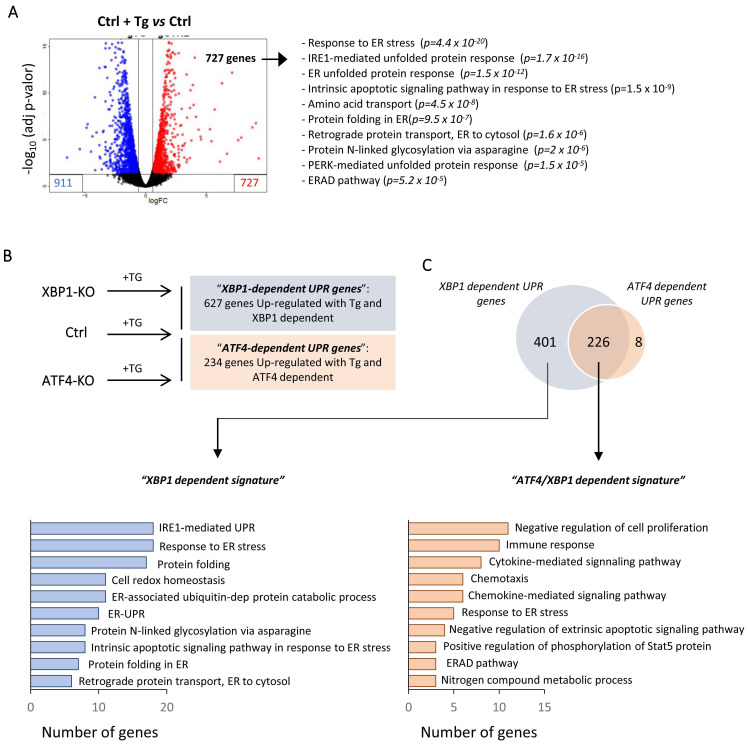
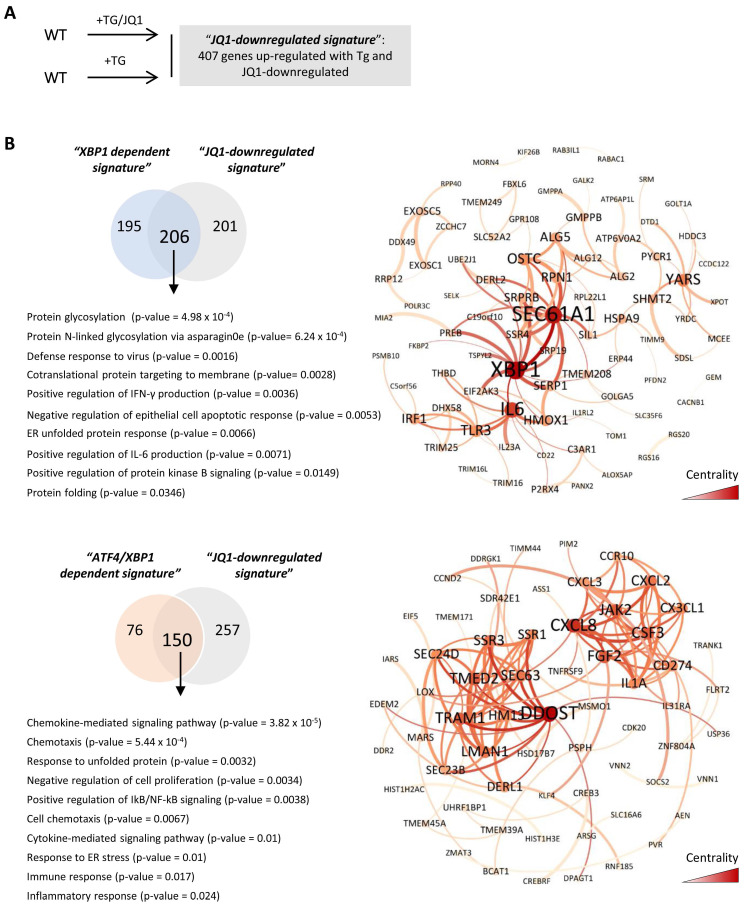
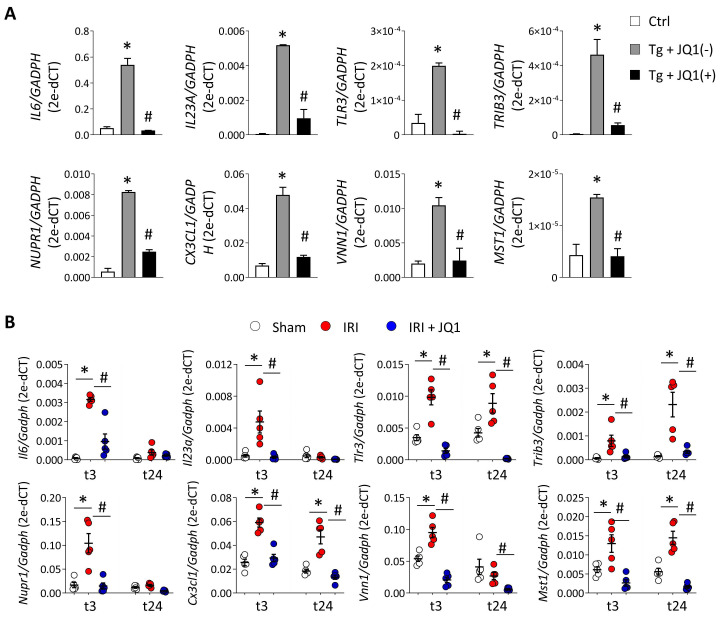
Renal ischemia-reperfusion injury (IRI) leads to endoplasmic reticulum (ER) stress, thereby initiating the unfolded protein response (UPR). When sustained, this response may trigger the inflammation and tubular cell death that acts to aggravate the damage. Here, we show that knockdown of the BET epigenetic reader BRD4 reduces the expression of ATF4 and XBP1 transcription factors under ER stress activation. BRD4 is recruited to the promoter of these highly acetylated genes, initiating gene transcription. Administration of the BET protein inhibitor, JQ1, one hour after renal damage induced by bilateral IRI, reveals reduced expression of ATF4 and XBP1 genes, low KIM-1 and NGAL levels and recovery of the serum creatinine and blood urea nitrogen levels. To determine the molecular pathways regulated by ATF4 and XBP1, we performed stable knockout of both transcription factors using CRISPR-Cas9 and RNA sequencing. The pathways triggered under ER stress were mainly XBP1-dependent, associated with an adaptive UPR, and partially regulated by JQ1. Meanwhile, treatment with JQ1 downmodulated most of the pathways regulated by ATF4 and related to the pathological processes during exacerbated UPR activation. Thus, BRD4 inhibition could be useful for curbing the maladaptive UPR activation mechanisms, thereby ameliorating the progression of renal disease.

Keywords: BRD4; ER stress; Hypoxia; UPR; renal damage.


Conflict of interest statement

Competing Interests: The authors have declared that no competing interest exists.

Figures

Figure 1
Figure 1
Treatment with JQ1 ameliorates overexpression of UPR genes induced by thapsigargin and hypoxia in HK-2 cells. Renal TECs (HK-2 cell line) were treated with DMSO (Ctrl) or Tg (4 μM, 24 h) (A,B) or cultured under hypoxic conditions (1% O2, 5% CO2) at different times (t0, normoxia; t12, 12 h) (C,D). The inhibitor of BET proteins, JQ1(+), or its inactive enantiomer, JQ1(-), were co-cultured at the same indicated times under both cultured conditions. Gene expression levels of ATF4, XBP1 and ATF6 were analyzed by RT-PCR (A,C) and protein levels were analyzed by western blot (B,D). Data are expressed as the mean ± SEM of at least three independent experiments. GADPH and β-actin were used as housekeeping markers of RT-PCR and western blot, respectively. Statistical analyses involved use of the two-tailed Student's paired t-test and the Wilcoxon test. *p<0.05 vs. control (DMSO) or t0 (normoxia) and # vs. cells treated with JQ1(-) + Tg or cells in hypoxia (t12) treated with JQ1(-).
Figure 2
Figure 2
Specific BRD4 silencing impairs expression of UPR genes induced under hypoxia. HK-2 cells were transfected with a specific siRNA against BRD4 (siRNA BRD4) or control siRNA (siRNA Ctrl, 40 nM, 48 h) before exposure to conditions of normoxia (t0) or hypoxia (t12). (A) Transcriptional and protein levels of BDR4 after specific silencing. Transcriptional levels of ATF4, XBP1 and ATF6 were determined by RT-PCR (B) and protein levels (C) assayed by western blot. Data are expressed as mean ± SEM of three independent experiments. Statistical analyses involved use of the two-tailed Student's paired t-test and the Wilcoxon test. *p<0.05 vs. t0 (normoxia), # vs. siRNA Ctrl-treated cells.
Figure 3
Figure 3
JQ1 inhibits direct binding of BRD4 protein to UPR genes induced by hypoxia in HK-2 cells. HK-2 cells were pretreated with or without JQ1 (+) or its enantiomer JQ1 (-) (500 nM, 24h), and subsequently cultured under conditions of normoxia (t0) and hypoxia (t12) at the times indicated. ChIP assays were performed with specific antibodies against BRD4, RNA POL II, AcH3 and AcH4, and the region of interest of ATF4 (A) and XBP1 (B) genes was amplified using specific primers (dashed arrows) by RT-PCR. Results are represented as the relative enrichment of each antibody relative to the IgG control. Data are expressed as the mean ± SEM of three independent experiments; *p<0.05 vs. t0 (normoxia) and # vs. cells treated with JQ1 (-).
Figure 4
Figure 4
Administration of JQ1 after IRI blocks BRD4 recruitment to UPR genes, decreasing their expression. (A) C57BL/6 mice were treated with JQ1 (100 mg/kg) or vehicle (10% cyclodextran) 1 h after IRI. Sham mice were used as the control group. Samples were obtained at 3 h (t3) and 24 h (t24) post-ischemic damage. Groups: Sham, IRI (with vehicle) and IRI+JQ1 (administration of JQ1). (B) Gene expression levels were analyzed by RT-PCR at 3 h and 24 h. Results are means ± SEM of five animals per group. *p<0.05 vs. control and # vs. IRI group. (C) ATF4 and XBP1 protein levels were detected by western blot assay 3 h after IRI. (D) A ChIP assay was carried out in renal samples from the Sham, IRI and IRI+JQ1 groups using specific antibodies for BRD4, AcH3 and AcH4. Rabbit IgG was used as a negative control. Enrichment of binding regions in the atf4 and xbp1 promoters was quantified by RT-PCR using specific primers (dashed arrows). Data are summarized as the mean ± SEM of three independent experiments and expressed as the enrichment relative to the IgG negative control. Statistical analyses involved use of the two-tailed Student's unpaired t-test and the U-Mann Whitney test. *p<0.05 vs. Sham group; # p<0.05 vs. IRI group.
Figure 5
Figure 5
Inhibition of BET proteins with JQ1 restores renal damage induced by in vivo IRI. C57BL/6 mice were treated with JQ1 (100 mg/kg) or vehicle (10% cyclodextran) 1 h after IRI. Sham mice were used as the control group. Samples were obtained at 3 (t3) and 24 (t24) h post-ischemic damage. Groups: Sham, IRI (with vehicle) and IRI+JQ1 (administration of JQ1). (A) Renal KIM-1 and NGAL protein levels were analyzed by western blot 24 h post-damage. Data are summarized as the mean ± SEM of five animals per group. The western blot image shows the expression levels of three representative animals per group. Statistical analysis involved use of the two-tailed Student's unpaired t-test and the Mann-Whitney U test. *p<0.05 vs. Sham, and # vs. IRI group. (B) Representative PAS-stained sections for Sham, IRI and IRI+JQ1 groups. Scale bar= 100 µm and arrows indicate presence of tubular casts. C) Serum creatinine (mg/dl) and blood urea nitrogen (BUN, mg/dl) in mice from the three groups at 3 h (t3) and 24 h (t24) post-ischemic damage. The Mann-Whitney test was used. *p<0.05 vs. Sham and # vs. IRI group.
Figure 6
Figure 6
XBP1 and ATF4-dependent transcriptional pathways following UPR activation in HK-2 cells. Control HK-2 cells, and XBP1 (XBP1-KO) and ATF4 (ATF4-KO)-deficient cells were untreated or treated with Tg (4 μM, 24 h) before mRNA isolation and RNA sequencing analysis. (A) Volcano plot of genes differentially expressed between HK-2 cells treated with Tg relative to untreated cells. Upregulated and downregulated genes are shown in red and in blue, respectively. The ten most significant gene ontology (GO) pathways of upregulated genes after Tg treatment are shown, with the probability of each category in parentheses. (B) Scheme of the different HK-2 cell types (Ctrl, XBP1-KO, and ATF4-KO) treated with Tg and comparisons between them. “XBP1-dependent UPR genes” (blue) are derived from the genes upregulated in control (Ctrl) cells but not in XBP1 KO cells. “ATF4-dependent UPR genes” (red) are derived from the genes upregulated in control (Ctrl) cells but not in ATF4-KO cells. (C) Venn diagram of the comparison between “XBP1-dependent UPR genes” and “ATF4-dependent UPR genes” and GO analysis of the ten most significant categories of each one according to the number of genes.
Figure 7
Figure 7
JQ1 reverts expression of molecular pathways regulated by XBP1 and ATF4 under UPR activation. (A) Scheme showing the comparative of HK-2 cells treated with Tg or the combination of Tg plus JQ1 to determine the signature of genes upregulated by Tg and modulated by JQ1, “JQ1-dependent signature”. (B) Venn diagrams showing comparisons between “XBP1 dependent signature” or “ATF4/ XBP1 dependent signature” and “JQ1 dependent signature” to select the 206 genes regulated by XBP1 and downmodulated by JQ1, and the 150 genes regulated by ATF4/XBP1 and downmodulated by JQ1. GO analysis of the ten most significant categories of genes whose expression was reduced by JQ1 under UPR activation and functional interaction networks of genes downmodulated by JQ1 and regulated by XBP1 or ATF4/XBP1. Network centrality is indicated by the color scale and node size.
Figure 8
Figure 8
Downregulation of immune, inflammatory and apoptotic genes as consequence of blockage of BET proteins under UPR activation. (A) HK-2 cells were untreated or treated with Tg (4 μM, 24 h) in the presence of JQ1 (+) or its enantiomer, JQ1 (-). (B) Kidney samples were obtained from the sham, IRI and IRI+JQ1 mouse groups (n=5 per group) at 3 (t3) and 24 (t24) h post-reperfusion. Expression of XBP1-dependent genes (IL6, IL23A, TLR3, TRIB3, NURP1), XBP1/ATF4-dependent genes (CXCL3, VNN1) and ATF4-dependent genes (MST1) was measured by RT-PCR analysis; GAPDH was used as a housekeeping gene. Data are summarized as the mean ± SEM of at least three independent experiments. Statistical analyses involved use of the two-tailed Student's paired t-test and Mann-Whitney U test. *p<0.05 vs. control (Ctrl, DMSO) or sham group, and # vs. cells treated with Tg + JQ1 (-) or IRI group.

References

    1. Takaori K, Nakamura J, Yamamoto S, Nakata H, Sato Y, Takase M. et al. Severity and Frequency of Proximal Tubule Injury Determines Renal Prognosis. Journal of the American Society of Nephrology: JASN. 2016;27:2393–406. - PMC - PubMed
    1. Maekawa H, Inagi R. Stress Signal Network between Hypoxia and ER Stress in Chronic Kidney Disease. Frontiers in physiology. 2017;8:74. - PMC - PubMed
    1. Almanza A, Carlesso A, Chintha C, Creedican S, Doultsinos D, Leuzzi B. et al. Endoplasmic reticulum stress signalling - from basic mechanisms to clinical applications. The FEBS journal. 2019;286:241–78. - PMC - PubMed
    1. Cybulsky AV. Endoplasmic reticulum stress, the unfolded protein response and autophagy in kidney diseases. Nature reviews Nephrology. 2017;13:681–96. - PubMed
    1. Shu S, Zhu J, Liu Z, Tang C, Cai J, Dong Z. Endoplasmic reticulum stress is activated in post-ischemic kidneys to promote chronic kidney disease. EBioMedicine. 2018;37:269–80. - PMC - PubMed

MeSH terms