. 2024 Feb 25;20(5):1796-1814.
doi: 10.7150/ijbs.91396. eCollection 2024.

Carbonic Anhydrase 3 is required for cardiac repair post myocardial infarction via Smad7-Smad2/3 signaling pathway

Affiliations

Carbonic Anhydrase 3 is required for cardiac repair post myocardial infarction via Smad7-Smad2/3 signaling pathway

Yuanyuan Su et al. Int J Biol Sci. .

Abstract

Appropriate fibrosis is required to prevent subsequent adverse remodeling and heart failure post myocardial infarction (MI), and cardiac fibroblasts (CFs) play a critical role during the process. Carbonic anhydrase 3 (CAR3) is an important mediator in multiple biological processes besides its CO2 hydration activity; however, the role and underlying mechanism of CAR3 on cardiac repair post MI injury remains unknown. Here, we found that CAR3 expression was up-regulated in cardiac tissue in infarct area at the reparative phase of MI, with a peak at 7 days post MI. The upregulation was detected mainly on fibroblast instead of cardiomyocyte, and primary cardiac fibroblasts treated with TGF-β1 recaptured our observation. While CAR3 deficiency leads to weakened collagen density, enlarged infarct size and aggravated cardiac dysfunction post-MI. In fibroblast, we observed that CAR3 deficiency restrains collagen synthesis, cell migration and gel contraction of cardiac fibroblasts, whereas overexpression of CAR3 in CFs improves wound healing and cardiac fibroblast activation. Mechanistically, CAR3 stabilizes Smad7 protein via modulating its acetylation, which dampens phosphorylation of Smad2 and Smad3, thus inhibiting fibroblast transformation. In contrast, inhibition of Smad7 acetylation with C646 blunts CAR3 deficiency induced suppression of fibroblast activation and impaired cardiac healing. Our data demonstrate a protective role of CAR3 in cardiac wound repair post MI via promoting fibroblasts activation through Smad7-TGF-β/Smad2/3 signaling pathway.

Keywords: CAR3; Smad7 acetylation; cardiac repair; fibroblast activation; myocardial infarction.


Conflict of interest statement

Competing Interests: The authors have declared that no competing interest exists.

Figures
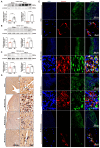
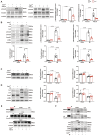
Figure 1
Figure 1
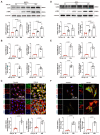
CAR3 expression is increased at the infarct area in response to myocardial infarction. A, Expression of CAR3 was measured using Western blot analysis (n = 12-13 mice per group) and RT q‐PCR (n = 6 mice per group) in the infarct area of WT mice at day 7 post-MI as well as in sham control. Results were normalized against α-tubulin and converted to fold induction relative to sham‐operated mice. B, CAR3 level was determined by Western blot analysis (n = 9 mice per group) and RT q‐PCR (n = 6 mice per group) in the border area of MI-operated hearts and their sham controls. Corresponding statistic of CAR3 was shown. C, CAR3 level was determined by Western blot analysis (n = 8-9 mice per group) and RT q‐PCR (n = 6 mice per group) in the remote area of MI-operated hearts and their sham controls. Corresponding statistic of CAR3 was shown. D, Immunohistochemistry for cardiac fibroblast CAR3 was indicated by black arrows in the sham or MI-operated heart tissue (n = 4 samples per group, the left scale bar =500 μm, the right scale bar =25 μm). E, Immunofluorescence co-staining for vimentin with CAR3 and DAPI in cardiac fibroblasts was shown by white arrows in the heart of WT mice at day 7 post-MI (n = 4 samples per group, the upper scale bar =500 μm, the lower scale bar =25 μm). CAR3 was labeled in green. vimentin was labeled in red. Nuclei stained with DAPI were blue. The data are expressed as mean ± SEM. The data shown in A-C were analyzed by Student's t-test. CAR3, Carbonic anhydrase 3; RT q‐PCR, real‐time quantitative polymerase chain reaction; WT, wild type; MI, myocardial infarction; DAPI, 4'6-diamidino-2-phenylindole; MI-7d, 7 days post myocardial infarction.
Figure 2
Figure 2
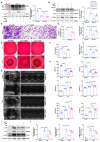
CAR3 level is up-regulated in TGF-β1-treated cardiac fibroblasts. A, Expression of CAR3 was determined using Western blot (n = 4-5 independent experiments per group) in TGF-β1‐treated NRCFs. Results were normalized against α-tubulin and converted to fold induction relative to control‐treated group. B, NRCFs were administrated by TGF-β1 or not for 24h. Relative mRNA expressions of Car3, Acta2, Col1A1and Col3A1 were examined by RT q‐PCR (n = 6 independent experiments per group). Corresponding statistics were shown. C, Representative CAR3 immunofluorescence images of NRCFs treated with TGF-β1 or Control. CAR3 was labeled in green. Fibroblast markers α-SMA and vimentin were labeled in red. Nuclei stained with DAPI were blue. Fluorescence intensity of CAR3 and α-SMA staining was determined and expressed as fold change relative to control group (n = 6 independent experiments per group, scale bar = 100 μm). D, CAR3 and α-SMA Western blot bands (n = 5 per group) were shown in ACFs after stimulation with TGF-β1 or control. Corresponding statistics of CAR3 and α-SMA were shown. E, Relative mRNA expressions of Car3, Acta2, Col1A1and Col3A1 were examined by RT q‐PCR (n = 6 per group) in ACFs treated by TGF-β1 for 24h. F, IF co-staining for α-SMA or vimentin with CAR3 and DAPI in TGF-β1-treated ACFs. Fluorescence intensity was measured and the results were presented as fold change against the corresponding controls (n = 6 independent experiments per group, scale bar = 100 μm). Data are expressed as mean ± SEM. The data shown in A and B were analyzed by one-way ANOVA followed by Bonferroni post hoc test. Data shown in B, C, E, and F were analyzed by Student's t-test. TGF-β1, transforming growth factor-β1; NRCFs, neonatal rat cardiac fibroblasts; α-SMA, α-smooth muscle actin; Acta2, actin alpha 2, smooth muscle, aorta; Col1A1, collagen type I alpha 1 chain; Col3A1, collagen type III alpha 1 chain; ACFs, adult mouse cardiac fibroblasts.
Figure 3
Figure 3
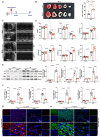
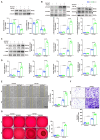
CAR3 deficiency impaired cardiac wounding healing and exacerbated cardiac dysfunction 7d after MI. A, Schematic protocol of the experimental approach. B, The infarct size of WT and Car3‐deficient mouse heart at 7 days after MI operation was determined by TTC staining and expressed as the percentage of infarct over ventricular area (n = 5 mice per group). C, Representative serial echocardiography via short axis acquired at 7d post-MI and relative quantifications (n = 8 mice per group). D, Cardiac function parameters, namely LVEF, LVFS, LVIDs, LVIDd, LVEDV, and LVESV were measured by echocardiography in indicated groups (n = 8 mice per group). E, Representative Western blot analysis and quantitative results of Col1, Col3, and α-SMA. Results were normalized against α-tubulin and converted to fold induction relative to their respective controls (n = 4-5 mice per group). F, Transcription levels of Col1A1, Col3A1, postn, and Acta2 were measured by RT q‐PCR in the cardiac infarcted tissues of the indicated groups (n = 6 mice per group). G, Representative micrographs of Col1 expression by immunofluorescence staining in the infarct size at day 7 post-MI (n = 4 mice per group, the upper scale bar =100 μm, the lower scale bar =20 μm). H, Representative images of Col3 expression by IF in the infarct area 7 days post-MI (n = 4 mice per group, the upper scale bar =100 μm, the lower scale bar =20 μm). Data are presented as mean ± SEM, by one-way ANOVA followed by Bonferroni post hoc test. TTC, Triphenyltetrazolium chloride staining; LVEF, left ventricular ejection fraction; LVFS, left ventricular fractional shortening; LVIDs, left ventricular end‐systolic diameter; LVIDd, left ventricular end‐diastolic diameter; LVEDV, left ventricular end-diastolic volume; LVESV, left ventricular end-systolic volume.
Figure 4
Figure 4
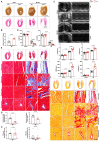
CAR3 deficiency enlarged infarct size and aggravated heart failure 28d post-MI. A, Representative pictures of the whole heart and HE staining of WT and Car3‐deficient mice after Sham or MI operation for 4 weeks (n = 6-7 mice per group). B, Infarct size was measured as the percentage of infarct over ventricular areas. C, Representative echocardiograms via short axis acquired from WT and Car3-knockout mice at 28 days after MI or sham operation and relative quantifications (n = 8 mice per group). D, Echocardiographic parameters of cardiac function, namely LVEF, LVFS, LVIDs, LVIDd, LVEDV, and LVESV, were measured in the indicated groups 4 weeks after MI (n = 8 mice per group). E, Representative photographs of Masson's trichrome staining in sections of hearts obtained from WT and Car3-deficient mice at day 28 after LAD ligation (n = 6-7 mice per group, the upper scale bar =2.5 mm, the lower scale bar =100 μm). F, Picrosirius red staining was performed to examine collagen density in the scar of different groups 4 weeks post-MI (n = 6-7 mice per group). G, Quantitative assessment of the ventricular wall thickness as well as the volume of collagen in the infarct area at 28d after MI (n=6-7 mice per group). H, Quantification of fibrotic areas in the border zone and remote zone at 28d post-MI in indicated groups (n=6-7 mice per group). The data are presented as mean ± SEM. B and D were analyzed by one-way ANOVA followed by Bonferroni post hoc test; G and H were analyzed by Student's t test.
Figure 5
Figure 5
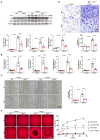
CAR3 deficiency weakened wound healing and cardiac fibroblasts activation in vitro. A, Western blot analysis and quantitative results of Col1, Col3, and α-SMA in ACFs treated with TGF-β1 for 24h isolated from WT and Car3-dificient mice. Results were normalized against α-tubulin and converted to fold induction relative to their respective controls (n = 5 independent experiments per group). B, RT q‐PCR was used to determine the transcription levels of Col1A1, Col3A1, postn, and Acta2 in the indicated groups (n = 6 independent experiments per group). C, The migratory capacity of fibroblasts from WT and Car3-dificient mice respectively was assessed by the covering area of the scratch after administration with TGF-β1 for 24 h (n = 4 independent experiments per group, scale bar = 500 μm). D, Representative images of transwell assay after stimulation with TGF-β1 for 24h (n = 5 independent experiments per group, scale bar = 200 μm). E, Representative experiments of collagen gel contraction assay were investigated at different time points (n = 6 independent experiments per group, scale bar = 5 mm). Data are presented as mean ± SEM. The data shown in A-D were analyzed by one-way ANOVA followed by Bonferroni post hoc test. E was analyzed by two-way ANOVA followed by Bonferroni post hoc test.
Figure 6
Figure 6
CAR3 deficiency inhibited the activation of TGF-β-Smad2/3 signaling pathway via mediating the stability of Smad7. A, Western blot analysis and statistical results of the levels of phosphorylated Smad2 and Smad3 in ACFs treated with TGF-β1 for 6h were examined and shown (n = 4 per group). B, Protein levels of phosphorylated Smad2 and Smad3 as well as Col1, Col3 and α-SMA were determined by Western blot (n = 4‐5 mice per group) in the infarcted heart of MI‐treated mice. C, Expression of Smad7 was measured using Western blot and RT q‐PCR (n = 4‐5 independent experiments per group) in cultured ACFs from WT and Car3-deficient mice 6h after TGF-β1 treatment. Results were normalized against α-tubulin and converted to fold induction relative to control‐treated group. D, Representative Western blots and statistical results of Smad7 in the infarct zone 7d post-MI (n = 5 mice per group). mRNA level of Smad7 was detected by RT q‐PCR in the indicated groups (n = 5 mice per group). E, Interaction of CAR3 with Smad7 in cultured ACFs of different groups was determined by immunoprecipitation with anti-CAR3 antibody followed by immunoblot with anti-Smad7 antibody. Following immunoprecipitation of Smad7, the acetylation of Smad7 was detected with anti-acetylated lysine antibody (Acy-K). IgG as a negative control (n = 3). F, Co-immunoprecipitation and Western blots of interaction of CAR3 with Smad7 and the change of Smad7 acetylation in infarcted heart tissues. IgG as a negative control (n = 3). The data are shown as the means ± SEM. The data shown in A, B, C, and D were analyzed by one-way ANOVA followed by Bonferroni post hoc test. Acy-K, acetylated lysine.
Figure 7
Figure 7
C646-pretreatment reversed CAR3 deficiency induced suppression of fibroblasts activation in vitro and impairment of cardiac healing and cardiac dysfunction in vivo. A, WT, Car3-knockout, or C646-preincubated Car3-knockout ACFs were stimulated with TGF-β1 for 6 h. Expressions of Smad7 and its acetylation were determined using Western blot (n = 4 independent experiments per group). B, ACFs were preincubated with DMSO or C646 followed by treatment with TGF-β1 for 24 h. Protein levels of Col1, Col3, and α-SMA were detected by Western blot (n = 4 per group). C, Representative images of transwell assay in indicated groups (n = 4 independent experiments per group, scale bar = 200 μm). D, Quantitative results for the migration capacity were measured. E, Representative experiments of collagen gel contraction assay in ACFs preincubated with DMSO or C646 followed by TGF-β1 treatment (n = 4 independent experiments per group, scale bar = 5 mm). F, Quantitative results for collagen gel contraction ability in indicated groups. G, WT, Car3-knockout, or C646-pretreated Car3-knockout mice were followed to induce mouse MI model. Representative serial echocardiography acquired by short axis at 7d post-MI and relative quantifications (n = 8 mice per group). H, Cardiac function parameters (LVEF, LVFS, LVIDs, LVIDd, LVEDV, and LVESV) were measured by echocardiography in indicated groups (n = 8 mice per group). I, Representative Western blot analysis (n = 4 mice per group) and quantitative results of Col1, Col3, and α-SMA. J, Statistical results of Col1, Col3, and α-SMA in the infarct zone 7d post-MI. Data are presented as mean ± SEM, by one-way ANOVA followed by Bonferroni post hoc test. DMSO, Dimethyl sulfoxide.
Figure 8
Figure 8
CAR3 overexpression promoted cardiac fibroblasts activation and wound healing in vitro. A, ACFs isolated from WT mice were infected with Adv-Car3 (Ad.Car3) or Adv-GFP (Ad.G) for 48 h before the cells were treated with TGF-β1 for 6 h. Expression of Smad7 was determined using Western blot and RT q‐PCR (n = 4‐5 independent experiments per group). B, Expression level of phosphorylated Smad2 and Smad3 in ACFs were examined by Western blot. Corresponding statistics were shown (n = 4 per group). C, ACFs were infected with Adv-Car3 or Adv-GFP for 48 h followed by treatment with TGF-β1 for 24 h. Protein levels of Col1, Col3, and α-SMA and statistical results were detected by Western blot (n = 4 per group). D, The transcription levels of Col1A1, Col3A1, postn, and Acta2 were determined by RT q‐PCR in the indicated groups (n = 4 per group). E, Quantitative results for the migration ability of ACFs in indicated groups was measured by the covering area of the scratch (n = 5 independent experiments per group, scale bar = 500 μm). F, Representative images of transwell assay in ACFs transduced with Adv-Car3 or Adv-GFP for 48 hours followed by TGF-β1 treatment (n = 5-6 independent experiments per group, scale bar = 200 μm). G, Collagen gel contraction assay was carried out to test the contraction capacity of ACFs after 36h administration with TGF-β1 in indicated groups (n = 6 independent experiments per group, scale bar = 5 mm). Data are presented as mean ± SEM, by one-way ANOVA followed by Bonferroni post hoc test. GFP, green fluorescent protein.
Figure 9
Figure 9
Schematic diagram depicting the role of CAR3 in cardiac repair post MI. CAR3 deficiency aggravated infarct size enlargement and cardiac dysfunction after myocardial infarction through inhibition of cardiac fibroblasts transformation. Mechanistically, CAR3 promotes fibroblast transformation by TGF-β-Smad2/3 signaling via repressing acetylation of inhibitory Smad7, which ultimately improves timely cardiac repair post MI.

Similar articles

Cited by

References

    1. Tsao CW, Aday AW, Almarzooq ZI, Alonso A, Beaton AZ, Bittencourt MS. et al. Heart Disease and Stroke Statistics-2022 Update: A Report From the American Heart Association. Circulation. 2022;145:e153–e639. - PubMed
    1. Vaduganathan M, Mensah GA, Turco JV, Fuster V, Roth GA. The Global Burden of Cardiovascular Diseases and Risk: A Compass for Future Health. J Am Coll Cardiol. 2022;80:2361–2371. - PubMed
    1. Mensah GA, Roth GA, Fuster V. The Global Burden of Cardiovascular Diseases and Risk Factors: 2020 and Beyond. J Am Coll Cardiol. 2019;74:2529–2532. - PubMed
    1. Niccoli G, Montone RA, Ibanez B, Thiele H, Crea F, Heusch G. et al. Optimized Treatment of ST-Elevation Myocardial Infarction. Circ Res. 2019;125:245–258. - PubMed
    1. Prabhu SD, Frangogiannis NG. The Biological Basis for Cardiac Repair After Myocardial Infarction: From Inflammation to Fibrosis. Circ Res. 2016;119:91–112. - PMC - PubMed

MeSH terms