. 2024 Mar 13;11(3):231514.
doi: 10.1098/rsos.231514. eCollection 2024 Mar.

Soundscape enrichment increases larval settlement rates for the brooding coral Porites astreoides

Affiliations

Soundscape enrichment increases larval settlement rates for the brooding coral Porites astreoides

Nadège Aoki et al. R Soc Open Sci. .

Abstract

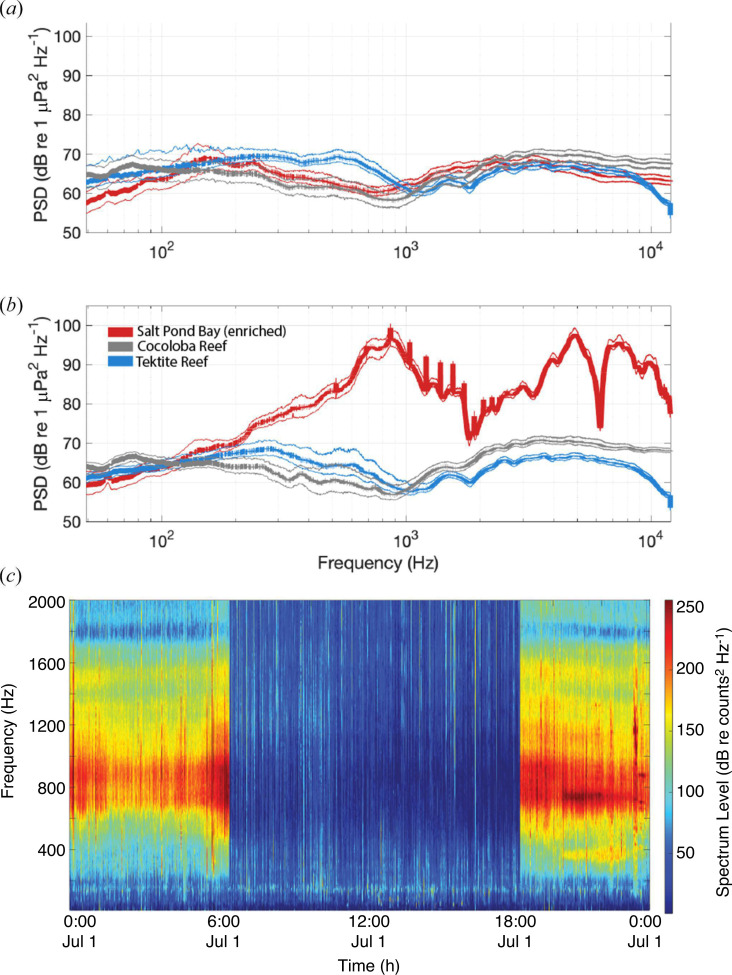
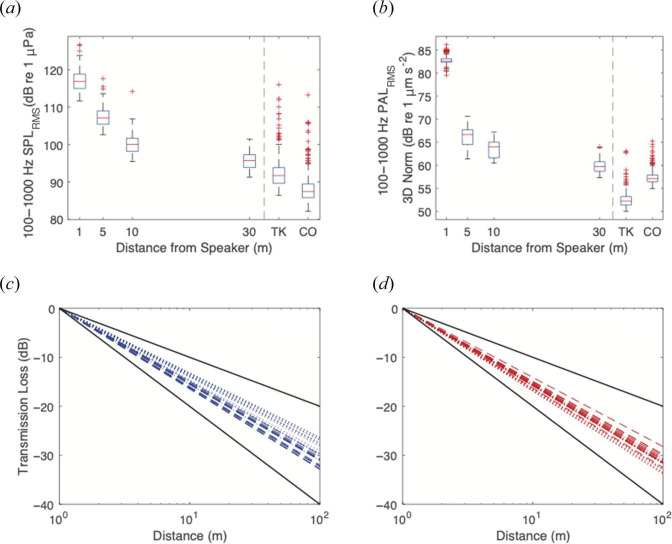
Coral reefs, hubs of global biodiversity, are among the world's most imperilled habitats. Healthy coral reefs are characterized by distinctive soundscapes; these environments are rich with sounds produced by fishes and marine invertebrates. Emerging evidence suggests these sounds can be used as orientation and settlement cues for larvae of reef animals. On degraded reefs, these cues may be reduced or absent, impeding the success of larval settlement, which is an essential process for the maintenance and replenishment of reef populations. Here, in a field-based study, we evaluated the effects of enriching the soundscape of a degraded coral reef to increase coral settlement rates. Porites astreoides larvae were exposed to reef sounds using a custom solar-powered acoustic playback system. Porites astreoides settled at significantly higher rates at the acoustically enriched sites, averaging 1.7 times (up to maximum of seven times) more settlement compared with control reef sites without acoustic enrichment. Settlement rates decreased with distance from the speaker but remained higher than control levels at least 30 m from the sound source. These results reveal that acoustic enrichment can facilitate coral larval settlement at reasonable distances, offering a promising new method for scientists, managers and restoration practitioners to rebuild coral reefs.

Keywords: acoustic playback; coral reefs; hearing; marine invertebrates; recruitment; restoration.


Conflict of interest statement

We declare we have no competing interests.

Figures

Figure 1.
Figure 1.
Overview of experimental coral reef sites. (a) Map of St John, USVI with experimental sites within the Virgin Islands National Park (Cocoloba, Tektite and Salt Pond) marked. White circles denote control sites and black circle denotes experimental playback site. (b–d) Images and per cent coverage of major benthic substrate categories observed at each site: algae, hard coral and other (e.g. sand, rock and soft coral).
Figure 2.
Figure 2.
Overview of experimental set-up and study species. (a) Schematic of larval sound playback set-up. On the right, the RAPS is depicted with its benthic speaker mounted on a cinderblock and attached by a line to the surface buoy. Cups of larvae are illustrated and attached to stakes at progressive distances from the sound source. (b) RAPS speaker was photographed facing a rebar stake with attached cups of larvae and an orthogonal four-hydrophone recording array both placed 1 m from the speaker. (c) View of RAPS surface buoy including waterproof electronics housing and mounted solar panel. (d) Porites astreoides planktonic larva. (e) Settled P. astreoides larva on clay stilt.
Figure 3.
Figure 3.
Natural and enriched soundscape features of the experimental sites. (a) PSDs of pressure values were recorded at the three reefs between 6.00 and 18.00 while no speaker was playing and only natural reef sounds were present (spectra calculated from recorders 1 m from source). (b) PSDs of pressure values were recorded at the three reefs between 18.00 and 6.00 while the speaker was playing only at Salt Pond (spectra calculated from recorders 1 m from source). (c) Long-term spectral average (LTSA) showing the low-frequency sound content of the Salt Pond soundscape 1 m from the speaker over a single 24-h period of the playback experiment (non-overlapping 5 s Hanning windows, nfft size = 4800). This LTSA was generated from uncalibrated pressure data using the Triton software package (Scripps Institution of Oceanography) for visualization purposes.
Figure 4.
Figure 4.
Results of acoustic enrichment experiment. Larval settlement rates per cup are shown from all distances and grouped by site for (a) June 2022 experiment, (b) July 2022 experiment and (c) combined data from both months. ANOVA significance codes: ***p < 0.001, **p <0.01, *p < 0.05.
Figure 5.
Figure 5.
Propagation of the acoustic playback signal. (a) Boxplots of low-frequency RMS SPL were recorded at 1, 5, 10 and 30 m from the RAPS speaker at Salt Pond during a 12-h overnight acoustic playback period. Ambient values of SPLRMS for Tektite and Cocoloba recorded throughout the July 3-day experimental period are shown to the right of the vertical dashed line. (b) Boxplots of PALRMS values calculated from the three-dimensional pressure data at Salt Pond, same times or locations as (a). (c, d) TL calculated from Salt Pond SPLRMS (c) and PALRMS (d) values averaged hourly from two 12-h overnight calibration periods. Dashed lines are fitted to June’s calibration data, dotted lines are fitted to July’s data. Black lines represent two theoretical models for underwater TL: cylindrical (loss coefficient = 10) and spherical (loss coefficient = 20) spreading.
Figure 6.
Figure 6.
Larval settlement results grouped by distance and duration of exposure. Error bars = ±1 standard error. (a) Mean per-cup settlement at Salt Pond (red, circle), Tektite (blue, diamond) and Cocoloba (grey, square) graphed by distance from the speaker. Each data point corresponds to an average of between two and four cups of larvae. (b) Mean per-cup settlement at the three experimental sites graphed by time. Sample sizes for the 24- and 48-h time points were n = 2 cups of larvae per site. Sample sizes for the 72-h time point were n = 12 cups (Salt Pond), n = 14 (Cocoloba) and n = 12 (Tektite).

References

    1. Woodhead AJ, Hicks CC, Norström AV, Williams GJ, Graham NAJ, Fox C. 2019. Coral reef ecosystem services in the anthropocene. Funct. Ecol. 33, 1023–1034. (10.1111/1365-2435.13331) - DOI
    1. Hughes TP, et al. . 2003. Climate change, human impacts, and the resilience of coral reefs. Science 301, 929–933. (10.1126/science.1085046) - DOI - PubMed
    1. Hughes TP, et al. . 2017. Coral reefs in the Anthropocene. Nature 546, 82–90. (10.1038/nature22901) - DOI - PubMed
    1. Pratchett MS, Hoey AS, Wilson SK, Messmer V, Graham NAJ. 2011. Changes in biodiversity and functioning of reef fish assemblages following coral bleaching and coral loss. Diversity 3, 424–452. (10.3390/d3030424) - DOI
    1. Glynn PW, Manzello DP. 2015. Bioerosion and coral Reef growth: a dynamic balance. In Coral reefs in the anthropocene (ed. Birkeland C), pp. 67–97, New York: Springer. (10.1007/978-94-017-7249-5) - DOI

LinkOut - more resources