. 2024 Feb 21;1(3):200-222.
doi: 10.1021/acsestair.3c00076. eCollection 2024 Mar 8.

Overview of the Alaskan Layered Pollution and Chemical Analysis (ALPACA) Field Experiment

William R Simpson  1   2 Jingqiu Mao  1   2 Gilberto J Fochesatto  3 Kathy S Law  4 Peter F DeCarlo  5 Julia Schmale  6 Kerri A Pratt  7   8 Steve R Arnold  9 Jochen Stutz  10 Jack E Dibb  11 Jessie M Creamean  12 Rodney J Weber  13 Brent J Williams  14   15 Becky Alexander  16 Lu Hu  17 Robert J Yokelson  17 Manabu Shiraiwa  18 Stefano Decesari  19 Cort Anastasio  20 Barbara D'Anna  21 Robert C Gilliam  22 Athanasios Nenes  23   24 Jason M St Clair  25 Barbara Trost  26 James H Flynn  27 Joel Savarino  28 Laura D Conner  1 Nathan Kettle  29 Krista M Heeringa  29 Sarah Albertin  4   28 Andrea Baccarini  6 Brice Barret  30 Michael A Battaglia  13 Slimane Bekki  4 T J Brado  31 Natalie Brett  4 David Brus  32 James R Campbell  1   2 Meeta Cesler-Maloney  1   2 Sol Cooperdock  10 Karolina Cysneiros de Carvalho  14 Hervé Delbarre  33 Paul J DeMott  12 Conor J S Dennehy  34 Elsa Dieudonné  33 Kayane K Dingilian  13 Antonio Donateo  35 Konstantinos M Doulgeris  32 Kasey C Edwards  18 Kathleen Fahey  22 Ting Fang  18   36 Fangzhou Guo  27 Laura M D Heinlein  20 Andrew L Holen  7 Deanna Huff  37 Amna Ijaz  21 Sarah Johnson  10 Sukriti Kapur  18 Damien T Ketcherside  17 Ezra Levin  38 Emily Lill  12 Allison R Moon  16 Tatsuo Onishi  4 Gianluca Pappaccogli  35 Russell Perkins  12 Roman Pohorsky  6 Jean-Christophe Raut  4 Francois Ravetta  4 Tjarda Roberts  39 Ellis S Robinson  5 Federico Scoto  35 Vanessa Selimovic  7   17 Michael O Sunday  20 Brice Temime-Roussel  21 Xinxiu Tian  5 Judy Wu  7 Yuhan Yang  13
Affiliations

Overview of the Alaskan Layered Pollution and Chemical Analysis (ALPACA) Field Experiment

William R Simpson et al. ACS EST Air. .

Abstract

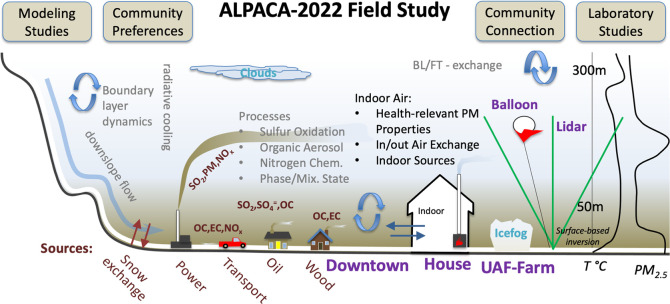
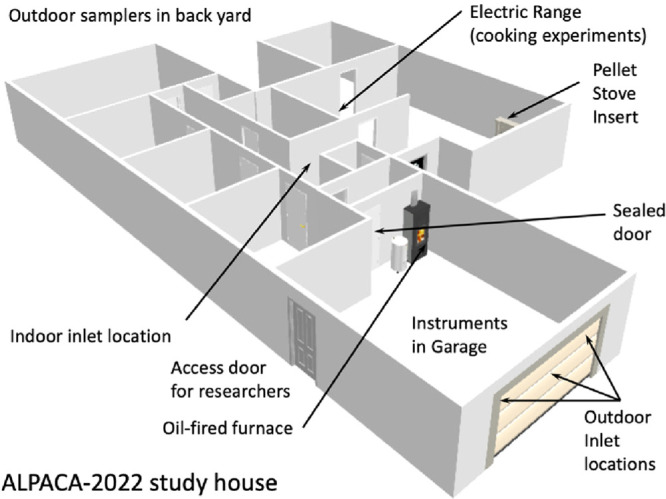
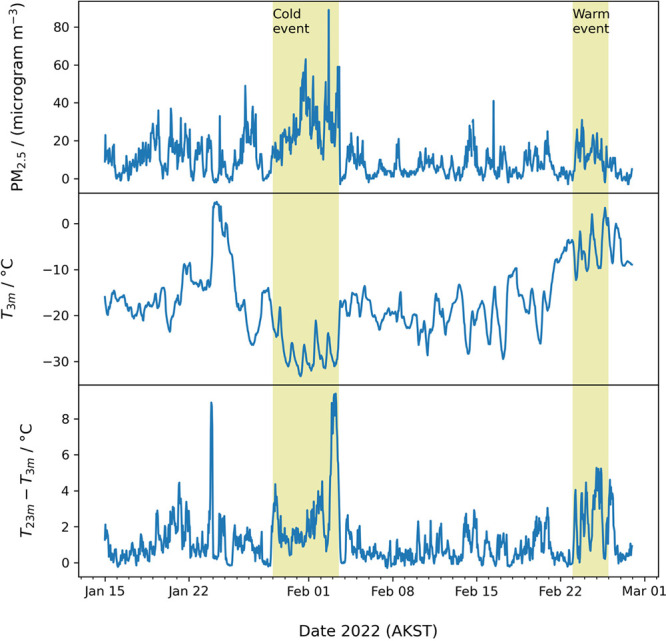
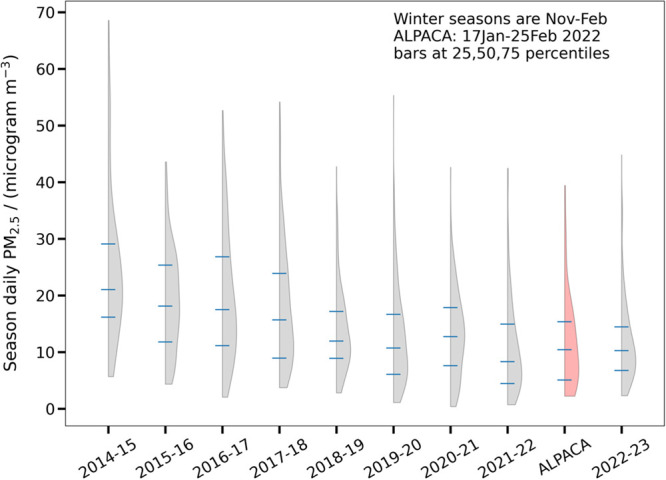
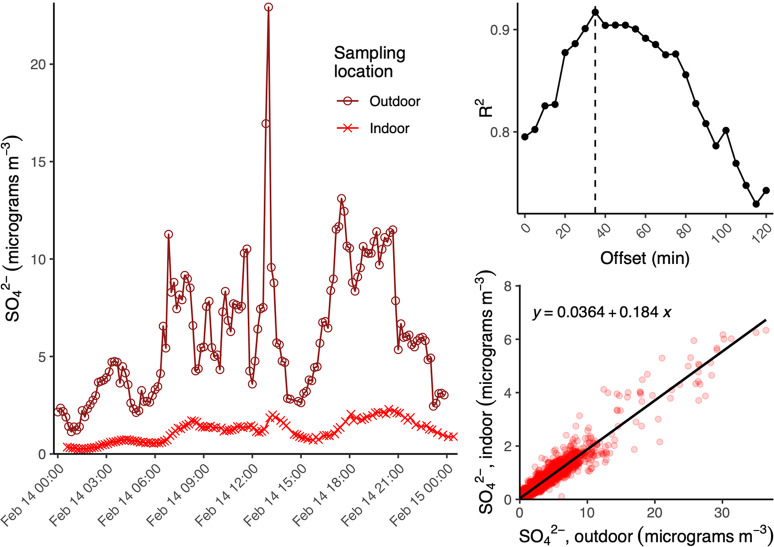
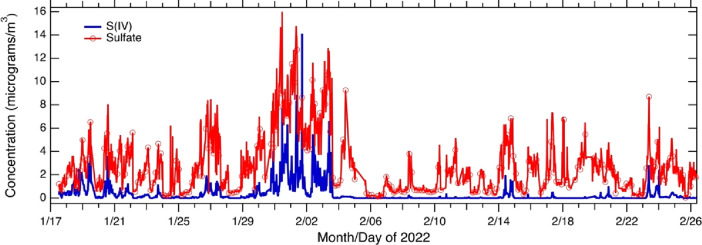
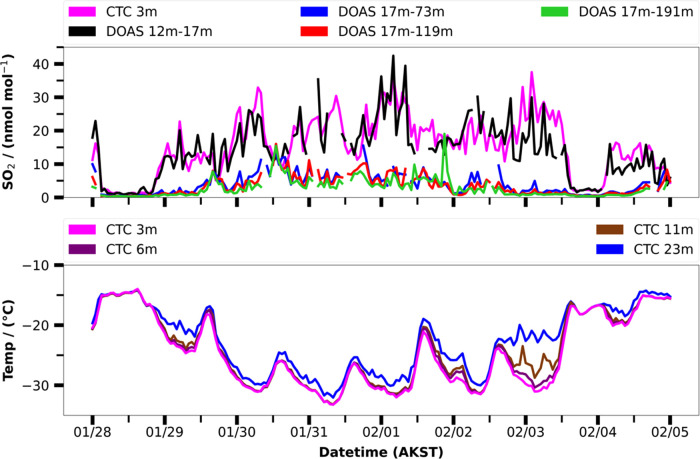
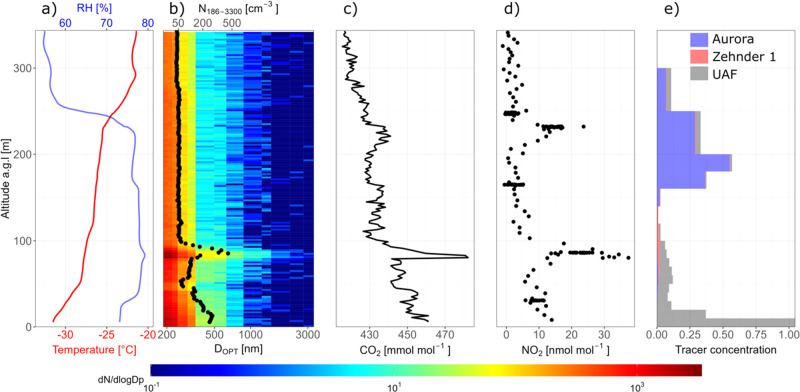
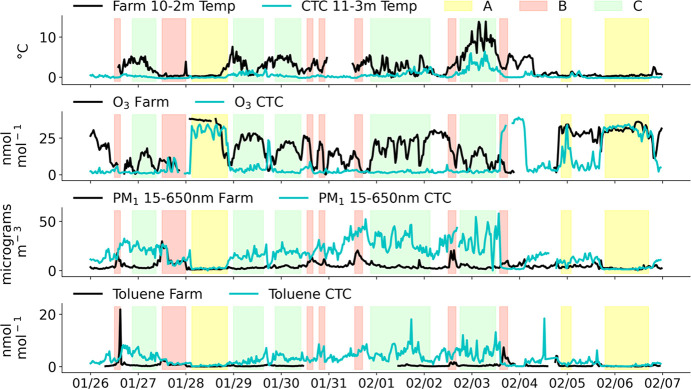
The Alaskan Layered Pollution And Chemical Analysis (ALPACA) field experiment was a collaborative study designed to improve understanding of pollution sources and chemical processes during winter (cold climate and low-photochemical activity), to investigate indoor pollution, and to study dispersion of pollution as affected by frequent temperature inversions. A number of the research goals were motivated by questions raised by residents of Fairbanks, Alaska, where the study was held. This paper describes the measurement strategies and the conditions encountered during the January and February 2022 field experiment, and reports early examples of how the measurements addressed research goals, particularly those of interest to the residents. Outdoor air measurements showed high concentrations of particulate matter and pollutant gases including volatile organic carbon species. During pollution events, low winds and extremely stable atmospheric conditions trapped pollution below 73 m, an extremely shallow vertical scale. Tethered-balloon-based measurements intercepted plumes aloft, which were associated with power plant point sources through transport modeling. Because cold climate residents spend much of their time indoors, the study included an indoor air quality component, where measurements were made inside and outside a house to study infiltration and indoor sources. In the absence of indoor activities such as cooking and/or heating with a pellet stove, indoor particulate matter concentrations were lower than outdoors; however, cooking and pellet stove burns often caused higher indoor particulate matter concentrations than outdoors. The mass-normalized particulate matter oxidative potential, a health-relevant property measured here by the reactivity with dithiothreiol, of indoor particles varied by source, with cooking particles having less oxidative potential per mass than pellet stove particles.


Conflict of interest statement

The authors declare no competing financial interest.

Figures

Figure 1
Figure 1
Schematic design of the ALPACA 2022 field study. Main questions and processes investigated are shown along with field sites. Boxes at the top represent broader ALPACA project activities connected with the field study. Community connections are outreach and education, while surveys were used to probe community preferences.
Figure 2
Figure 2
Map of Fairbanks, Alaska showing key field sites, power plants, and ADEC air monitoring stations used in the ALPACA 2022 study. See text for geolocation. The dark shading shows hills surrounding Fairbanks, and the lines from downtown to Birch Hill are the LP-DOAS light paths.
Figure 3
Figure 3
A 3-D rendering of the house’s plan showing locations of inlets (in the main house and outside the garage) and key indoor sources (cook stove, pellet stove). As discussed in the text, most instruments were located in the garage and automated switching valves alternately sampled from indoor or outdoor inlets.
Figure 4
Figure 4
Hourly particulate pollution (PM2.5) measured at NCore by ADEC, temperature at 3 m AGL, and temperature inversion strength, represented by a temperature difference between 23 m and 3 m (temperatures measured at CTC), encountered during the ALPACA 2022 field study. Contrasting cold and warm pollution episodes are identified as discussed in the text.
Figure 5
Figure 5
Probability density distributions of daily average particulate matter concentrations (PM2.5) from NCore (ADEC/EPA measurements) during recent winters (November of the first year to end of February of the second year listed). The red figure shows the distribution during the ALPACA field study, a subset of the 2021–2022 winter season’s data. Bars within each distribution represent the first quartile, median, and third quartile of the distribution.
Figure 6
Figure 6
Indoor and outdoor PM sulfate as measured by the JHU HR-AMS at the house site. Date times are in AKST. The left panel shows the time series of sulfate, bottom right shows the correlation between indoor and outdoor PM sulfate, and the top-right shows the degree of correlation (R2) for a lagged correlation between indoor and outdoor PM sulfate observations.
Figure 7
Figure 7
PILS-IC measurements of PM2.5 sulfate and S(IV) measured at the CTC site. The IC separation resolves sulfate from S(IV) species (sulfite, bisulfite, and organo-sulfite adducts such as hydroxymethanesulfonate, HMS), which co-elute. HMS is a component of the S(IV) species. Note that the ratio of S(IV) to sulfate varies in time, being high in the cold event (late January/early February), but low in the warm event in late February.
Figure 8
Figure 8
Vertical profiling of SO2 gas (averaged over the specified altitude interval) by the UCLA LP-DOAS, in-situ SO2 measurement at 3 m AGL and temperature measured between 3 and 23 m during the cold polluted event. The strength of the surface-based inversion can be visualized at the difference in temperature between 23 m and 3 m, which peaks at night, particularly during 1–3 January 2022.
Figure 9
Figure 9
Helikite profile of the vertical structure of the atmosphere from 09:50 to 10:35 AKST on January 30, 2022. (a–d) Temperature, RH, particle counts, and CO2 are part of the Helikite measurement payload, and NO2 was measured with the LAERO-CNRS (CASPA) MicroMegas package. The right-most panel (e) shows power plant tracer forecasts for January 30, 2022 as a function of altitude at the UAF Farm site. On this day, tracers originating from the UAF and Aurora power plants, along with a small contribution from Zehnder power plant were forecast to arrive over the UAF Farm site. See text for details.
Figure 10
Figure 10
Comparison of near-surface temperature difference over 8 m vertical difference (SBI strength), ozone, PM, and toluene at the UAF-Farm site and the downtown CTC site. Periods labeled “A” are cleaner periods, “B” are periods of outflow from downtown to the UAF-Farm, and “C” periods are more stagnant and have greater pollution downtown. Toluene was measured using LCE (France) CHARON PTR-ToF-MS at CTC and CNR (Italy) miniCG Pyxis BTEX at the UAF-Farm.

References

    1. Schmale J.; Arnold S. R.; Law K. S.; Thorp T.; Anenberg S.; Simpson W. R.; Mao J.; Pratt K. A. Local Arctic Air Pollution: A Neglected but Serious Problem. Earths Future 2018, 6, 1385–1412. 10.1029/2018EF000952. - DOI
    1. Arnold S. R.; Law K. S.; Brock C. A.; Thomas J. L.; Starkweather S. M.; Von Salzen K.; Stohl A.; Sharma S.; Lund M. T.; Flanner M. G.; Petäjä T.; Tanimoto H.; Gamble J.; Dibb J. E.; Melamed M.; Johnson N.; Fidel M.; Tynkkynen V.-P.; Baklanov A.; Eckhardt S.; Monks S. A.; Browse J.; Bozem H. Arctic Air Pollution: Challenges and Opportunities for the next Decade. Elem. Sci. Anthr. 2016, 4, 000104 10.12952/journal.elementa.000104. - DOI
    1. Alaskan Layered Pollution And Chemical Analysis (ALPACA) White Paper; ALPACA: Fairbanks, Alaska, 2018.
    1. Bohnenstengel S. I.; Belcher S. E.; Aiken A.; Allan J. D.; Allen G.; Bacak A.; Bannan T. J.; Barlow J. F.; Beddows D. C. S.; Bloss W. J.; Booth A. M.; Chemel C.; Coceal O.; Di Marco C. F.; Dubey M. K.; Faloon K. H.; Fleming Z. L.; Furger M.; Gietl J. K.; Graves R. R.; Green D. C.; Grimmond C. S. B.; Halios C. H.; Hamilton J. F.; Harrison R. M.; Heal M. R.; Heard D. E.; Helfter C.; Herndon S. C.; Holmes R. E.; Hopkins J. R.; Jones A. M.; Kelly F. J.; Kotthaus S.; Langford B.; Lee J. D.; Leigh R. J.; Lewis A. C.; Lidster R. T.; Lopez-Hilfiker F. D.; McQuaid J. B.; Mohr C.; Monks P. S.; Nemitz E.; Ng N. L.; Percival C. J.; Prévôt A. S. H.; Ricketts H. M. A.; Sokhi R.; Stone D.; Thornton J. A.; Tremper A. H.; Valach A. C.; Visser S.; Whalley L. K.; Williams L. R.; Xu L.; Young D. E.; Zotter P. Meteorology, Air Quality, and Health in London: The ClearfLo Project. Bull. Am. Meteorol. Soc. 2015, 96 (5), 779–804. 10.1175/BAMS-D-12-00245.1. - DOI
    1. Womack C. C.; McDuffie E. E.; Edwards P. M.; Bares R.; de Gouw J. A.; Docherty K. S.; Dube W. P.; Fibiger D. L.; Franchin A.; Gilman J. B.; Goldberger L.; Lee B. H.; Lin J. C.; Long R.; Middlebrook A. M.; Millet D. B.; Moravek A.; Murphy J. G.; Quinn P. K.; Riedel T. P.; Roberts J. M.; Thornton J. A.; Valin L. C.; Veres P. R.; Whitehill A. R.; Wild R. J.; Warneke C.; Yuan B.; Baasandorj M.; Brown S. S. An Odd Oxygen Framework for Wintertime Ammonium Nitrate Aerosol Pollution in Urban Areas: NOx and VOC Control as Mitigation Strategies. Geophys. Res. Lett. 2019, 46 (9), 4971–4979. 10.1029/2019GL082028. - DOI