. 2024 Feb 29;13(2):515-524.
doi: 10.21037/tcr-23-1277. Epub 2024 Feb 20.

Development and validation of a nomogram to predict overall survival of conjunctival melanoma: a population-based study

Affiliations

Development and validation of a nomogram to predict overall survival of conjunctival melanoma: a population-based study

Yuan Peng et al. Transl Cancer Res. .

Abstract

Background: Conjunctival melanoma (CM) is a rare, invasive tumor in the eye that readily metastasizes and spreads. Based on some significant clinicopathological information, we aimed to develop a prognostic model to predict the overall survival (OS) of CM patients.

Methods: Data of patients diagnosed with CM from 2000 to 2019 were identified from the Surveillance, Epidemiology, and End Results (SEER) database. Significant prognostic factors were extracted and integrated based on competing risk regression to build a nomogram. Harrell's concordance index (C-index), receiver operating characteristic (ROC) curve, and calibration plots were used to evaluate the performance of the nomogram.

Results: The study included 272 patients with CM, with a median age of 63 years. A nomogram was developed using age and tumor-node-metastasis (TNM) stage as variables. The model's C-index was 0.755, and the area under the curve (AUC) was 0.774, 0.812, and 0.815 at 5, 8, and 10 years, respectively. The calibration plot used to predict CM demonstrated good consistency between the predicted OS probability and the actual OS probability.

Conclusions: We have developed a nomogram model to predict the OS of patients with CM, which can predict the survival of these patients. The model's prognostic value is higher than that of the American Joint Committee on Cancer (AJCC) staging system alone. This tool can help evaluate the tumor-specific prognosis, identify patients at high risk of cancer-specific death, and guide clinical decision-making.

Keywords: Conjunctival melanoma (CM); Surveillance, Epidemiology, and End Results (SEER); nomogram; overall survival (OS); prognosis.


Conflict of interest statement

Conflicts of Interest: All authors have completed the ICMJE uniform disclosure form (available at https://tcr.amegroups.com/article/view/10.21037/tcr-23-1277/coif). The authors have no conflicts of interest to declare.

Figures
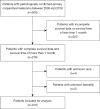
Figure 1
Figure 1
Flow chart of cases selection from SEER database. SEER, Surveillance, Epidemiology, and End Results.
Figure 2
Figure 2
Kaplan-Meier curve showing OS rates in the overall patient population (n=272). OS, overall survival.
Figure 3
Figure 3
Prognostic nomogram predicting the probability of 5-, 8-, and 10-year OS in patients with CM. The total scores of independent prognostic factors projected to the bottom scale represent the probabilities of 5-, 8-, and 10-year OS. Y, year; OS, overall survival; CM, conjunctival melanoma.
Figure 4
Figure 4
Validation of the nomogram. (A) ROC curves to verify accurate predictability for 5-year OS. (B) ROC curves to verify accurate predictability for 8-year OS. (C) ROC curves to verify accurate predictability for 10-year OS. (D) Comparing the AUC of the nomogram and the AUC of the TNM stage. AUC, area under the curve; TNM, tumor-node-metastasis; ROC, receiver operating characteristic; OS, overall survival.
Figure 5
Figure 5
Calibration plot comparing predicted and actual survival probabilities: (A) at 5-year follow-up; (B) at 8-year follow-up; (C) at 10-year follow-up. The Y-axis represents the actual OS. The X-axis represents the predicted OS. The diagonal dotted line represents a perfect prediction by an ideal model. The red solid line represents the performance of the model, of which a closer fit to the diagonal dotted line represents a better prediction. The blue bar represents standard deviation. OS, overall survival; y, year.
Figure 6
Figure 6
OS rates of high- and low-risk groups. OS, overall survival.

References

    1. Kaštelan S, Gverović Antunica A, Beketić Orešković L, et al. Conjunctival Melanoma - Epidemiological Trends and Features. Pathol Oncol Res 2018;24:787-96. 10.1007/s12253-018-0419-3 - DOI - PubMed
    1. Weppelmann TA, Zimmerman KT, Rashidi V. Trends in Incidence of Conjunctival Melanoma in the US. JAMA Netw Open 2022;5:e2237229. 10.1001/jamanetworkopen.2022.37229 - DOI - PMC - PubMed
    1. Wessely A, Steeb T, Berking C, et al. Surveillance of patients with conjunctival melanoma in German-speaking countries: A multinational survey of the German dermatologic cooperative oncology group. Eur J Cancer 2021;143:43-5. 10.1016/j.ejca.2020.10.021 - DOI - PubMed
    1. Virgili G, Parravano M, Gatta G, et al. Incidence and Survival of Patients With Conjunctival Melanoma in Europe. JAMA Ophthalmol 2020;138:601-8. 10.1001/jamaophthalmol.2020.0531 - DOI - PMC - PubMed
    1. Rivolta C, Royer-Bertrand B, Rimoldi D, et al. UV light signature in conjunctival melanoma; not only skin should be protected from solar radiation. J Hum Genet 2016;61:361-2. 10.1038/jhg.2015.152 - DOI - PMC - PubMed