. 2024 Feb 20;27(3):109278.
doi: 10.1016/j.isci.2024.109278. eCollection 2024 Mar 15.

TET2 regulation of alcoholic fatty liver via Srebp1 mRNA in paraspeckles

Affiliations

TET2 regulation of alcoholic fatty liver via Srebp1 mRNA in paraspeckles

Qinjin Li et al. iScience. .

Abstract

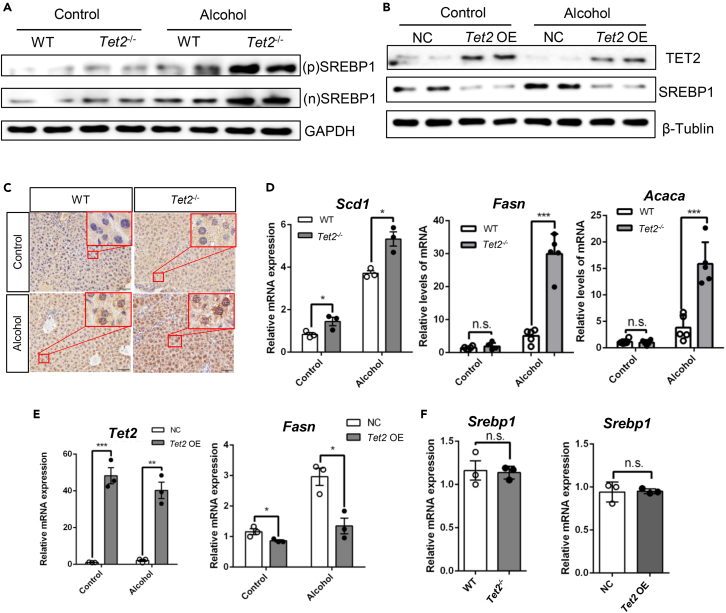
Epigenetic modifications have emerged as key regulators of metabolism-related complex diseases including the alcoholic fatty liver disease (AFLD) prevalent chronic liver disorder with significant economic implications. Building upon previous research that emphasizes ten-eleven translocation (TET) proteins' involvement in adipocyte insulin sensitization and fatty acid oxidation, we explored the role of TET2 protein in AFLD pathogenesis which catalyzes 5-methylcytosine into 5-hydroxymethylcytosine in DNA/RNA. Our findings revealed that TET2 deficiency exacerbates AFLD progression. And TET2 influenced the expression and activity of sterol regulatory element binding protein 1 (SREBP1), a key regulator of hepatic lipid synthesis, by modulating Srebp1 mRNA retention. Employing RIP-qPCR and bisulfite sequencing techniques, we provided evidence of TET2-mediated epigenetic modifications on Srebp1 mRNA, thereby affecting lipid metabolism. Through elucidating the role of methylation in RNA nuclear retention via paraspeckles, our study enhances understanding of AFLD pathogenesis from an epigenetic perspective, paving the way for identifying potential therapeutic targets.

Keywords: Classification Description: Molecular biology; Epigenetics; Molecular mechanism of gene regulation.


Conflict of interest statement

The authors declare that they have no conflict of interest.

Figures

None
Graphical abstract
Figure 1
Figure 1
TET2 deficiency exacerbates alcohol-induced hepatic steatosis in mice 8- to 10-week-old WT mice and Tet2−/− mice were fed with an isocaloric diet or a liquid diet containing alcohol (37% of total calorie) for 6 weeks, then livers and blood were collected for analysis. (A) Gross liver images obtained from WT mice and Tet2−/− mice fed with an isocaloric diet or a liquid diet containing alcohol for 6 weeks. (B) Body weight changes observed during the development of alcoholic fatty liver by liquid diet or isocaloric diet containing alcohol treatment. (C) Representative H&E staining in wild type mice liver and Tet2−/− mice liver after alcohol liquid diet or isocaloric diet treatment. Scale bar represents 50 μm. (D) Representative Oil red O staining in WT mice liver and Tet2−/− mice liver after alcohol liquid diet or isocaloric diet treatment. Scale bars represent 100 μm (top row) and 50 μm (bottom row). (E) Quantification of hepatic TG content and insulin levels in mice with fatty liver induced by alcohol. (F) Assessment of blood glucose levels through oral glucose tolerance test (OGTT) and insulin tolerance test (ITT). (G) The area under the curve (AUC) in OGTT and ITT. (H) Representative Oil red O staining in primary hepatocytes isolated from both WT and Tet2−/− mice and were treated with 100 mM alcohol and indicated concentrations of FFAs for 24 h. Scale bars represent 20 μm. (I) Measurement of triglyceride content in primary hepatocytes isolated from WT and Tet2−/− mice exposed to both 100 mM alcohol and 2 mM FFAs. Data are expressed as means ± SD, n ≥ 5 mice per group, representative of two experiments, ∗p < 0.05, ∗∗p < 0.01 and ∗∗∗p < 0.001 were determined by the one-way ANOVA.
Figure 2
Figure 2
TET2 facilitates the formation of alcoholic fatty liver by SREBP1 (A) Expression of SREBP1 was measured at the protein level in WT and Tet2−/− mouse livers after alcohol liquid diet or isocaloric diet treatment for 6 weeks. (B) Protein levels of TET2 and SREBP1 in HepG2 cells transfected with Tet2 or pcDNA3.1 plasmid for 48 h. (C) IHC staining for SREBP1 in WT and Tet2−/− mice liver after alcohol liquid diet treatment or isocaloric diet treatment for 6 weeks. Scale bar represents 50 μm. (D) Hepatic mRNA relative expression levels of Scd1, Fasn, and Acaca were determined by qPCR analysis in WT and Tet2−/− mice after alcohol liquid diet or isocaloric diet treatment for 6 weeks. (E) qPCR analysis of Tet2 and Fasn expression in HepG2 cells transfected with pcDNA3.1-Tet2 or pcDNA3.1 plasmid for 48 h. (F) qPCR analysis of Srebp1 in mouse livers after alcohol liquid diet or isocaloric diet treatment for 6 weeks and HepG2 cells transfected with pcDNA3.1-Tet2 or pcDNA3.1 plasmid for 48 h; Data are expressed as means ± SD, n ≥ 3 mice per group, representative of two experiments, ∗p < 0.05, ∗∗p < 0.01 and ∗∗∗p < 0.001 were determined by the one-way ANOVA.
Figure 3
Figure 3
TET2 facilitates nuclear localization of Srebp1 mRNA in hepatocytes (A) HepG2 cells transfected with pcDNA3.1-Tet2 or pcDNA3.1 plasmid for 48 h. Then, cells were separated the nuclear and cytoplasmic fractions and isolated RNA, respectively. qPCR analysis of Srebp1 in different cellular fractions. (B) Primary hepatocytes isolated from WT and Tet2−/− mice exposed to alcohol and FFAs for 48 h. Then, cells were separated the nuclear and cytoplasmic fractions and isolated RNA, respectively. qPCR analysis of Srebp1 in different cellular fractions. (C) Representative images from RNAscope ISH assays for Srebp1 on mouse liver paraffin section treated with alcohol liquid diet or isocaloric diet treatment for 6 weeks. Green signal represents Srebp1, blue shows DAPI. Scale bars, 20 μm. (D) Evaluation of the impact of TET2 on the localization of Srebp1 mRNA by PP7-mCherry RNA imaging system in HEK293T cells. Red spot represents Srebp1, blue shows DAPI. Scale bars, 10 μm. (E) Schematic overview of the plasmids of pcDNA3.1- Srebp1 WT and pcDNA3.1-Srebp1▵3′UTR. (F) HepG2 cells transfected with pcDNA3.1- Srebp1 WT and pcDNA3.1-Tet2 or pcDNA3.1 plasmid for 48 h. Then, cells were separated the nuclear and cytoplasmic fractions and isolated RNA, respectively. qPCR analysis of Srebp1 in different cellular fractions. (G) HepG2 cells transfected with pcDNA3.1-Srebp1▵3′UTR and pcDNA3.1-Tet2 or pcDNA3.1 plasmid for 48 h. Then, cells were separated the nuclear and cytoplasmic fractions and isolated RNA, respectively. qPCR analysis of Srebp1 in different cellular fractions.Data are expressed as means ± SD, n ≥ 3 mice per group, representative of two experiments, ∗∗p < 0.01 and ∗∗∗p < 0.001 were determined by the one-way ANOVA.
Figure 4
Figure 4
NONO mediates recruiting of TET2 to paraspeckles (A) Co-immunoprecipitation (Co-IP) assay detected the interaction between TET2 and NONO in WT mouse livers. Immunoprecipitation was performed using anti-TET2 and anti-NONO antibody, followed by immunoblotting for TET2 and NONO proteins. (B) HepG2 cells transfected with Tet2-mCherry plasmid for 48 h, followed by immunofluorescence staining with NONO. Red represents TET2-mCherry, green represents NONO, blue shows DAPI. Scale bars, 20 μm. (C) Representative images from immunofluorescence (IF) staining of TET2 and NONO in HepG2 cells. Red represents TET2, green represents NONO, blue shows DAPI. Scale bars, 20 μm. (D) Representative images from the PP7-mCherry RNA imaging system combined with IF for TET2 and NONO. White represents Srebp1, red represents TET2, green represents NONO, blue shows DAPI. Scale bars, 5 μm. (E) HepG2 cells were transfected with Nono siRNAs for 48 h. Nono knockout efficiency detected by qPCR. (F) qPCR analysis of Tet2 expression in HepG2 cells transfected with Nono siRNA for 48 h. (G) Protein levels of TET2 and SREBP1 in HepG2 cells transfected with Nono-siRNA for 5 days. (H) HepG2 cells transfected with Nono-siRNA for 5 days, followed by IF staining with NONO and TET2. Red represents TET2, green represents NONO, blue shows DAPI. Scale bars, 2 μm. (I) Fluorescence Recovery After Photo bleaching (FRAP) analysis in HepG2 cells overexpressing TET2-mCherry, assessing the dynamics of TET2 localization. Scale bars, 10 μm.Data are expressed as means ± SD, n ≥ 3 mice per group, representative of two experiments, ∗p < 0.01 and ∗∗p < 0.001 were determined by the one-way ANOVA.
Figure 5
Figure 5
TET2 modulates methylation levels of Srebp1 mRNA and regulates nuclear retention in paraspeckles (A) qPCR analysis of SREBP1 RNA immunoprecipitation (RIPed) samples from WT mouse liver treated with alcohol liquid diet for 6 weeks, normalized to the 1% input after incubation. (B) IHC staining for 5hmC in WT and Tet2−/− mice liver after alcohol liquid diet treatment for 6 weeks. Scale bars, 100 μm. (C) RNA bisulfite conversion sequencing assay was performed in WT and Tet2−/− mice liver after alcohol liquid diet treatment for 6 weeks demonstrating demethylation sites on the Srebp1 mRNA 3′ UTR. (D) Representative images from RNAscope ISH assays for Srebp1 combined with IF for NONO was performed on livers paraffin sections of WT mice treated with alcohol liquid diet for 6 weeks. Green represents Srebp1, red represents NONO, blue shows DAPI. Scale bars, 50 μm. (E) Expression of NONO was measured at the protein level in WT and Tet2−/− mouse livers after alcohol liquid diet or isocaloric diet treatment for 6 weeks. (F) Protein levels of TET2 and NONO in HepG2 cells transfected with Tet2 or pcDNA3.1 plasmid for 48 h. (G) Relative lncRNA NEAT1 levels were determined by qPCR analysis in WT and Tet2−/− mice liver after alcohol liquid diet treatment for 6 weeks. (H) HepG2 cells transfected with Tet2 or pcDNA3.1 plasmid for 48 h, followed by ActD treatment for different time. Assessment of the effect of TET2 on RNA stability of Srebp1 mRNA by qPCR analysis.Data are expressed as means ± SD, n ≥ 3 mice per group, representative of two experiments, ∗p < 0.05 and ∗∗p < 0.01 were determined by the one-way ANOVA.

Similar articles

References

    1. Nomura T., Ono M., Kobayashi K., Akaiwa Y., Ayaki M., Ogi T., Ogi M., Takahashi H., Ishikawa K., Morishita A., et al. Validation of fatty liver index as a predictor of hepatic steatosis in Asian populations: Impact of alcohol consumption and sex. Hepatol. Res. 2023;53:968–977. doi: 10.1111/hepr.13935. - DOI - PubMed
    1. Devarbhavi H., Asrani S.K., Arab J.P., Nartey Y.A., Pose E., Kamath P.S. Global burden of liver disease: 2023 update. J. Hepatol. 2023;79:516–537. doi: 10.1016/j.jhep.2023.03.017. - DOI - PubMed
    1. European Association for the Study of Liver EASL clinical practical guidelines: management of alcoholic liver disease. J. Hepatol. 2012;57:399–420. doi: 10.1016/j.jhep.2012.04.004. - DOI - PubMed
    1. Johnston M.P., Patel J., Byrne C.D. Causes of Mortality in Non-Alcoholic Fatty Liver Disease (NAFLD) and Alcohol Related Fatty Liver Disease (AFLD) Curr. Pharmaceut. Des. 2020;26:1079–1092. doi: 10.2174/1381612826666200128094231. - DOI - PubMed
    1. Zhang P., Wang W., Mao M., Gao R., Shi W., Li D., Calderone R., Sui B., Tian X., Meng X. Similarities and Differences: A Comparative Review of the Molecular Mechanisms and Effectors of NAFLD and AFLD. Front. Physiol. 2021;12 doi: 10.3389/fphys.2021.710285. - DOI - PMC - PubMed