. 2024 Mar 14;134(9):e169315.
doi: 10.1172/JCI169315.

Targeted therapies prime oncogene-driven lung cancers for macrophage-mediated destruction

Affiliations

Targeted therapies prime oncogene-driven lung cancers for macrophage-mediated destruction

Kyle Vaccaro et al. J Clin Invest. .

Abstract

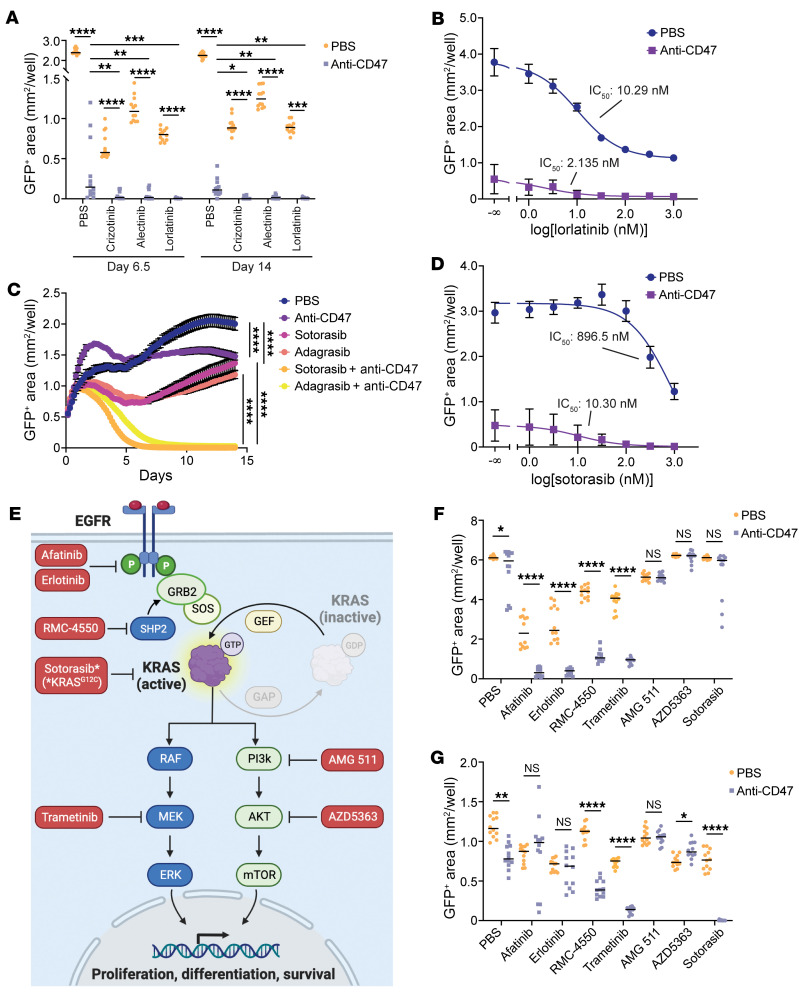
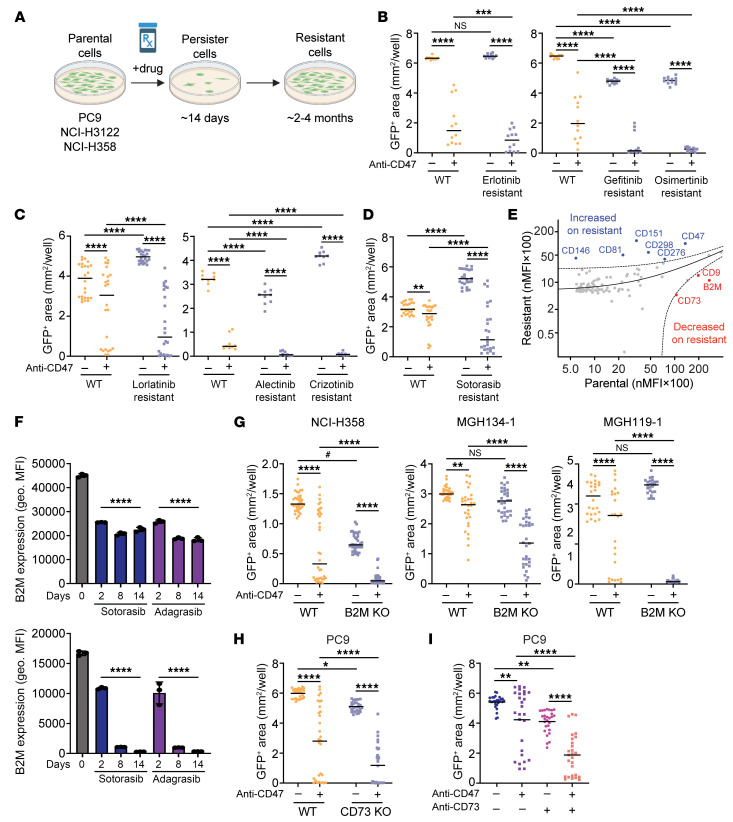
Macrophage immune checkpoint inhibitors, such as anti-CD47 antibodies, show promise in clinical trials for solid and hematologic malignancies. However, the best strategies to use these therapies remain unknown, and ongoing studies suggest they may be most effective when used in combination with other anticancer agents. Here, we developed an unbiased, high-throughput screening platform to identify drugs that render lung cancer cells more vulnerable to macrophage attack, and we found that therapeutic synergy exists between genotype-directed therapies and anti-CD47 antibodies. In validation studies, we found that the combination of genotype-directed therapies and CD47 blockade elicited robust phagocytosis and eliminated persister cells in vitro and maximized antitumor responses in vivo. Importantly, these findings broadly applied to lung cancers with various RTK/MAPK pathway alterations - including EGFR mutations, ALK fusions, or KRASG12C mutations. We observed downregulation of β2-microglobulin and CD73 as molecular mechanisms contributing to enhanced sensitivity to macrophage attack. Our findings demonstrate that dual inhibition of the RTK/MAPK pathway and the CD47/SIRPa axis is a promising immunotherapeutic strategy. Our study provides strong rationale for testing this therapeutic combination in patients with lung cancers bearing driver mutations.

Keywords: Cancer immunotherapy; Lung cancer; Macrophages; Oncology; Therapeutics.


Figures

Figure 1
Figure 1. An unbiased compound library screen identifies cooperation between targeted therapy and macrophage-directed immunotherapy for EGFR mutant lung cancer.
(A) Design of an unbiased functional screen to identify drugs that synergize with anti-CD47 therapy using primary human macrophages and GFP+ PC9 cancer cells. (B) Representative whole-well microscopy images showing GFP+ area (purple) from wells treated with drugs that enhanced (erlotinib, gefitinib) or inhibited (dexamethasone) macrophage-dependent cytotoxicity of PC9 cells. Scale bar: 800 μm. (C) Volcano plot summarizing drug screen results. Each point represents the mean from n = 5 experimental trials. The phenotypic effect size (x axis) is depicted as log2 fold change of GFP+ area in the macrophage+anti-CD47 condition relative to PC9 cells alone. Values were normalized to account for variation due to well position. Dashed lines represent 2-fold change in effect size (x axis) and P < 0.05 by t test (y axis). Gefitinib and erlotinib (blue) were identified as the top enhancers of macrophage-dependent cytotoxicity, whereas drugs depicted with red dots inhibited macrophage-dependent cytotoxicity or were drugs that macrophages protected against. (D) Curves from 1 representative plate showing macrophage-dependent cytotoxicity over time, as measured by decreases in GFP+ area of macrophage+anti-CD47 condition relative to the control condition. Gefitinib and erlotinib enhanced macrophage-dependent cytotoxicity within approximately 48 hours. Dashed lines indicate empirical 95% tolerance interval. (E) Box-and-whisker plot of drug classes ranked by normalized log2 fold change of GFP+ area in macrophage versus PC9 control condition. Boxes indicate the median and interquartile range, and whiskers indicate maxima and minima (excluding outliers) for the indicated drug class. Drug classes that significantly increased relative GFP+ area are depicted in red, whereas EGFR TKIs (blue) were identified as the only drug class that significantly decreased relative GFP+ area. Each class of drugs was compared with controls (DMSO and empty wells) using a t test (**FDR < 0.01, ***FDR < 0.001).
Figure 2
Figure 2. Combined targeting of EGFR and CD47 enhances macrophage phagocytosis in vitro.
(A) CD47 expression on the surface of NSCLC cell lines containing the indicated driver mutations. (B) Expression of macrophage immune checkpoint molecules on the surface NSCLC cell lines containing the indicated driver mutations. Geometric mean fluorescence intensity (Geo. MFI) for each antigen was compared with CD47. (C) CD47 expression on EpCam+ cancer cells from malignant pleural effusion specimens from patients with NSCLC. Left: Percentage of CD47+ cells. Right: CD47 geometric MFI. Bars represent mean of 2 technical replicates (points) from n = 10 independent patients. (D) Representative analysis of phagocytosis assays by flow cytometry. PC9 cells were exposed to vehicle control (PBS) or 1 μM EGFR TKI (erlotinib, gefitinib, or osimertinib) for 24 hours and then cocultured with macrophages with or without anti-CD47 for 2 hours. Phagocytosis was measured as the percentage of macrophages (CD45+ cells) engulfing GFP+ PC9 cells. (E) Quantification of phagocytosis using the indicated EGFR TKIs at 1 μM concentration. Phagocytosis was normalized to the maximal response for each independent donor. Data depict mean ± SD from n = 9 independent blood donors combined from 3 independent experiments using CFSE+ or GFP+ PC9 cells. (F) Phagocytosis assays using GFP+ PC9 cells exposed to 1 μM osimertinib for varying amounts of time prior to coculture with macrophages (n = 4 independent donors). The cells were analyzed for phagocytosis as in E. (G) Phagocytosis assays using GFP+ PC9 cells exposed to varying concentrations of osimertinib for 24 hours prior to coculture with macrophages. Data represent mean ± SD from 2 independent experiments using a total of n = 8 individual donors with 3 cocultures per donor. (B and EG) *P < 0.05, **P < 0.01, ***P < 0.001, ****P < 0.0001 by 1-way (B and E) or 2-way (F and G) ANOVA with Holm-Šidák multiple comparison test.
Figure 3
Figure 3. Combining TKIs with anti-CD47 antibodies eliminates EGFR mutant persister cells in long-term cocultures assays with primary human macrophages.
GFP+ EGFR mutant lung cancer cells were cocultured with primary human macrophages and treated as indicated with vehicle control (PBS), an anti-CD47 antibody (10 μg/mL), and/or EGFR TKIs (1 μM). GFP+ area was measured over time as a metric of cancer cell growth or elimination. (A) Representative images of GFP+ PC9 cells on day 6.5 of coculture, with macrophages showing GFP+ area (purple). Scale bar: 800 μm. (B) Growth of GFP+ PC9 cells in coculture with macrophages using the indicated therapies. Data represent mean ± SEM with statistical analysis performed on day 14. (C) Growth of GFP+ PC9 cells in coculture with macrophages with or without an anti-CD47 antibody and/or EGFR TKIs as indicated. (D) Growth of GFP+ MGH119-1 patient-derived cells in coculture with macrophages with or without an anti-CD47 antibody and/or EGFR TKIs as indicated. (E) Growth of GFP+ MGH134-1 patient-derived cells in coculture with macrophages with or without an anti-CD47 antibody and/or the EGFR TKIs as indicated. MGH134-1 cells are resistant to first-generation EGFR TKIs (erlotinib, gefitinib) but sensitive to third-generation TKIs (osimertinib). (F) Growth of GFP+ PC9 cells in coculture with macrophages and the indicated macrophage immune checkpoint inhibitors (10 μg/mL). Cells were cocultured with the antibodies alone or in combination with osimertinib (100 nM). Data depict GFP+ area on day 6.5. (BF) Data represent 3–4 cocultures per donor from experiments performed using a total of n = 3–9 independent macrophage donors. (CF) Points represent individual cocultures, bars represent the mean. *P < 0.05, **P < 0.01, ***P < 0. 001, ****P < 0.0001 by 1-way (BE) or 2-way (F) ANOVA with Holm-Šidák’s multiple comparisons test.
Figure 4
Figure 4. Targeted inhibition of the MAPK pathway primes NSCLC cells for macrophage-mediated destruction.
(A) Growth of GFP+ NCI-H3122 cells (a human ALK+ NSCLC cell line) cocultured with primary human macrophages and treated with vehicle (PBS), an anti-CD47 antibody (10 μg/mL), and/or the indicated ALK-specific TKIs (1 μM). (B) Growth of GFP+ NCI-H3122 cells cocultured with macrophages with or without an anti-CD47 antibody (10 μg/mL) and varying concentrations of the ALK-specific TKI lorlatinib. IC50 of lorlatinib alone (PBS) = 10.29 nM (95% CI, 8.665–12.22) versus IC50 of lorlatinib+anti-CD47 = 2.135 nM (95% CI, 0.6934–6.261]). (C) Growth of GFP+ NCI-H358 cells (a human KRASG12C mutant NSCLC cell line) cocultured with macrophages and treated with vehicle (PBS), an anti-CD47 antibody (10 μg/mL), and/or the indicated KRASG12C inhibitors (1 μM). (D) Growth of GFP+ NCI-H358 cells cocultured with macrophages with or without an anti-CD47 antibody (10 μg/mL) and varying concentrations of the KRASG12C inhibitor sotorasib. IC50 of sotorasib alone (PBS) = 896.5 nM (95% CI, 558.6–1,697) versus IC50 of sotorasib+anti-CD47 = 10.30 nM (95% CI, 2.949–40.48). (E) Diagram depicting the EGFR/RAS/MAPK pathway. KRAS can signal via MAPK elements or the PI3K/AKT pathway. Specific inhibitors used in this study are indicated in red. Sotorasib is specific for KRASG12C. (F) Growth of GFP+ PC9 cells in coculture with macrophages with or without an anti-CD47 antibody (10 μg/mL) and varying EGFR/RAS/MAPK or PI3K/AKT pathway inhibitors. (G) Growth of GFP+ NCI-H358 cells in coculture with macrophages with or without an anti-CD47 antibody (10 μg/mL) and varying inhibitors, as in F. (AG) Data represent individual cocultures with means (A, F, and G), mean ± SD on day 6.5 (B and D), or mean ± SEM (C) from 3 cocultures per donor using n = 4 independent macrophage donors. *P < 0.05, **P < 0.01, ***P < 0. 001, ****P < 0.0001 by 1-way ANOVA with Holm-Šidák multiple comparisons test.
Figure 5
Figure 5. The combination of targeted therapy and CD47 blockade enhances antitumor responses in mouse tumor models.
(A) EGFR mutant NSCLC PC9 xenograft model using NSG mice. Tumors were grown to approximately 500 mm3 and then mice were treated with vehicle control, an anti-CD47 antibody (250 μg 3 times weekly), osimertinib (5 mg/kg 5 times weekly), or the combination of anti-CD47 and osimertinib. Data depict mean tumor volume ± SEM (left), growth curves from individual mice (middle), or change in tumor volume from baseline (right). Complete responses were observed in 4 of 10 mice (40%) in the combination cohort. Data represent n = 9–11 mice per cohort combined from 2 independent experiments. (B) EGFR mutant NSCLC xenograft model of MGH134-1 patient-derived cells engrafted into NSG mice and treated as in A. (C) ALK+ xenograft model of NCI-H3122 cells engrafted into NSG mice and treated with vehicle control, an anti-CD47 antibody (250 μg 3 times weekly), lorlatinib (6 mg/kg 5 times weekly), or the combination of anti-CD47 and lorlatinib. (D) KRASG12C mutant xenograft model of NCI-H358 cells engrafted into NSG mice and treated with vehicle control, an anti-CD47 antibody (250 μg 3 times weekly), sotorasib (100 mg/kg 5 times weekly), or the combination of anti-CD47 and sotorasib. (E) Syngeneic model of KRASG12C mutant lung cancer using wild-type 3LL ΔNRAS cells or a CD47-KO variant engrafted into C57BL/6 mice. The mice were treated with vehicle control or sotorasib (30 mg/kg 5 times weekly) starting day 7 after engraftment. Data represent mean ± SEM from n = 9–10 mice per cohort. *P < 0.05 by paired t test for the indicated comparisons. (BD) Data represent change in tumor volume from baseline with mean ± SEM of n = 4 mice per cohort. (AD) *P < 0.05, **P < 0.01, ***P < 0. 001 by unpaired t test for combination versus targeted therapy.
Figure 6
Figure 6. Targeted therapies induce cross-sensitization to anti-CD47 therapy and downregulate B2M and CD73.
(A) Generation of GFP+ cell lines that are resistant to targeted therapies. Cells were cultured with 1.0 μM of appropriate targeted therapy until resistant cells emerged and proliferated in culture. (BD) Long-term coculture assays using GFP+ PC9 cells (B), GFP+ NCI-H3122 cells (C), or GFP+ NCI-H358 cells (D) that are resistant to the indicated targeted therapies. Anti-CD47 therapy significantly enhanced macrophage-mediated cytotoxicity of each resistant line relative to its naive parental counterpart. (E) Scatter plot showing results of comprehensive surface immunophenotyping of parental NCI-H358 cells versus a GFP+ sotorasib-resistant variant. Each dot represents the normalized mean fluorescence intensity (nMFI) of an individual surface antigen from a total of 354 specificities tested in 1 experiment. Antigens that exceed the 95% predicted interval on the parental line (red) or resistant line (blue) are indicated. (F) Treatment of parental NCI-H358 cells with the indicated targeted therapies causes downregulation of B2M (top) and CD73 (bottom) over time as measured by flow cytometry. ****P < 0.0001 for each drug treatment condition compared with time = 0 hours by 1-way ANOVA with Tukey’s multiple comparison test. (G) Evaluation of wild-type versus B2M KO lung cancer cell lines in long-term coculture assays with human macrophages. (H) Evaluation of wild-type versus CD73 KO PC9 cells in long-term coculture assays with human macrophages. (I) Treatment of PC9 cells with a CD73-blocking antibody alone or in combination with anti-CD47 in coculture assays with human macrophages. (BD and GI) Data represent experiments performed with n = 4–12 independent macrophage donors. Points represent individual cocultures, bars represent means at 6.5 days. *P < 0.05, **P < 0.001, ***P < 0.001, ****P < 0.0001 by 2-way ANOVA with Holm-Šidák multiple comparisons test; #GFP+ area was underrepresented due to high confluency and was not visually different by phase microscopy.

Update of

References

    1. Jordan EJ, et al. Prospective comprehensive molecular characterization of lung adenocarcinomas for efficient patient matching to approved and emerging therapies. Cancer Discov. 2017;7(6):596–609. doi: 10.1158/2159-8290.CD-16-1337. - DOI - PMC - PubMed
    1. Soria JC, et al. Osimertinib in untreated EGFR-mutated advanced non-small-cell lung cancer. N Engl J Med. 2018;378(2):113–125. doi: 10.1056/NEJMoa1713137. - DOI - PubMed
    1. Skoulidis F, et al. Sotorasib for lung cancers with KRAS p.G12C mutation. N Engl J Med. 2021;384(25):2371–2381. doi: 10.1056/NEJMoa2103695. - DOI - PMC - PubMed
    1. Tan AC, Tan DSW. Targeted therapies for lung cancer patients with oncogenic driver molecular alterations. J Clin Oncol. 2022;40(6):611–625. doi: 10.1200/JCO.21.01626. - DOI - PubMed
    1. Shaw AT, et al. First-line lorlatinib or crizotinib in advanced ALK-positive lung cancer. N Engl J Med. 2020;383(21):2018–2029. doi: 10.1056/NEJMoa2027187. - DOI - PubMed

Publication types

MeSH terms

LinkOut - more resources