. 2024 Mar 14;9(8):e172565.
doi: 10.1172/jci.insight.172565.

OGDH and Bcl-xL loss causes synthetic lethality in glioblastoma

Affiliations

OGDH and Bcl-xL loss causes synthetic lethality in glioblastoma

Trang Tt Nguyen et al. JCI Insight. .

Abstract

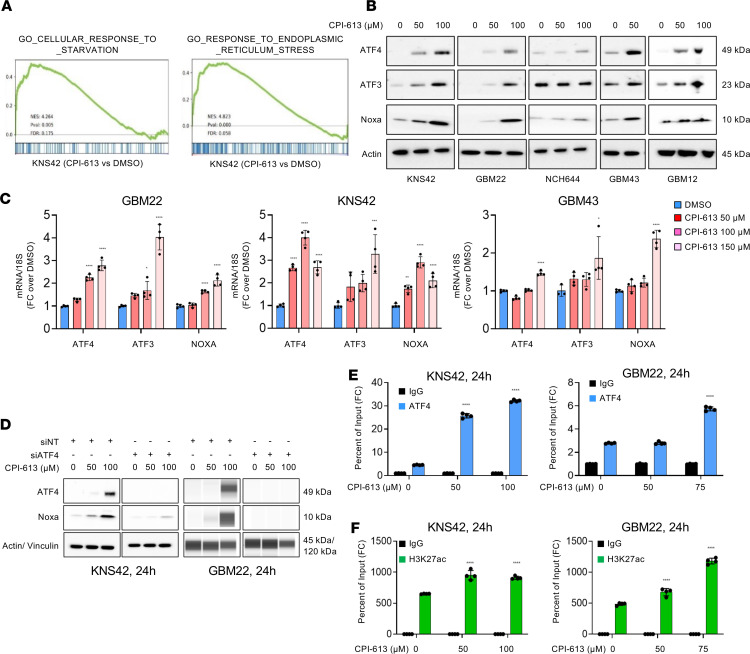
Glioblastoma (GBM) remains an incurable disease, requiring more effective therapies. Through interrogation of publicly available CRISPR and RNAi library screens, we identified the α-ketoglutarate dehydrogenase (OGDH) gene, which encodes an enzyme that is part of the tricarboxylic acid (TCA) cycle, as essential for GBM growth. Moreover, by combining transcriptome and metabolite screening analyses, we discovered that loss of function of OGDH by the clinically validated drug compound CPI-613 was synthetically lethal with Bcl-xL inhibition (genetically and through the clinically validated BH3 mimetic, ABT263) in patient-derived xenografts as well neurosphere GBM cultures. CPI-613-mediated energy deprivation drove an integrated stress response with an upregulation of the BH3-only domain protein, Noxa, in an ATF4-dependent manner, as demonstrated by genetic loss-of-function experiments. Consistently, silencing of Noxa attenuated cell death induced by CPI-613 in model systems of GBM. In patient-derived xenograft models of GBM in mice, the combination treatment of ABT263 and CPI-613 suppressed tumor growth and extended animal survival more potently than each compound on its own. Therefore, combined inhibition of Bcl-xL along with disruption of the TCA cycle might be a treatment strategy for GBM.

Keywords: Apoptosis pathways; Oncology.


Conflict of interest statement

Conflict of interest: The authors have declared that no conflict of interest exists.

Figures

Figure 1
Figure 1. Genetic or pharmacological inhibition of OGDH, a key enzyme of the TCA cycle, reduces the growth of GBM cultures.
(A and B) CRISPR and RNAi library screening (obtained and analyzed from the DepMAP database) points toward increased reliance of GBM cells on several TCA cycle enzymes, especially the OGDH gene. (C) KNS42, GBM22, and GBM12 cells were transduced with lentiviral vectors containing either nontargeting shRNA (shNT) or shRNAs against OGDH. Cellular viability analysis was performed for up to 4 days (n = 4 per group). FC, fold change. (D) Western blots of KNS42, GBM22, and GBM12 cells transduced with lentiviral vectors containing either shNT or shRNAs against OGDH. Actin was used as a loading control. (E) GBM22, GBM12, KNS42, NCH644, and astrocytes were treated with increasing concentrations of CPI-613 for 72 hours, labeled with Annexin V/PI dye, and analyzed by flow cytometry for apoptosis induction (n = 3 per group). (F) Shown is the survival curve of patients (wild-type and mutated IDH) with high or low mRNA levels of OGDH from TCGA database. Cutoff point (maximally selected rank statistics) was calculated through GlioVis (http://gliovis.bioinfo.cnio.es/ Last accessed March 26, 2024.), which yielded a cutpoint of 11.3 for mRNA. High levels of OGDH correlate with a worse overall survival in patients. (G and H) GBM22 cells were transduced with lentiviral vectors containing either shNT or shRNAs against OGDH, and were implanted in the right striatum of nude mice. (G) Representative MRI images of brain tumors from the experiment in H are shown (Bruker BioSpec, 9.4 Tesla). (H) The log-rank test was used to assess statistical significance (n = 5 in shNT and n = 7 in shODGH-80). Median survival was 40 days in GBM22 with shNT and 56 days in GBM22 with shOGDH-80. Statistical significance was assessed by 1-way ANOVA with Dunnett’s multiple-comparison test (E) or 2-tailed Student’s t test (H). Data are shown as mean ± SD. ****P < 0.001.
Figure 2
Figure 2. Treatment with CPI-613 increases the expression of proapoptotic Noxa and suppresses Bcl-xL levels to induce apoptosis.
(A) GBM22, KNS42, GBM43, NCH644, and GBM12 cells were treated with increasing concentrations of CPI-613 for 24 hours and were analyzed for the Bcl-2 family members by Western blotting. (B) GBM22 and KNS42 cells were transduced with an empty vector (EV) or a vector containing Bcl-xL cDNA (using adenoviruses), treated with increasing concentrations of CPI-613, and cellular viability was analyzed (n = 4 per group). FC, fold change. (C) GBM43 and KNS42 cells were transduced with an EV or a vector containing Bcl-xL cDNA, treated with increasing concentrations of CPI-613, labeled with Annexin V/PI dye, and analyzed by flow cytometry (n = 2 per group). (D and E) KNS42 cells were transfected with nontargeting siRNA (siNT) or siRNAs against Noxa. Transfected cells were treated with CPI-613 and cellular viability analysis was performed (D, n = 4 per group), and flow cytometry following labeling with Annexin V/PI was performed (E, n = 3 per group). Statistical significance was assessed by 2-tailed Student’s t test (B, D, and E). Data are shown as mean ± SD. *P < 0.05, **P < 0.01, ****P < 0.001.
Figure 3
Figure 3. CPI-613 treatment reduces the labeling of TCA cycle metabolites from glucose and the oxygen consumption rate in GBM cells.
(A) KNS42 cells were treated with CPI-613 for 24 hours, subjected to RNA-seq, and followed by GSEA. NES, normalized enrichment score; FDR, false discovery rate. (B and C) KNS42 cells were treated with CPI-613 for 24 hours and were processed for polar metabolite LC/MS analysis. The metabolite enrichment analysis was performed by using MetaboAnalyst (https://www.metaboanalyst.ca/). Shown is the enrichment pathway analysis and the citric acid cycle is highlighted in red. FC, fold change. (DF) KNS42 cells were treated with 100 μM CPI-613 in DMEM containing 25 mM U-13C6-glucose, 4 mM glutamine, and 1.5% dialyzed FBS for 24 hours. Shown are fractions of the isotopologues for each metabolite (n = 3 per group). (G) GBM22 cells were transduced with either nontargeting shRNA (shNT) or shRNAs against OGDH. The transduced cells were cultured in DMEM containing 25 mM U-13C6-glucose, 4 mM glutamine, and 10% dialyzed FBS for 24 hours (n = 3 per group). (HK) KNS42 and GBM22 cells were treated with CPI-613 (CPI) for 24 hours and subjected to extracellular flux analysis to analyze maximal respiration and coupled respiration in J and K. OM, oligomycin; FCCP, carbonylcyanide-4 (trifluoromethoxy) phenylhydrazone; R/A, rotenone and antimycin (n = 3 per group). Statistical significance was assessed by 2-tailed Student’s t test (DF, J, and K) or 1-way ANOVA with Dunnett’s multiple-comparison test (G). Data are shown as mean ± SD. ***P < 0.001; ****P < 0.0001.
Figure 4
Figure 4. CPI-613 treatment causes energy deprivation and activates endoplasmic reticulum stress signaling.
(A) KNS42 cells were treated with CPI-613 for 24 hours, subjected to RNA-seq, and followed by GSEA. NES, normalized enrichment score; FDR, false discovery rate. (B) Western blots of KNS42, GBM22, GBM43, NCH644, and GBM12 cells treated with increasing concentrations of CPI-613 for 24 hours. Actin is a loading control. (C) Real-time PCR analysis of GBM22, KNS42, and GBM43 cells treated with increasing concentrations of CPI-613 for 24 hours. 18S is a housekeeping gene. FC, fold change. (D) Standard Western blot (KNS42) or protein capillary electrophoresis analyses (GBM22) of cells transfected with nontargeting siRNA (siNT) or with siRNA against ATF4 (total) followed by treatment with CPI-613 for 24 hours. Actin or vinculin is a loading control. (E) KNS42 and GBM22 cells were treated with CPI-613 for 24 hours and were subjected to chromatin immunoprecipitation with either a control antibody (IgG; negative control) or an antibody against ATF4. The Noxa region was amplified by PCR. (F) KNS42 and GBM22 cells were treated with CPI-613 for 24 hours and were subjected to chromatin immunoprecipitation with either a control antibody (IgG; negative control) or an antibody against H3K27ac. The Noxa region was amplified by PCR (n = 4 per group). Statistical significance was assessed by 1-way ANOVA with Dunnett’s multiple-comparison test (C) or 2-tailed Student’s t test (E and F). Data are shown as mean ± SD. *P < 0.05; **P < 0.01; ***P < 0.001; ****P < 0.0001.
Figure 5
Figure 5. Dual inhibition with ABT263 and CPI-613 elicits a synergistic reduction in GBM cell viability.
(A and B) GBM12, GBM22, GBM43, and KNS42 cells were treated with ABT263, CPI-613, or the combination of both for 72 hours, and cellular viability was analyzed. Shown are isobolograms in A and the quantification in B (n = 4 per group). (C) GBM12, GBM22, GBM43, and NCH644 cells were treated with ABT263, CPI-613, or the combination of both, labeled with Annexin V/PI dye, and analyzed by flow cytometry (n = 3 per group). (D) KNS42 cells were transduced with lentiviral vectors containing either nontargeting shRNA (shNT) or shRNAs against OGDH, treated with increasing concentrations of ABT263, and followed by flow cytometry after Annexin V/PI labeling (n = 3 per group). (E) GBM12 and KNS42 cells were transfected with nontargeting siRNA (siNT) and siRNA against Noxa. Cells were treated as indicated and labeled with Annexin V/PI followed by flow cytometry (n = 3 per group). Statistical significance was assessed by 1-way ANOVA with Dunnett’s multiple-comparison test (BD) or 2-tailed Student’s t test (E). Data are shown as mean ± SD. ****P < 0.001.
Figure 6
Figure 6. Dual inhibition of Bcl-xL and OGDH extends animal survival in orthotopic patient-derived xenograft models of GBM in mice.
(A and B) GBM12 cells were implanted into the subcutis of immunocompromised nu/nu mice. Seven days later, the mice were divided into 4 treatment groups: vehicle, CPI-613 (50 mg/kg), ABT263 (75 mg/kg), and the combination of both. The tumor volume over time is shown on the left and the tumor volume on the last day of the experiment is shown on the right (n = 9 per group). (C and D) GBM12 and GBM22 cells were implanted in the right striatum of nu/nu mice. Four groups were randomly assigned: vehicle, CPI-613, ABT263, and the combination of both. Seven days after the implantation, mice were treated 3 times per week and animal survival is provided (Kaplan-Meier curve). The log-rank test was used to assess statistical significance (GBM12: n = 5 per group; GBM22: n = 4 for vehicle, CPI-613, and ABT263, and n = 6 for CPI-613 + ABT263). Median survival in GBM12: 20 days for vehicle and ABT263, 23 days for CPI-613, and 32 days for CPI-613 + ABT263. Median survival in GBM22: 21.5 days for vehicle, 28 days for ABT263 and CPI-613, and 31.5 days for CPI-613 + ABT263. (E and F) Representative MRI images of brain tumors as well as their quantification from the experiment in D are shown (Bruker BioSpec, 9.4 Tesla). (G and I) Shown are representative images of TUNEL staining and the related quantification in I. (H and J) Shown are representative images of Noxa immunohistochemical staining and the related quantification in J. Scale bars: 20 μm. Statistical significance was assessed by using 1-way ANOVA with Dunnett’s multiple-comparison test (BE, I, and J). Data are shown as mean ± SEM in A and mean ± SD in BD, I, and J. *P < 0.05; **P < 0.01; ***P < 0.001; ****P < 0.0001.

References

    1. Parsons DW, et al. An integrated genomic analysis of human glioblastoma multiforme. Science. 2008;321(5897):1807–1812. doi: 10.1126/science.1164382. - DOI - PMC - PubMed
    1. Cancer Genome Atlas Research Network. et al. Comprehensive, integrative genomic analysis of diffuse lower-grade gliomas. N Engl J Med. 2015;372(26):2481–2498. doi: 10.1056/NEJMoa1402121. - DOI - PMC - PubMed
    1. Bayik D, et al. Distinct cell adhesion signature defines glioblastoma myeloid-derived suppressor cell subsets. Cancer Res. 2022;82(22):4274–4287. doi: 10.1158/0008-5472.CAN-21-3840. - DOI - PMC - PubMed
    1. Bayik D, et al. Myeloid-derived suppressor cell subsets drive glioblastoma growth in a sex-specific manner. Cancer Discov. 2020;10(8):1210–1225. doi: 10.1158/2159-8290.CD-19-1355. - DOI - PMC - PubMed
    1. Eyler CE, Rich JN. Survival of the fittest: cancer stem cells in therapeutic resistance and angiogenesis. J Clin Oncol. 2008;26(17):2839–2845. doi: 10.1200/JCO.2007.15.1829. - DOI - PMC - PubMed

Publication types

MeSH terms