. 2024 Mar 26;43(3):113948.
doi: 10.1016/j.celrep.2024.113948. Epub 2024 Mar 13.

Frequency-potency analysis of IgG+ memory B cells delineates neutralizing antibody responses at single-cell resolution

Affiliations

Frequency-potency analysis of IgG+ memory B cells delineates neutralizing antibody responses at single-cell resolution

Michelle K Tenggara et al. Cell Rep. .

Abstract

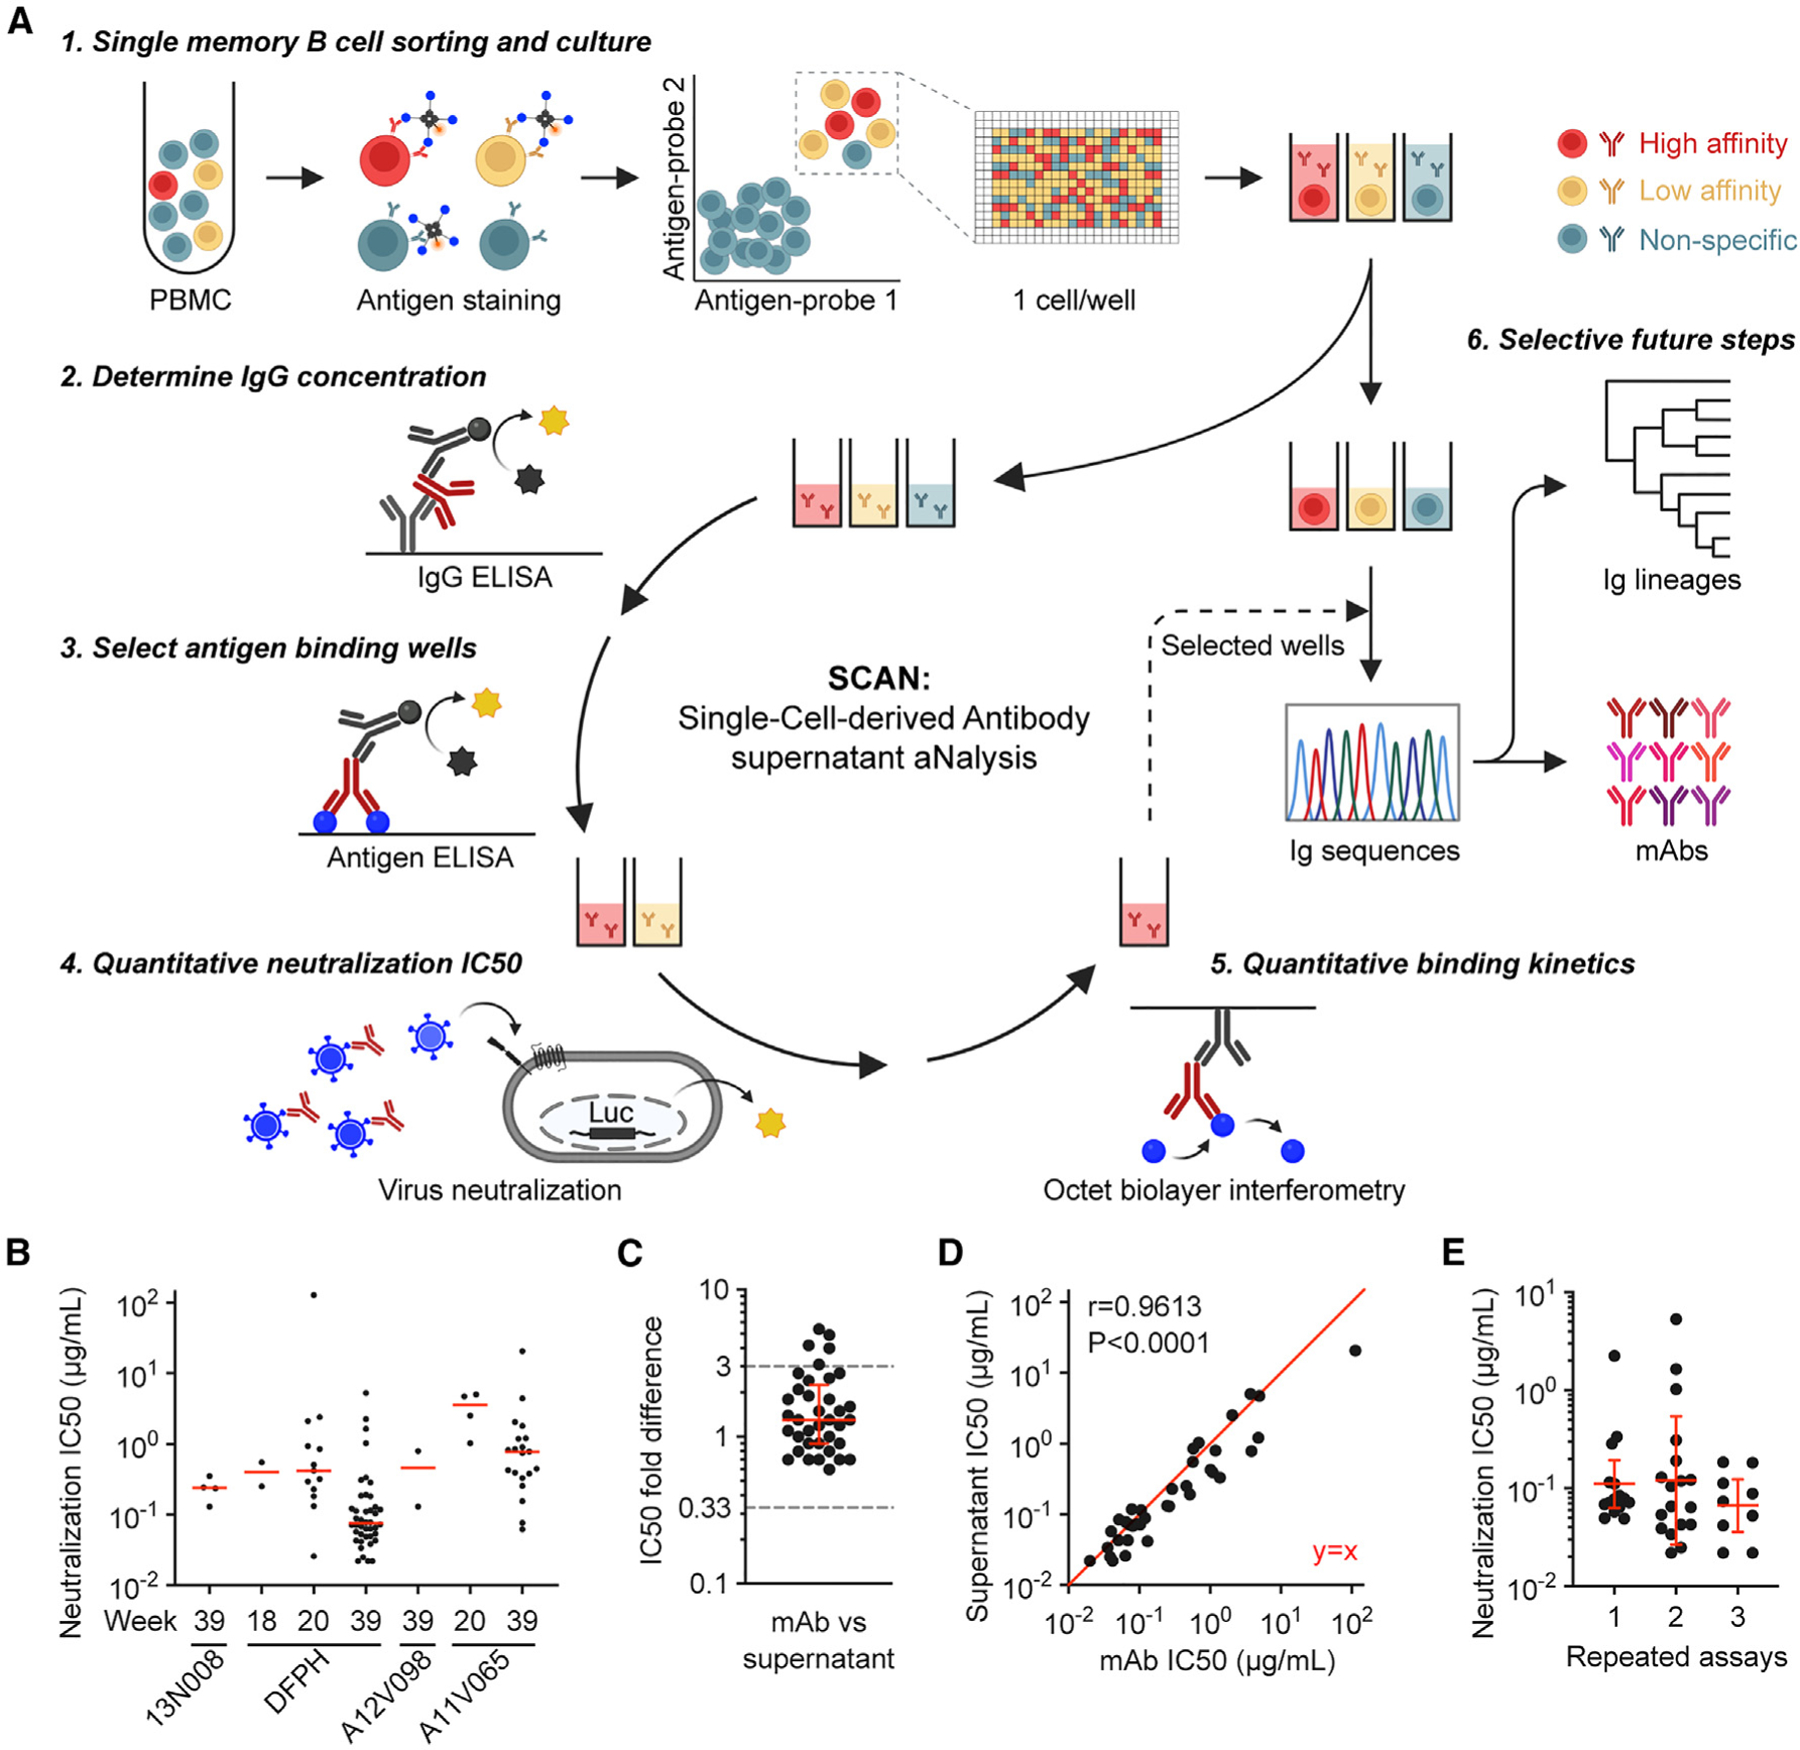
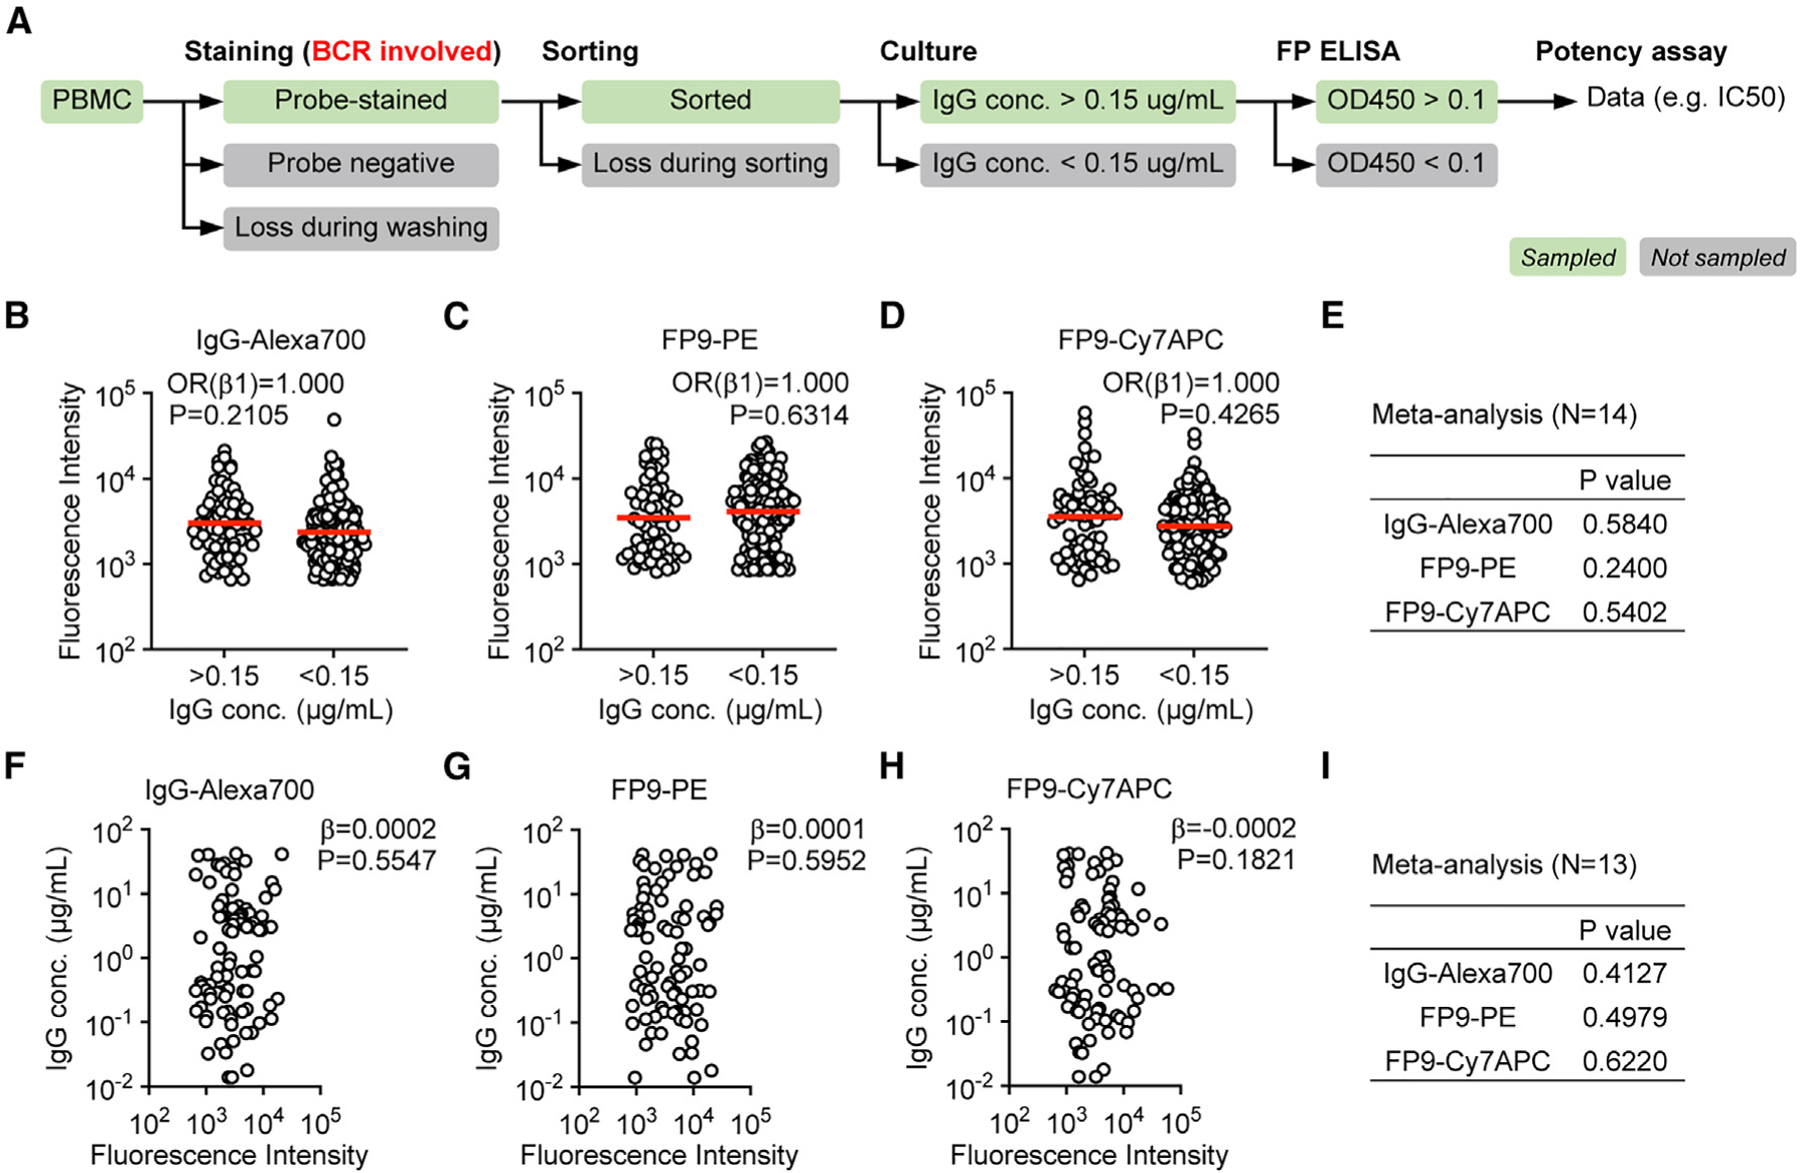
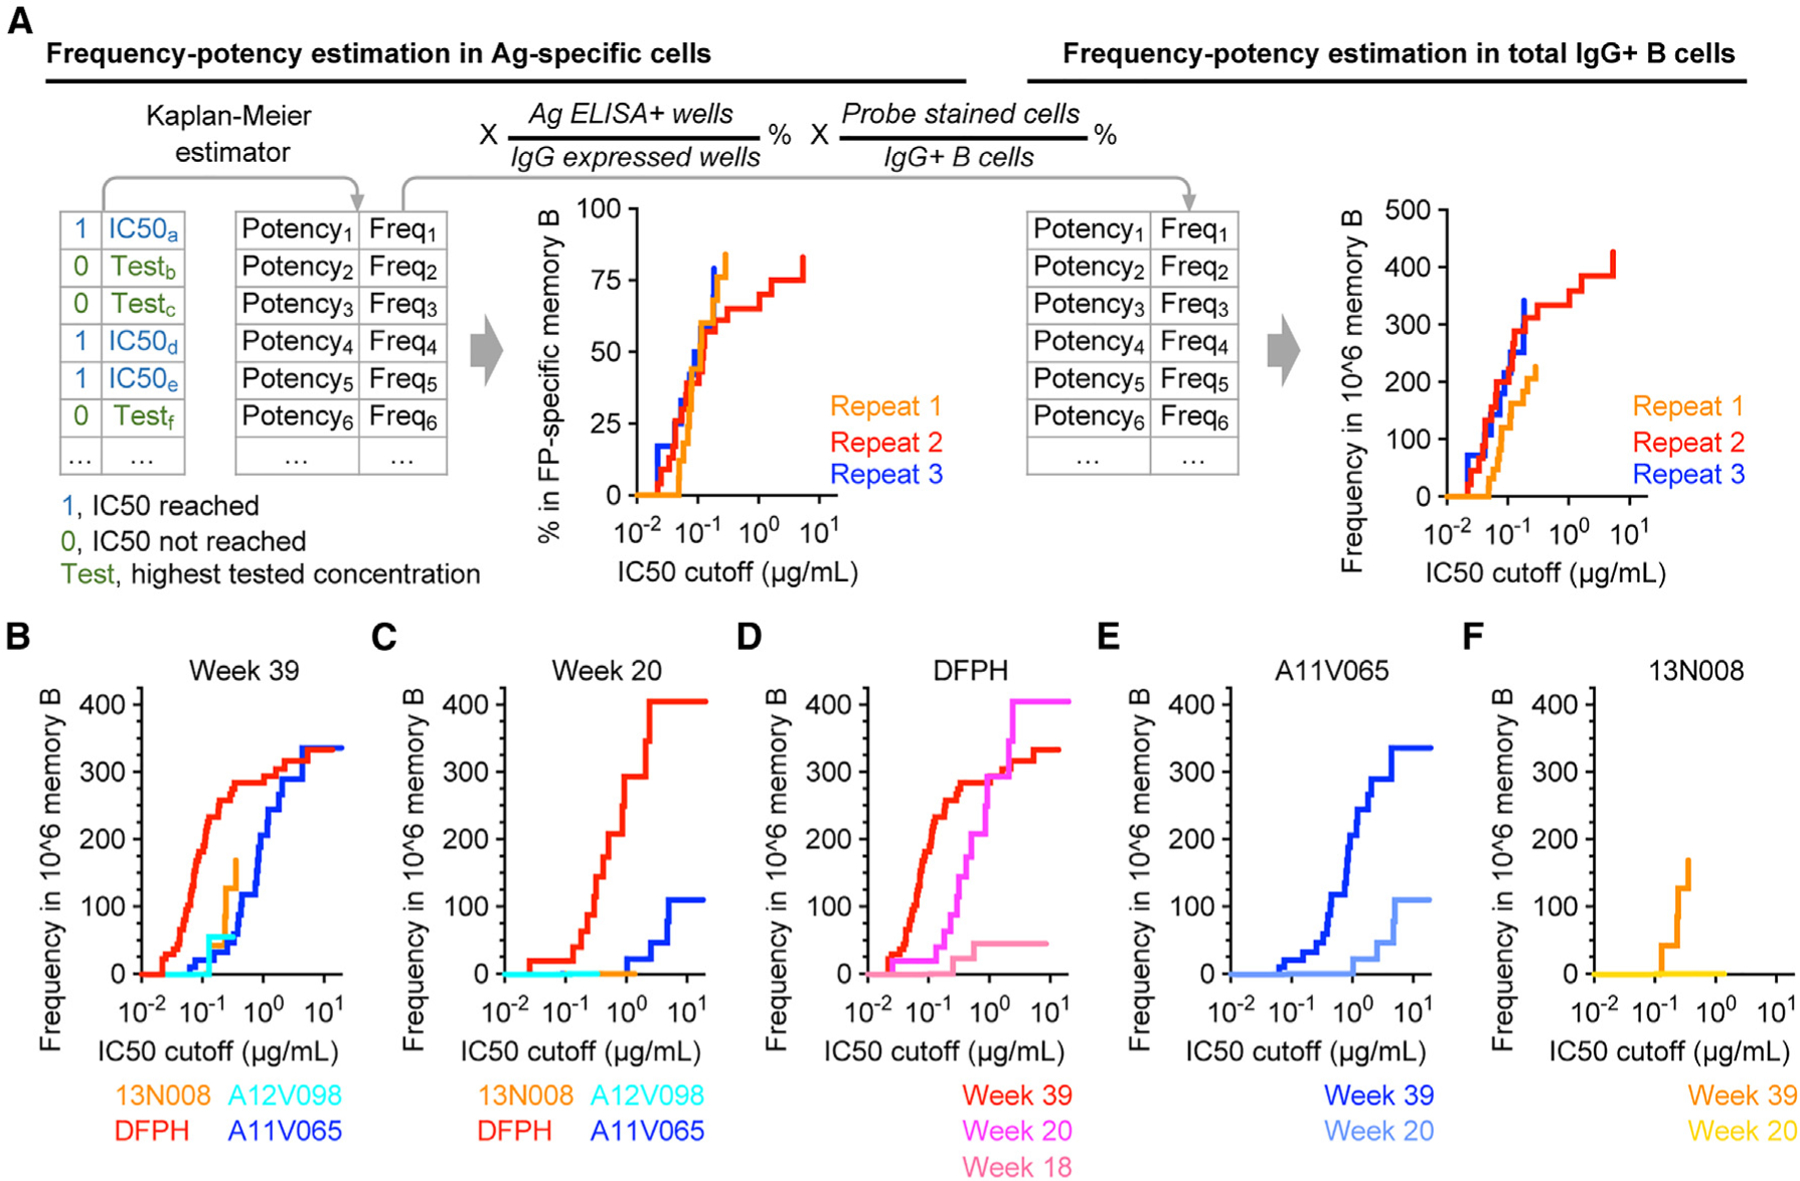
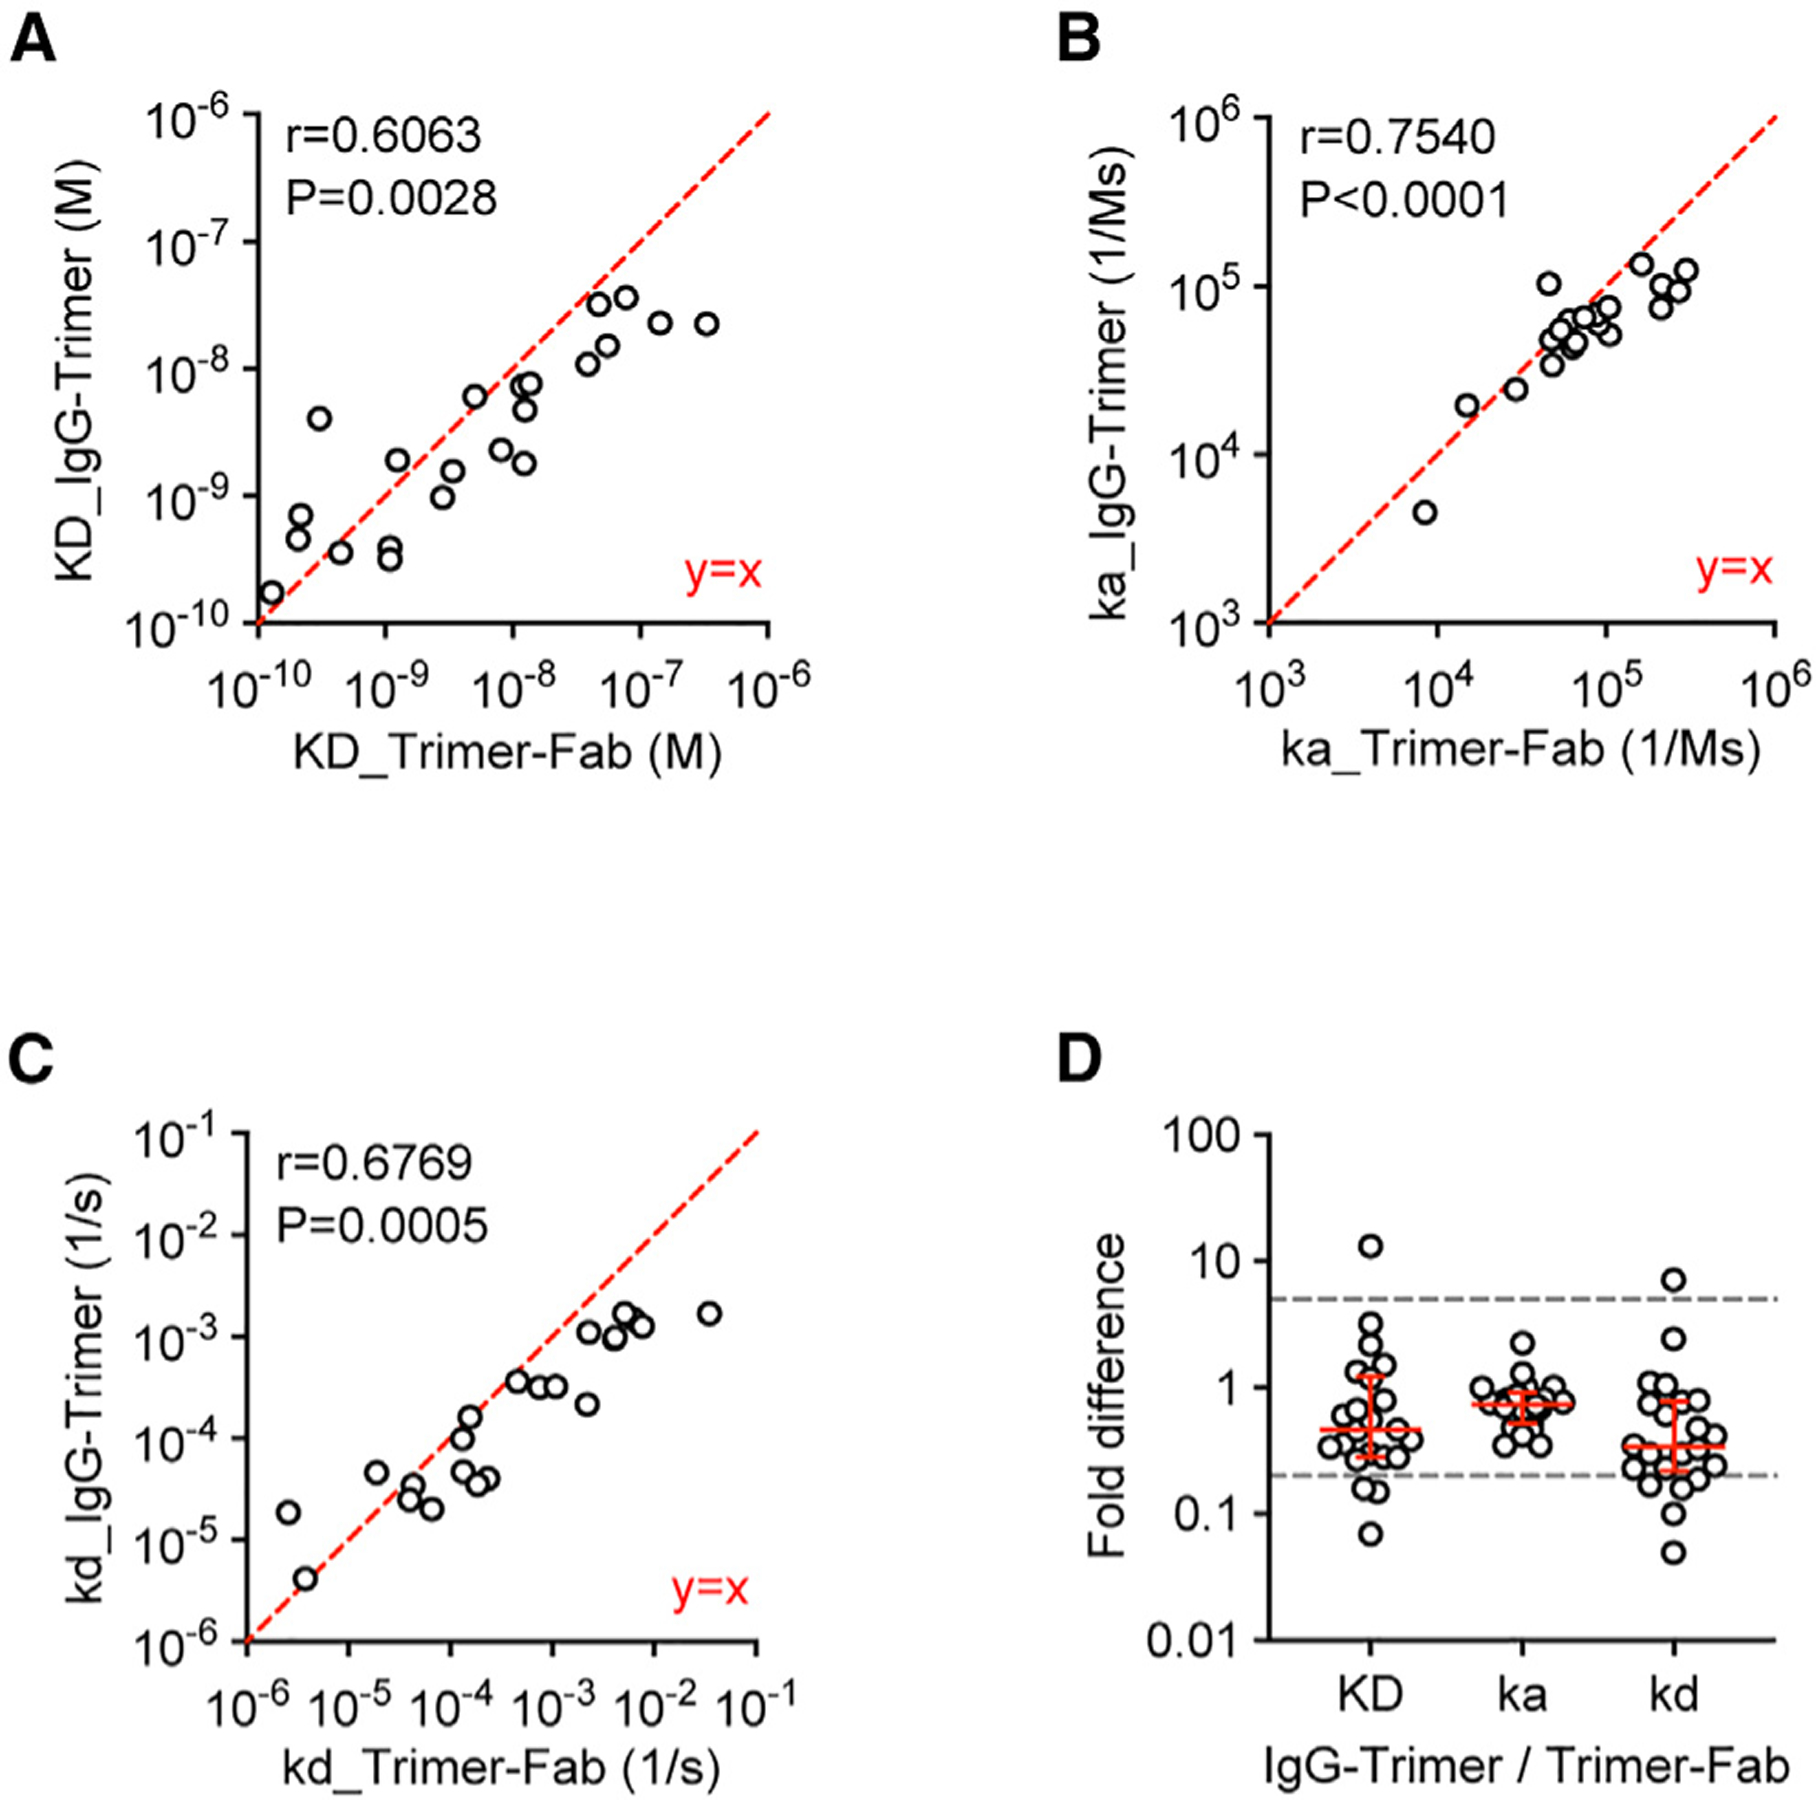
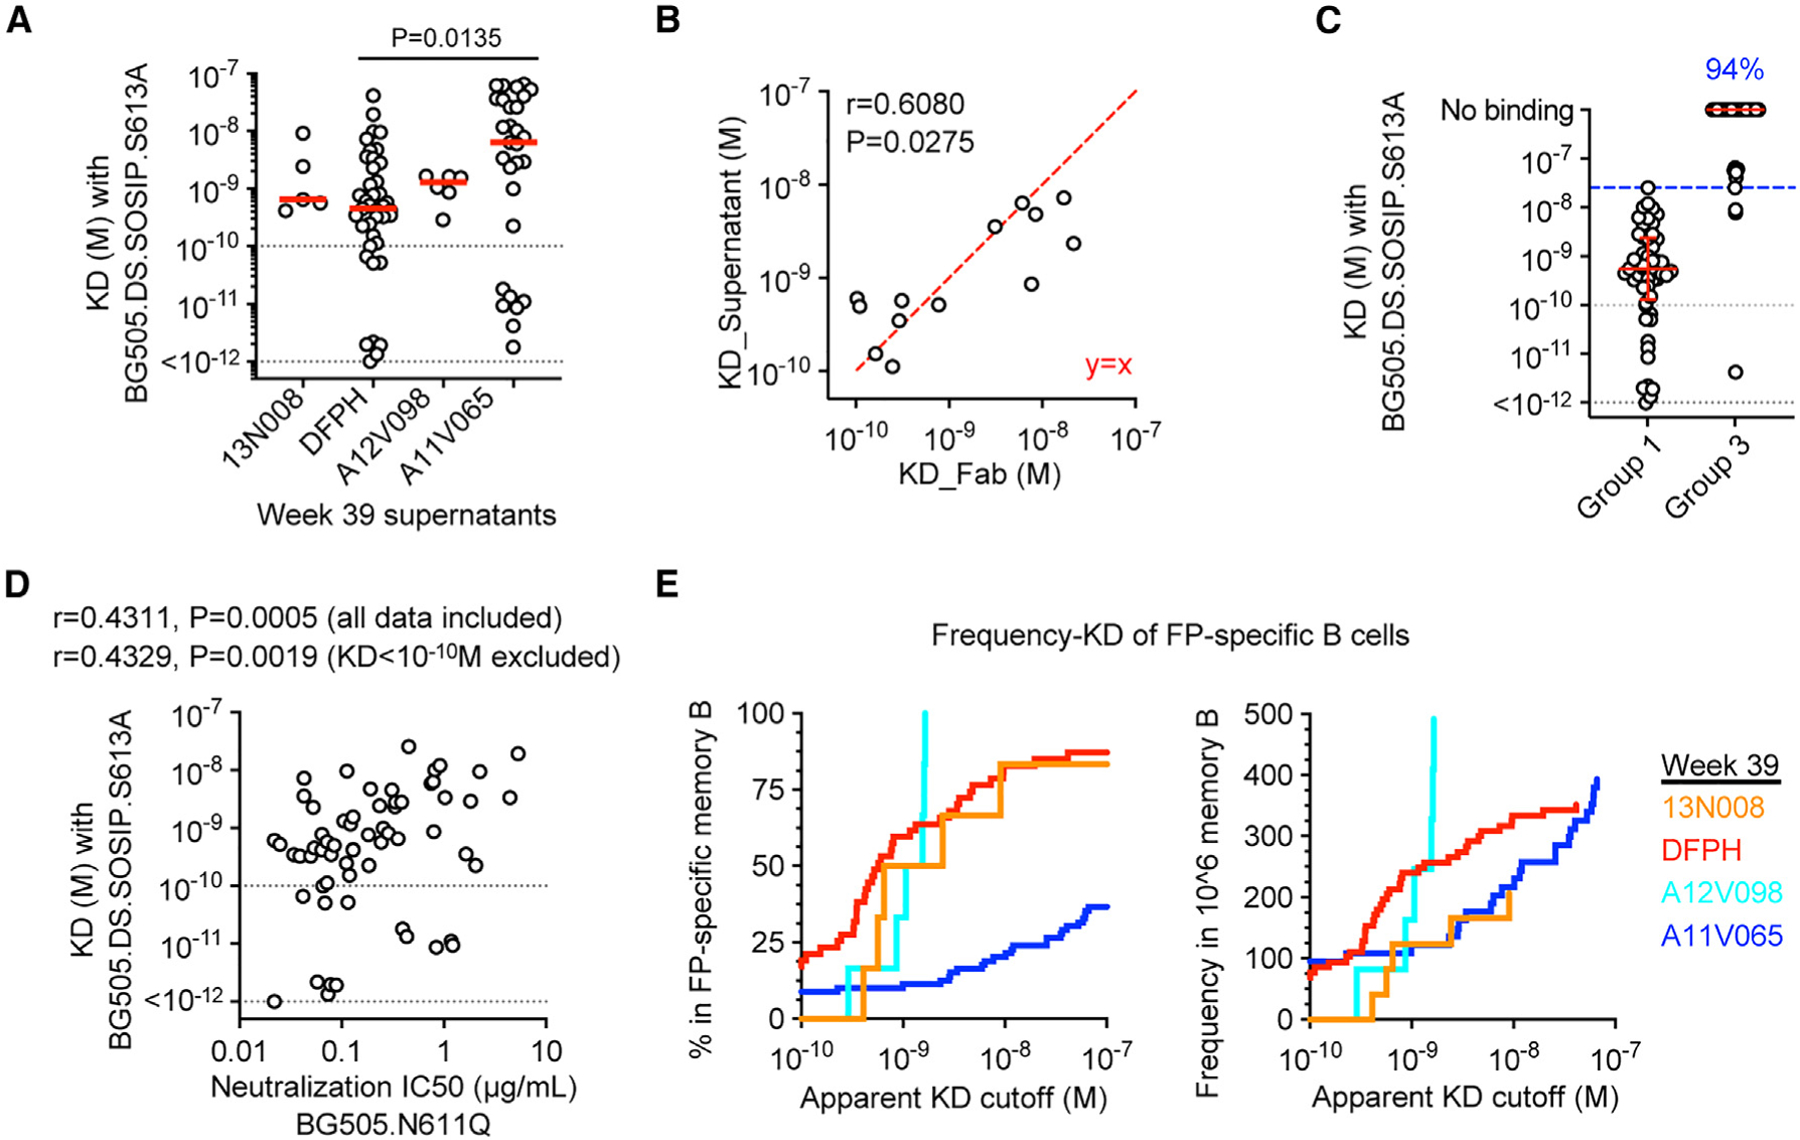
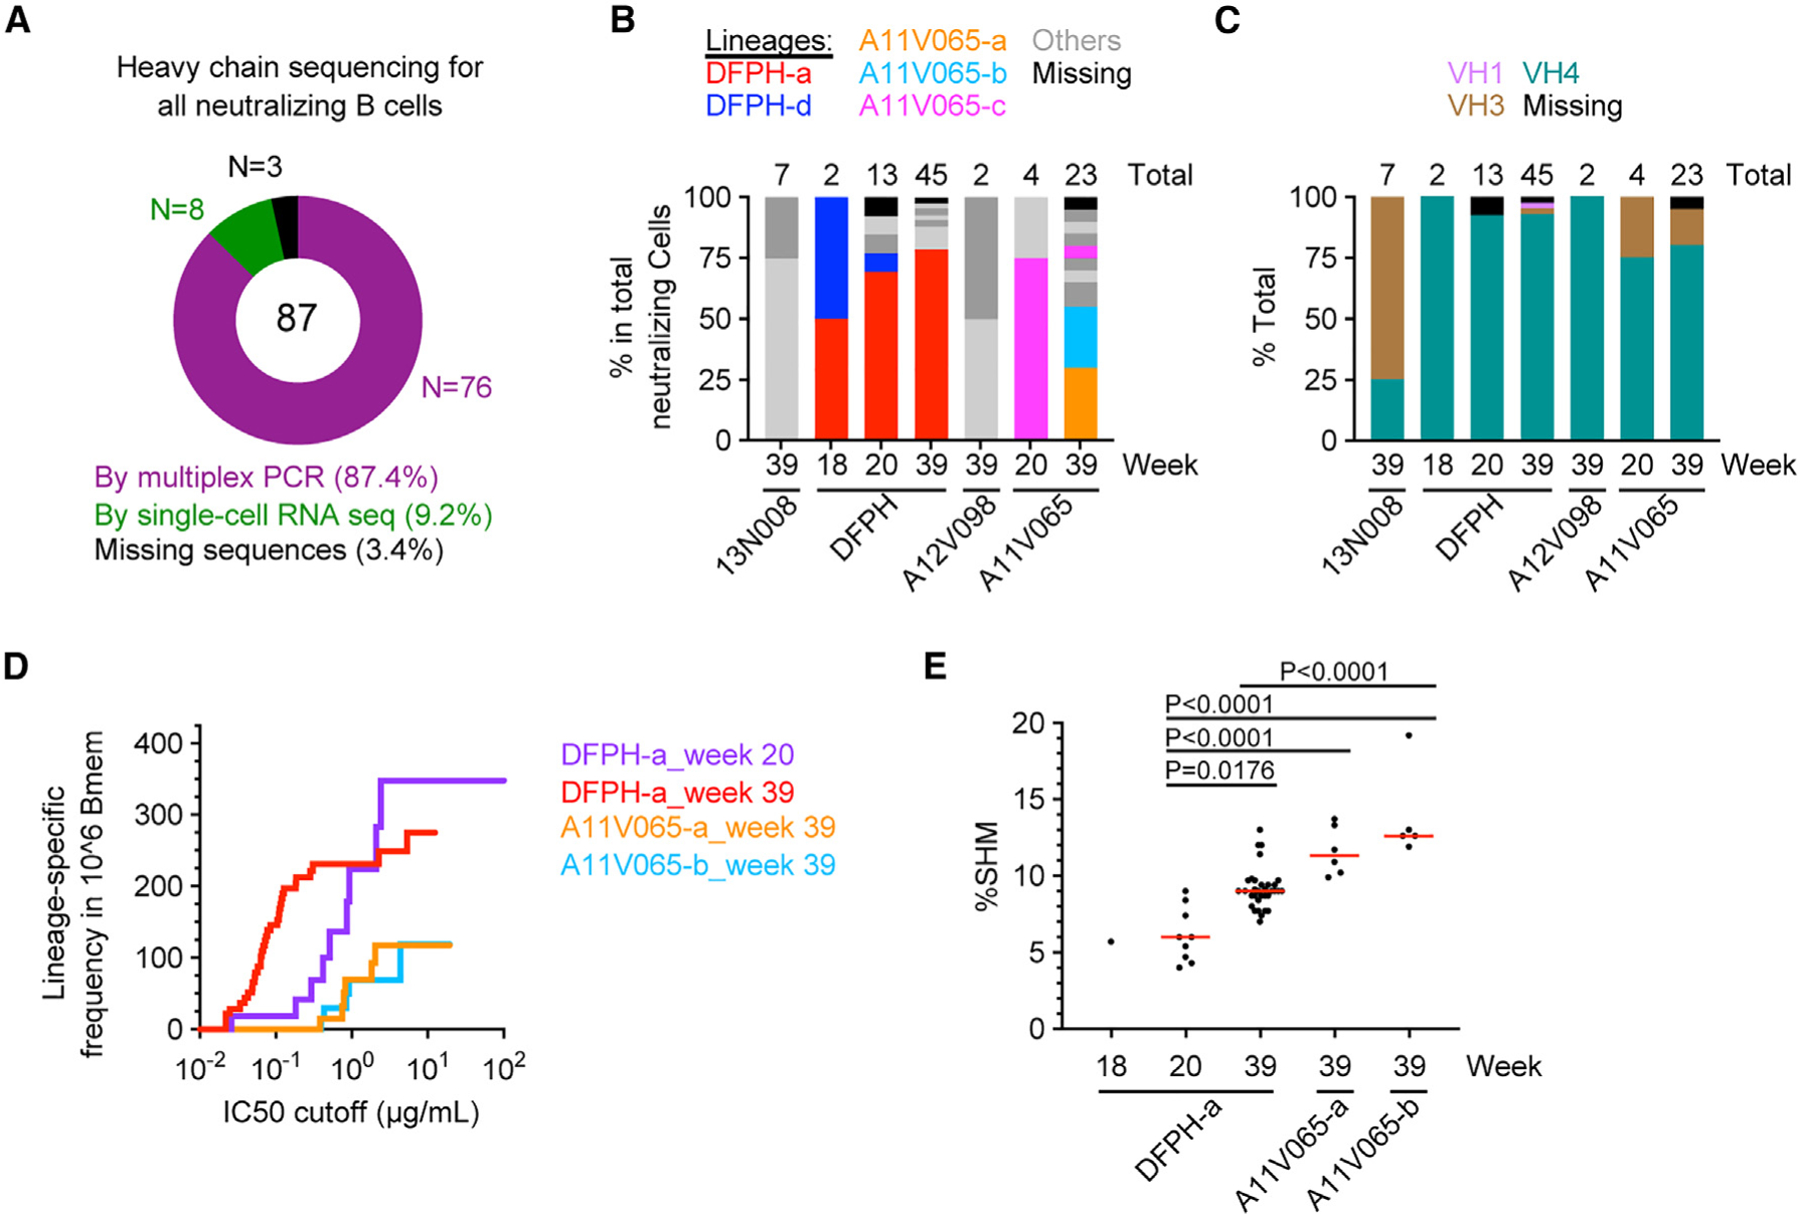
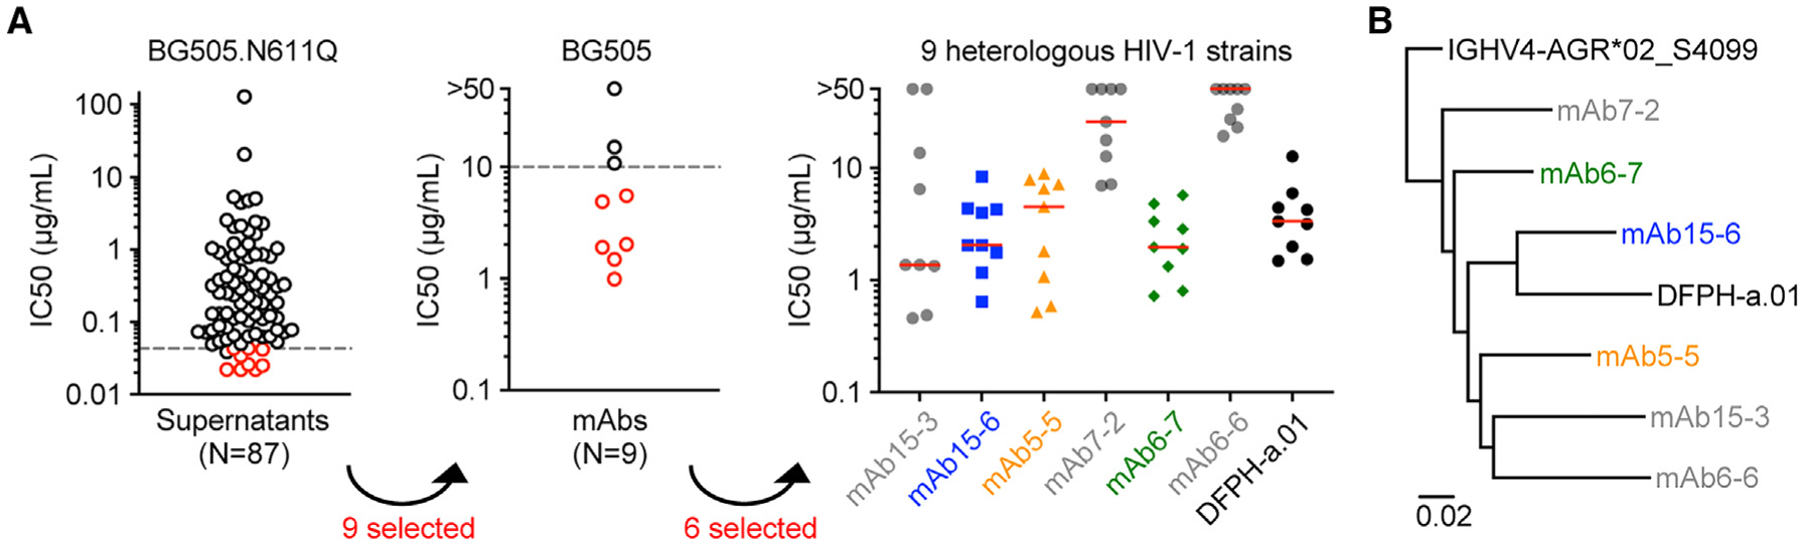
Identifying individual functional B cell receptors (BCRs) is common, but two-dimensional analysis of B cell frequency versus BCR potency would delineate both quantity and quality of antigen-specific memory B cells. We efficiently determine quantitative BCR neutralizing activities using a single-cell-derived antibody supernatant analysis (SCAN) workflow and develop a frequency-potency algorithm to estimate B cell frequencies at various neutralizing activity or binding affinity cutoffs. In an HIV-1 fusion peptide (FP) immunization study, frequency-potency curves elucidate the quantity and quality of FP-specific immunoglobulin G (IgG)+ memory B cells for different animals, time points, and antibody lineages at single-cell resolution. The BCR neutralizing activities are mainly determined by their affinities to soluble envelope trimer. Frequency analysis definitively demonstrates dominant neutralizing antibody lineages. These findings establish SCAN and frequency-potency analyses as promising approaches for general B cell analysis and monoclonal antibody (mAb) discovery. They also provide specific rationales for HIV-1 FP-directed vaccine optimization.

Keywords: B cell receptor; BCR; CP: Immunology; HIV-1; SCAN; antibody; frequency; fusion peptide; potency; single-cell-derived antibody supernatant analysis; vaccine.


Conflict of interest statement

Declaration of interests The authors declare no competing interests.

Figures

Figure 1.
Figure 1.. SCAN-derived neutralization titers are accurate and reproducible
(A) Schematic of the SCAN workflow. (B) Neutralization IC50 value of single-cell-derived supernatant IgGs. A total of 87 supernatants are shown. Red bars indicate median values. (C) Fold differences in neutralization IC50 values between expressed mAbs (N = 38) and their corresponding supernatants. A red bar and error bars indicate median with interquartile range. (D) Correlation between mAb neutralization IC50 values (N = 38) and their corresponding supernatants. Pearson r and p value are shown. A perfect y = x line is shown in red. (E) Neutralization IC50 values of supernatant IgGs from three repeated SCAN analyses of week 39 PBMCs from animal DFPH. IC50 values were determined for 15, 18, and 9 supernatants in repeated assays 1, 2, and 3, respectively. A red bar and error bars indicate geometric mean and SD. (B–E) All neutralization titers are against HIV-1 Env-pseudotyped virus BG505.N611Q. See also Figures S1 and S2 and Table S1.
Figure 2.
Figure 2.. BCR staining showed no impact on supernatant IgG concentration in the SCAN workflow
(A) Step-by-step analysis of antigen-specific IgG+ B cell sampling in the SCAN workflow. Green and gray text boxes indicate cells or single-cell culture supernatants. The red text highlights that staining is the only process that involves BCRs and potentially interferes with B cell proliferation and IgG secretion in the culture. (B–D) Fluorescence intensity of IgG-Alexa 700 (B), FP9-PE (C), and FP9-Cy7APC (D) staining in single-cell index sorting. Each open circle indicates a sorted cell. Cells are categorized into two groups with supernatant IgG concentration above or below 0.15 μg/mL after single-cell culture. A red bar indicates geometric mean. Univariable logistics analyses were performed with odds ratio (OR) β1 and p value shown. Data are from a representative assay on week 39 PBMCs from animal A11V065. (E) Meta-analyses of logistics analysis results from 14 datasets. p values are shown. (F–H) IgG concentrations in single-cell culture supernatants. Each open circle indicates a supernatant. Only those with IgG concentration above 0.15 μg/mL are shown. The x axis shows the fluorescence intensity of IgG-Alexa 700 (F), FP9-PE (G), and FP9-Cy7APC (H) staining of the corresponding sorted cell. Univariable linear regression analyses were performed, with slope (b) and p value shown. Data are from the same assay as in (B)–(D). (I) Meta-analyses of linear regression results from 13 datasets. p values are shown. Of note, one of the original 14 datasets contained only 2 supernatants with IgG concentration above 0.15 μg/mL and so was not qualified for linear regression analysis. See also Figure S3.
Figure 3.
Figure 3.. Frequency-potency of neutralizing cells in antigen-specific and total IgG+ memory B cells
(A) Frequency-potency estimation in antigen-specific or total IgG+ B cells. The data process is shown step by step, along with example frequency-potency curves. Kaplan-Meier estimator was applied to neutralization IC50 values of all supernatants with IgG concentration above 0.15 μg/mL and FP ELISA OD450 above 0.1. The resulting frequency-IC50 curve shows estimated frequencies of antigen-specific IgG+ B cells at the indicated IC50 cutoffs. To estimate the frequencies in total IgG+ B cells, the frequency numbers in the antigen-specific population were further adjusted by the enrichment factors in probe staining and antigen ELISA. Example curves are shown using three repeated assays on the DFPH week 39 sample. (B–F) Frequency-IC50 curves showing the frequency of FP-directed neutralizing cells among total IgG+ B cells. PBMCs from 4 animals are compared at week 39 (B) and week 20 (C). PBMCs from different time points are also compared for individual animals DFPH (D), A11V065 (E), and 13N008 (F).
Figure 4.
Figure 4.. Binding kinetics data on reference mAbs correlate between the single-curve IgG-Trimer method and multi-curve Trimer-Fab method
A panel of 22 FP-directed mAbs was tested. The IgG-Trimer method immobilized IgG on the Octet sensor and tested soluble BG505.DS.SOSIP.S613A trimer as an analyte. The Trimer-Fab method immobilized soluble trimer and tested Fab as an analyte. (A–C) Pearson correlation analysis of KD (A), Ka (B), and Kd (C). Each circle indicates a reference mAb. Pearson r and p values are shown. A perfect y = x line is shown in red. (D) Fold difference of KD, Ka, and Kd values. Each circle indicates a reference mAb. A red bar and error bars indicate median and interquartile range. Gray lines indicate 5-fold differences (ratio of 5 or 0.2). See also Figures S5 and Table S2.
Figure 5.
Figure 5.. BCR affinity to soluble HIV-1 Env SOSIP trimer is the main determinant of vaccine-induced FP-directed neutralizing activities
(A) Apparent KD values of week 39 supernatant IgGs measured by IgG-Trimer method. The BG505.DS.SOSIP.S613A trimer was used. Each circle indicates a supernatant. A red bar indicates median value. Kruskal-Wallis test (p = 0.0249) and Dunn’s multiple-comparisons test were performed. p values from significant pairs are shown. (B) Pearson correlation analysis of KD generated directly from supernatant IgGs or from corresponding Fabs. Each circle indicates a supernatant. Pearson r and p values are shown. A perfect y = x line is shown in red. (C) Apparent KD values of group 1 and group 3 supernatants with the BG505.DS.SOSIP.S613A trimer. Group 1 includes supernatants with BG505.N611Q neutralization IC50 values below 1 μg/mL. Group 3 includes non-neutralizing supernatants or supernatants with IC50 values above 1 μg/mL. A red bar and error bars indicate median and interquartile range. A blue dashed line indicates the highest KD value (2.58 × 10⁻⁸M) in group 1. The blue number indicates that 94% of group 3 supernatants are above the blue line. (D) Pearson correlation analysis of binding affinities and neutralizing activities of supernatants. Pearson r and p values are shown. (A, C, and D) The gray line at “<10−12 M” indicates the measurement limit of the instrument. KD values below the gray line at “10−10 M” were considered qualitative instead of quantitative data. (E) Frequency-KD curves of week 39 B cells in the FP-specific (left) or total (right) IgG+ memory B cell population. Apparent KD values were generated on the BG505.DS.SOSIP.S613A trimer. See also Figures S6 and Table S3.
Figure 6.
Figure 6.. Frequency-potency and affinity maturation of dominant FP-specific neutralizing B cell lineages in immunized NHPs
(A) Two-step Ig heavy-chain sequence recovery for all single B cell cultures that neutralized the BG505.N611Q virus. Step 1: multiplex Ig PCR and Sanger sequencing for all wells. Step 2: SMART-based single-cell RNA sequencing for the remaining wells after step 1 recovery. (B) Percentage of each B cell lineage in the total number of neutralizing B cells sampled from the corresponding PBMC sample. The total numbers are shown above each bar graph. Lineages with a size of five or larger (DFPH-a, A11V065-a, and A11V065-b) are colored. Lineages with members identified from multiple time points (DFPH-a, DFPH-d, and A11V065-c) are also colored. Other lineages are shown in dark or light gray, and cells with no sequence recovery are shown in black. (C) Percentage of heavy chain variable domain (VH) family usage in neutralizing B cells. The total numbers of neutralizing B cells from each PBMC sample are shown above each bar graph. VH1, VH3, and VH4 family usage is colored. No VH2 sequence was recovered. Cells with no sequence recovery are shown in black. (D) Frequency-IC50 curves of individual neutralizing lineages in IgG+ memory B cells. Neutralization IC50 values were generated on the BG505.N611Q virus. The B cell lineages and the time points are indicated. (E) Percent somatic hypermutation (%SHM) of neutralizing BCR heavy-chain sequences. A red bar indicates median value. Kruskal-Wallis test (p < 0.0001) and Dunn’s multiple-comparisons test were performed. p values from significant pairs are shown. See also Table S1.
Figure 7.
Figure 7.. Cross-reactive neutralizing mAbs were efficiently isolated through SCAN
(A) Step-by-step identification of cross-neutralizing mAbs. Left: neutralization IC50 values of 87 supernatants against virus BG505.N611Q. A gray line indicates 10 supernatants with the lowest neutralizing IC50 values. Red circles indicate 9 supernatants with mAbs recovered. Center: neutralization IC50 values against autologous wild-type BG505 by 9 selected mAbs. Red circles indicate 6 mAbs with neutralizing IC50 values below 10 μg/mL (gray line). Right: neutralization IC50 values against a panel of 9 multiclade heterologous wild-type HIV-1 strains by 6 selected mAbs and the reference mAb DFPH-a.01. A red bar indicates median value. (B) Maximum-likelihood tree of heavy-chain nucleotide sequences and the germline gene. See also Table S4.

Similar articles

References

    1. Andrews SF, Chambers MJ, Schramm CA, Plyler J, Raab JE, Kanekiyo M, Gillespie RA, Ransier A, Darko S, Hu J, et al. (2019). Activation Dynamics and Immunoglobulin Evolution of Pre-existing and Newly Generated Human Memory B cell Responses to Influenza Hemagglutinin. Immunity 51, 398–410.e5. 10.1016/j.immuni.2019.06.024. - DOI - PubMed
    1. Gaebler C, Wang Z, Lorenzi JCC, Muecksch F, Finkin S, Tokuyama M, Cho A, Jankovic M, Schaefer-Babajew D, Oliveira TY, et al. (2021). Evolution of antibody immunity to SARS-CoV-2. Nature 591, 639–644. 10.1038/s41586-021-03207-w. - DOI - PMC - PubMed
    1. Zhang Z, Mateus J, Coelho CH, Dan JM, Moderbacher CR, Gálvez RI, Cortes FH, Grifoni A, Tarke A, Chang J, et al. (2022). Humoral and cellular immune memory to four COVID-19 vaccines. Cell 185, 2434–2451.e17. 10.1016/j.cell.2022.05.022. - DOI - PMC - PubMed
    1. Guthmiller JJ, Han J, Li L, Freyn AW, Liu STH, Stovicek O, Stamper CT, Dugan HL, Tepora ME, Utset HA, et al. (2021). First exposure to the pandemic H1N1 virus induced broadly neutralizing antibodies targeting hemagglutinin head epitopes. Sci. Transl. Med 13, eabg4535. 10.1126/scitranslmed.abg4535. - DOI - PMC - PubMed
    1. Joyce MG, Wheatley AK, Thomas PV, Chuang GY, Soto C, Bailer RT, Druz A, Georgiev IS, Gillespie RA, Kanekiyo M, et al. (2016). Vaccine-Induced Antibodies that Neutralize Group 1 and Group 2 Influenza A Viruses. Cell 166, 609–623. 10.1016/j.cell.2016.06.043. - DOI - PMC - PubMed

Publication types