. 2024 Mar 13;16(6):5412-5434.
doi: 10.18632/aging.205655. Epub 2024 Mar 13.

A comprehensive investigation on the receptor BSG expression reveals the potential risk of healthy individuals and cancer patients to 2019-nCoV infection

Affiliations

A comprehensive investigation on the receptor BSG expression reveals the potential risk of healthy individuals and cancer patients to 2019-nCoV infection

Yongbiao Huang et al. Aging (Albany NY). .

Abstract

Background: Coronavirus disease-2019 (COVID-19) pandemic is caused by severe acute respiratory syndrome coronavirus 2 (SARS-CoV-2), a newly emerging coronavirus. BSG (basigin) is involved in the tumorigenesis of multiple tumors and recently emerged as a novel viral entry receptor for SARS-CoV-2. However, its expression profile in normal individuals and cancer patients are still unclear.

Methods: We performed a comprehensive analysis of the expression and distribution of BSG in normal tissues, tumor tissues, and cell lines via bioinformatics analysis and experimental verification. In addition, we investigated the expression of BSG and its isoforms in multiple malignancies and adjacent normal tissues, and explored the prognostic values across pan-cancers. Finally, we conducted function analysis for co-expressed genes with BSG.

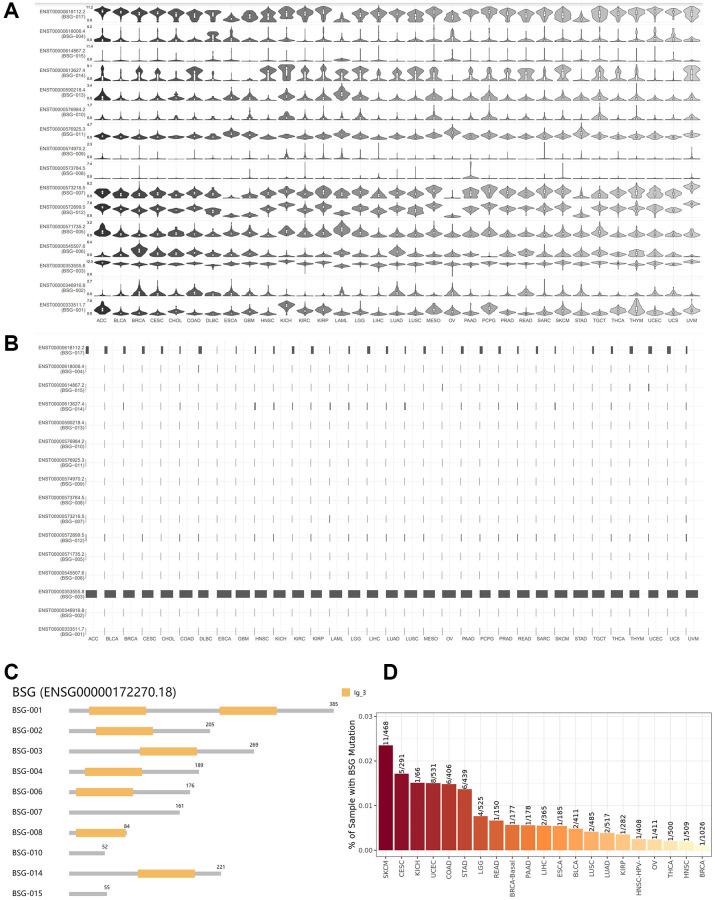
Results: We found BSG was highly conserved in different species, and was ubiquitously expressed in almost all normal tissues and significantly increased in some types of cancer tissues. Moreover, BSG at mRNA expression level was higher than ACE2 in normal lung tissues, and lung cancer tissues. High expression of BSG indicated shorter overall survival (OS) in multiple tumors. The Gene Ontology (GO) and Kyoto Encyclopedia of Genes and Genomes (KEGG) pathway analyses indicated that BSG is mostly enriched in genes for mitochondria electron transport, oxidoreduction-driven active transmembrane transporter activity, mitochondrial inner membrane, oxidative phosphorylation, and genes involving COVID-19.

Conclusions: Our present work emphasized the value of targeting BSG in the treatment of COVID-19 and cancer, and also provided several novel insights for understanding the SARS-CoV-2 pandemic.

Keywords: BSG; COVID-19; SARS-CoV-2; cancer; susceptibility.


Conflict of interest statement

CONFLICTS OF INTEREST: The authors declare no conflicts of interest related to this study.

Figures

Figure 1
Figure 1
Pattern of BSG expression in normal tissues. (A) mRNA and protein expression profiles of BSG in different normal human tissues. (B) BSG mRNA expression in various tissues or organs from Consensus dataset and Fantom5 dataset. (C) BSG protein expression in various tissues or organs based on immunohistochemistry scores.
Figure 2
Figure 2
The concentration of BSG in plasma. (A) BSG protein concentration in plasma. Note: The red dots indicated BSG protein was detected in plasma with about 340 ng/L. (B) Differences between male and female in BSG protein concentration.
Figure 3
Figure 3
Pattern of BSG expression in human blood cells. (A) HPA dataset. (B) Monaco dataset. (C) Schmiedel dataset. X: blood cell types, Y: BSG expression value in transcripts per million (TPM).
Figure 4
Figure 4
Expression of BSG in tumor tissues and cancer cells. (A) mRNA expression levels of BSG (TCGA) across multiple cancer types. (B) Protein expression levels of BSG (CAB002427) across multiple cancer types. (C) Relative mRNA expression levels of ACE2 and BSG in normal lung tissues. (D) Relative mRNA expression levels of ACE2 and BSG in lung cancer tissues. (E) mRNA expression levels of BSG in the multiple cancer and normal cells. The cancer types were color-coded according to which type of normal organ the cancer originates from. The cell lines were classified into 16 color-coded groups according to their organ to which it is from. Abbreviations: TPM: transcripts per million; FPKM, number of fragments per kilobase of exon per million reads.
Figure 5
Figure 5
Isoform usage and structures of BSG across multiple cancer types. (A) Expression patterns of the BSG isoforms in different cancer types. X: cancer types, Y: isoforms of BSG. (B) The isoform usage of BSG in different cancer types. X: cancer types, Y: isoforms of BSG. (C) The structures of multiple BSG isoforms. Multiple isoforms and their protein domain structures are displayed in an interactive plot. (D) The mutant frequency of BSG in different cancer types.
Figure 6
Figure 6
BSG expressions across all tumor samples and paired normal tissues. (A) BSG expression patterns in cancer tissues and normal tissues (TCGA normal + GTEx normal) by dot plots and (B) bar plots. (C) BSG expression was upregulated among the seven types of cancer. (D) BSG expression was downregulated in one cancer type of LAML. The tumor tissue was colored red, whereas the normal tissue was colored dark gray. Right panel displayed the full name of cancer types. The |log2 (fold change)| cutoff was 1; adjusted p-value cutoff was 0.05. *p < 0.05.
Figure 7
Figure 7
Immunohistochemical and RT-qPCR analysis of BSG expression. (A) IHC to validate the expression of BSG in five pairs lung cancer tissues. (B) qPCR to validate the expression of BSG in lung cancer cell lines. (C) qPCR to validate the expression of BSG in five pairs lung cancer tissues. ***p < 0.001.
Figure 8
Figure 8
The prognostic value of BSG across multiple cancer types. (A) Survival heat maps of OS for BSG in 33 TCGA tumor types (the red and blue blocks indicate higher risk and lower risks; the rectangles with frames represent p < 0.05). (BE) Kaplan–Meier curves of OS for BSG in KIRP, LGG, LIHC and LUAD. (F) Survival heat maps of DFS for BSG in 33 TCGA tumor types (the red and blue blocks indicate higher and lower risks; the rectangles with frames represent p < 0.05). (GL) Kaplan–Meier curves of DFS for BSG in BRCA, HNSC, LGG, LIHC, LUAD and UCS. Abbreviations: OS: overall survival; DFS: disease-free survival. Full names of cancer types were shown in Figure 6.
Figure 9
Figure 9
Comparisons of ACE2, HSPA5 and BSG expression in 31 tumors and their matched normal tissues. (A) In this panel, “T” designates tumor tissues and “N” designates normal tissues. The cancer types were displayed on the top. The density of color in each block represents the median expression value of BSG in tissues, and normalized by the maximum median expression value. (B) Homologs and conservations of BSG protein are presented in different species.
Figure 10
Figure 10
GO enrichment analysis and KEGG signaling pathway analysis. (A) Biological processes, (B) molecular functions, (C) cellular components, (D) KEGG analysis, (E) COVID-19 related gene sets 2021, (F) virus perturbations from GEO up, (G) virus perturbations from GEO down. Abbreviations: GO: gene ontology; KEGG: Kyoto encyclopedia of genes and genomes.

Similar articles

References

    1. Wang D, Hu B, Hu C, Zhu F, Liu X, Zhang J, Wang B, Xiang H, Cheng Z, Xiong Y, Zhao Y, Li Y, Wang X, Peng Z. Clinical Characteristics of 138 Hospitalized Patients With 2019 Novel Coronavirus-Infected Pneumonia in Wuhan, China. JAMA. 2020; 323:1061–9. 10.1001/jama.2020.1585 - DOI - PMC - PubMed
    1. Holshue ML, DeBolt C, Lindquist S, Lofy KH, Wiesman J, Bruce H, Spitters C, Ericson K, Wilkerson S, Tural A, Diaz G, Cohn A, Fox L, et al., and Washington State 2019-nCoV Case Investigation Team. First Case of 2019 Novel Coronavirus in the United States. N Engl J Med. 2020; 382:929–36. 10.1056/NEJMoa2001191 - DOI - PMC - PubMed
    1. Zu ZY, Jiang MD, Xu PP, Chen W, Ni QQ, Lu GM, Zhang LJ. Coronavirus Disease 2019 (COVID-19): A Perspective from China. Radiology. 2020; 296:E15–25. 10.1148/radiol.2020200490 - DOI - PMC - PubMed
    1. Dong E, Du H, Gardner L. An interactive web-based dashboard to track COVID-19 in real time. Lancet Infect Dis. 2020; 20:533–4. 10.1016/S1473-3099(20)30120-1 - DOI - PMC - PubMed
    1. Lu R, Zhao X, Li J, Niu P, Yang B, Wu H, Wang W, Song H, Huang B, Zhu N, Bi Y, Ma X, Zhan F, et al.. Genomic characterisation and epidemiology of 2019 novel coronavirus: implications for virus origins and receptor binding. Lancet. 2020; 395:565–74. 10.1016/S0140-6736(20)30251-8 - DOI - PMC - PubMed

Publication types

Substances