A static glucose-stimulated insulin secretion (sGSIS) assay that is significantly predictive of time to diabetes reversal in the human islet bioassay
- PMID: 38485229
- PMCID: PMC10941118
- DOI: 10.1136/bmjdrc-2023-003897
A static glucose-stimulated insulin secretion (sGSIS) assay that is significantly predictive of time to diabetes reversal in the human islet bioassay
Abstract
Introduction: Static incubation (static glucose-stimulated insulin secretion, sGSIS) is a measure of islet secretory function. The Stimulation Index (SI; insulin produced in high glucose/insulin produced in low glucose) is currently used as a product release criterion of islet transplant potency.
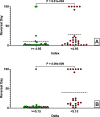
Research design and methods: Our hypothesis was that the Delta, insulin secreted in high glucose minus insulin secreted in low glucose, would be more predictive. To evaluate this hypothesis, sGSIS was performed on 32 consecutive human islet preparations, immobilizing the islets in a slurry of Sepharose beads to minimize mechanical perturbation. Simultaneous full-mass subrenal capsular transplants were performed in chemically induced diabetic immunodeficient mice. Logistic regression analysis was used to determine optimal cut-points for diabetes reversal time and the Fisher Exact Test was used to assess the ability of the Delta and the SI to accurately classify transplant outcomes. Receiver operating characteristic curve analysis was performed on cut-point grouped data, assessing the predictive power and optimal cut-point for each sGSIS potency metric. Finally, standard Kaplan-Meier-type survival analysis was conducted.
Results: In the case of the sGSIS the Delta provided a superior islet potency metric relative to the SI.ConclusionsThe sGSIS Delta value is predicitive of time to diabetes reversal in the full mass human islet transplant bioassay.
Keywords: Insulin Secretion; Islets of Langerhans Transplantation.
© Author(s) (or their employer(s)) 2024. Re-use permitted under CC BY. Published by BMJ.
Conflict of interest statement
Competing interests: RDM is currently employed at the US Food and Drug Administration. AP is currently employed at the National Institutes of Health (NIH). The work presented in this article is relative to their prior employment at the University of Miami.
Figures


Similar articles
-
Microassay for glucose-induced preproinsulin mRNA expression to assess islet functional potency for islet transplantation.Transplantation. 2010 Jan 27;89(2):146-54. doi: 10.1097/TP.0b013e3181c4218d. Transplantation. 2010. PMID: 20098276 Free PMC article.
-
[Isolation and cryopreservation of human islets of Langerhans].Schweiz Med Wochenschr Suppl. 1996;79:25S-29S. Schweiz Med Wochenschr Suppl. 1996. PMID: 8701256 French.
-
Mesenchymal stromal cell secretory molecules improve the functional survival of human islets.Diabet Med. 2023 Dec;40(12):e15227. doi: 10.1111/dme.15227. Epub 2023 Oct 3. Diabet Med. 2023. PMID: 37728506 Free PMC article.
-
Pancreatic islet cell therapy for type I diabetes: understanding the effects of glucose stimulation on islets in order to produce better islets for transplantation.J Transl Med. 2007 Jan 3;5:1. doi: 10.1186/1479-5876-5-1. J Transl Med. 2007. PMID: 17201925 Free PMC article. Review.
-
Building Biomimetic Potency Tests for Islet Transplantation.Diabetes. 2021 Feb;70(2):347-363. doi: 10.2337/db20-0297. Diabetes. 2021. PMID: 33472944 Free PMC article. Review.
Cited by
-
Cell identity dynamics and insight into insulin secretagogues when employing stem cell-derived islets for disease modeling.Front Bioeng Biotechnol. 2024 Jun 12;12:1392575. doi: 10.3389/fbioe.2024.1392575. eCollection 2024. Front Bioeng Biotechnol. 2024. PMID: 38933536 Free PMC article.
-
Sodium-glucose co-transporter 2 inhibitors improve insulin resistance and β-cell function in type 2 diabetes: A meta-analysis.World J Diabetes. 2025 Jul 15;16(7):107335. doi: 10.4239/wjd.v16.i7.107335. World J Diabetes. 2025. PMID: 40697602 Free PMC article.
References
MeSH terms
Substances
Grants and funding
LinkOut - more resources
Full Text Sources
Medical
