

Pharmacokinetic Effects of Different Models of Nonalcoholic Fatty Liver Disease in Transgenic Humanized OATP1B Mice
- PMID: 38485280
- PMCID: PMC11023818
- DOI: 10.1124/dmd.123.001607
Pharmacokinetic Effects of Different Models of Nonalcoholic Fatty Liver Disease in Transgenic Humanized OATP1B Mice
Abstract
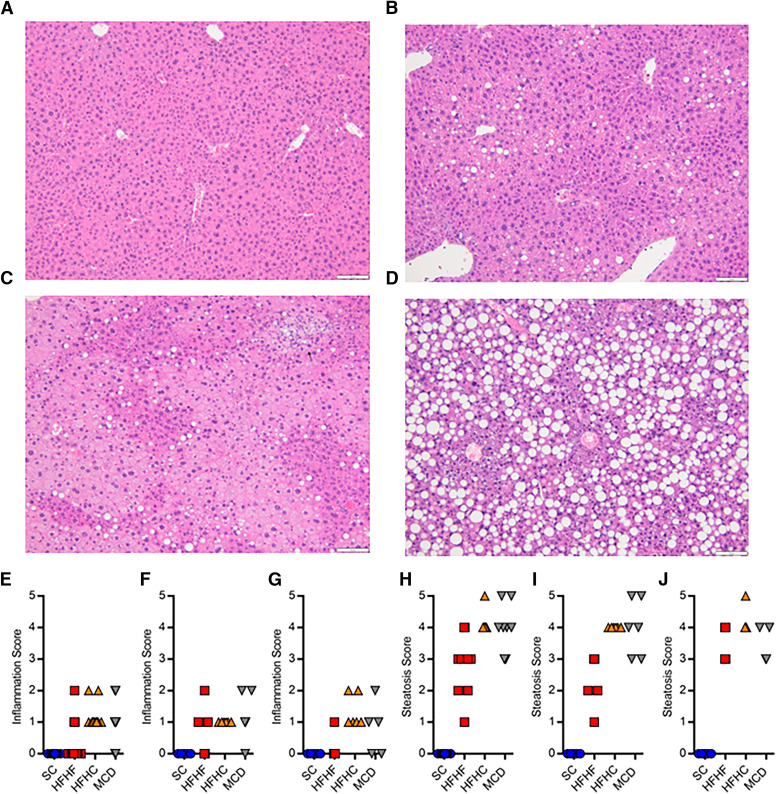
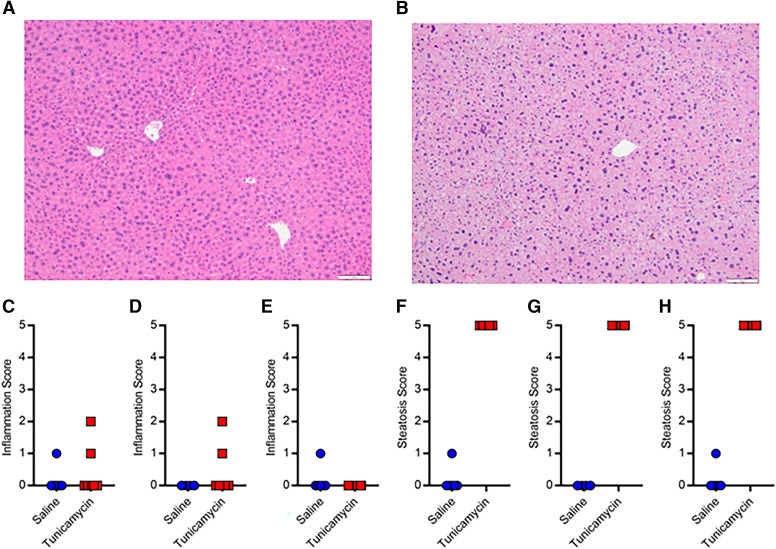
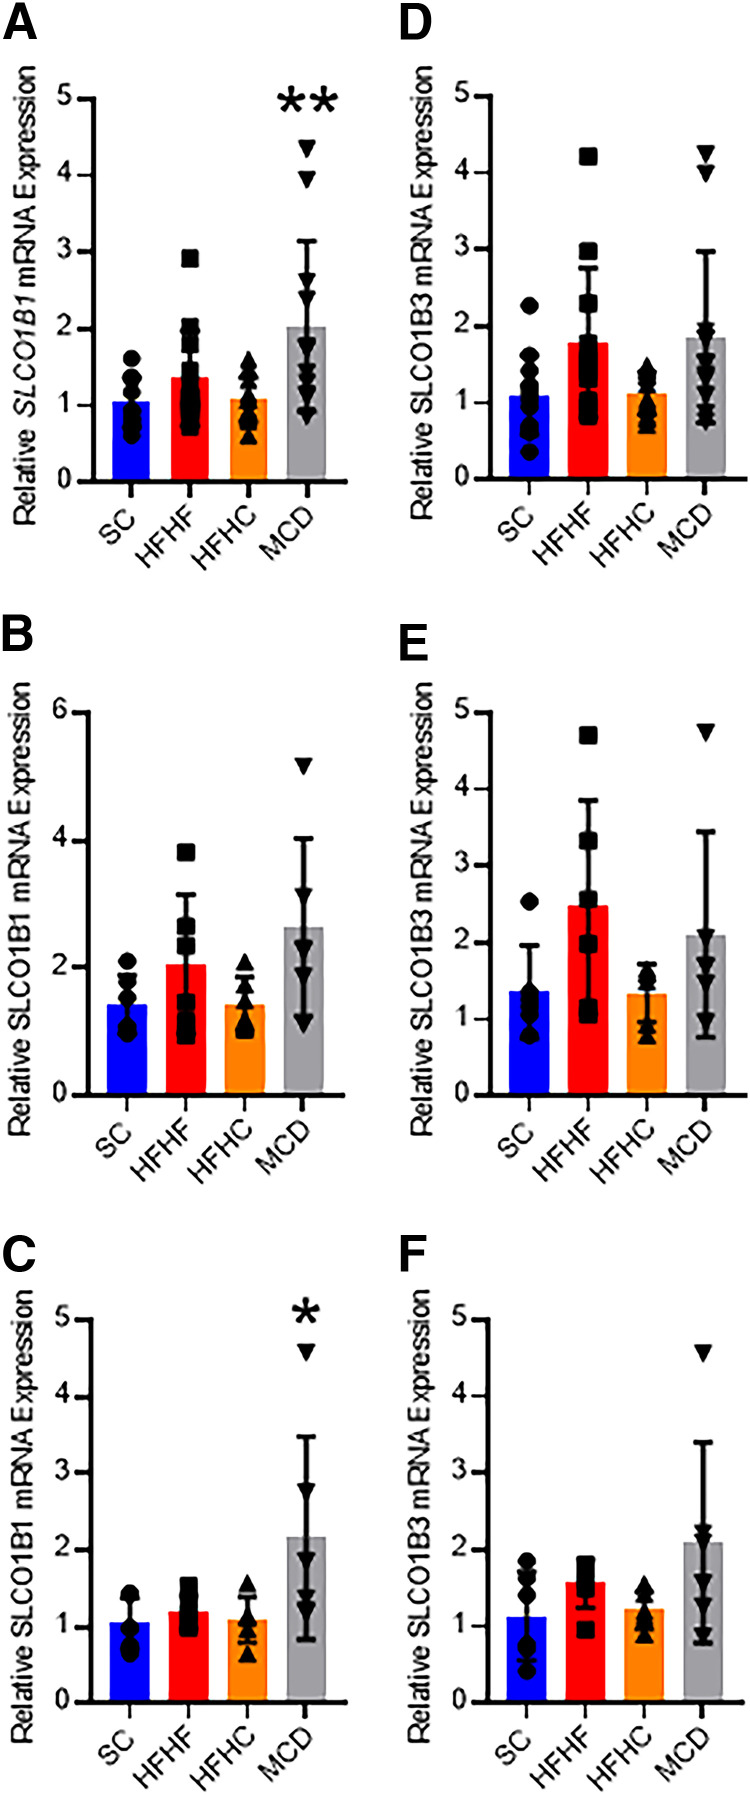
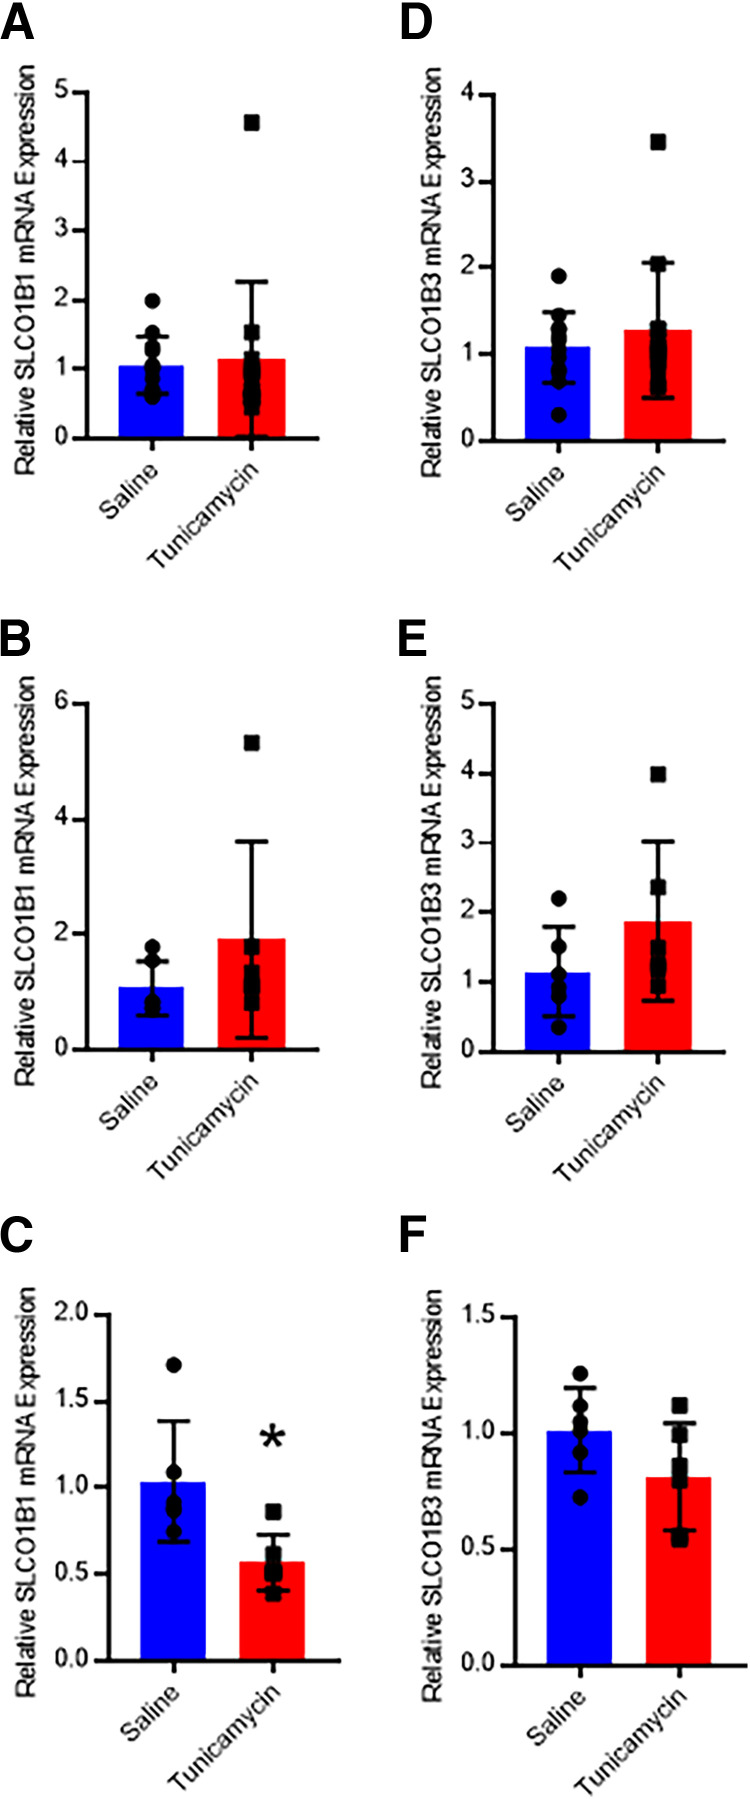
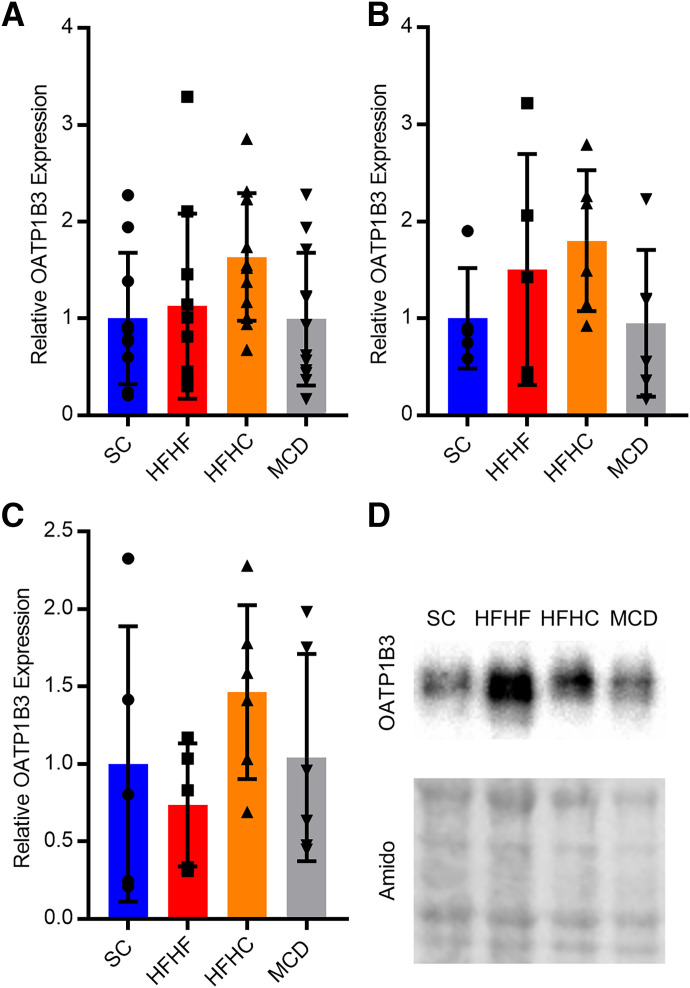
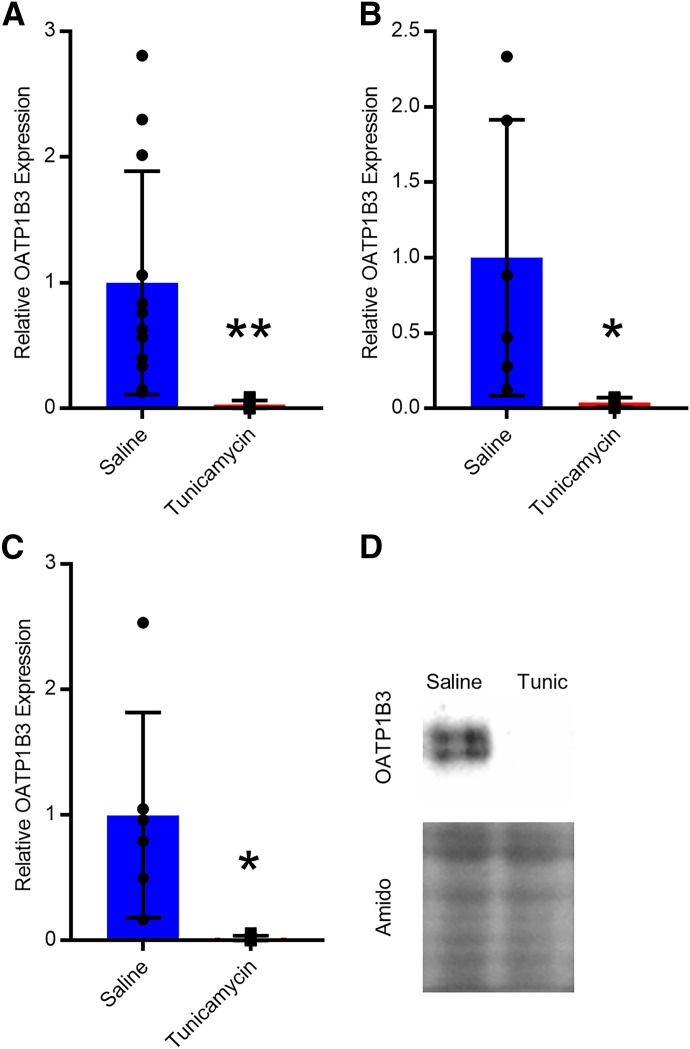
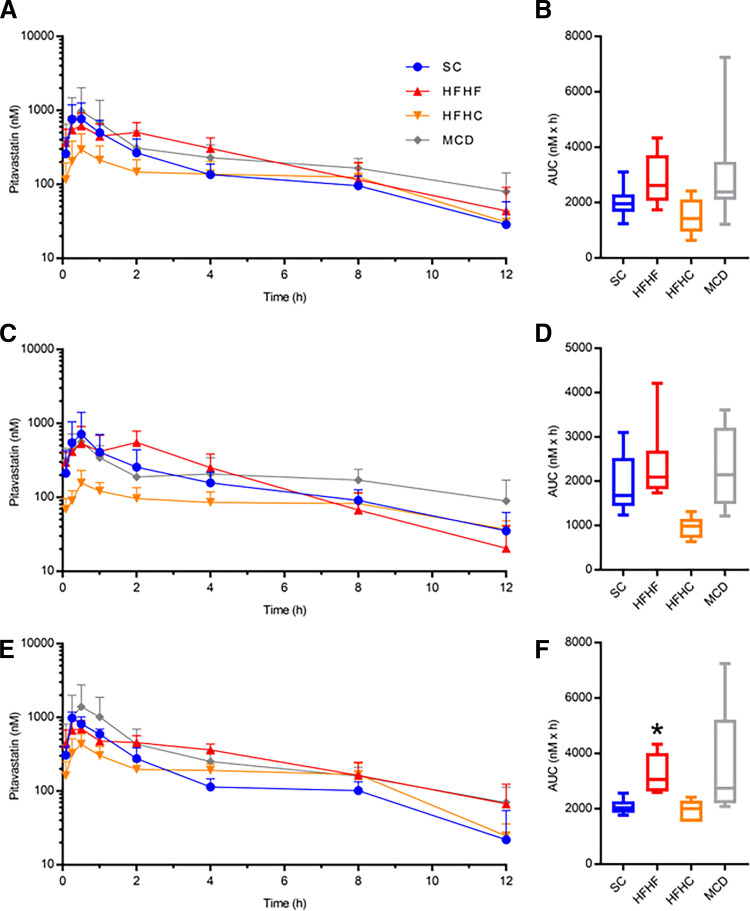
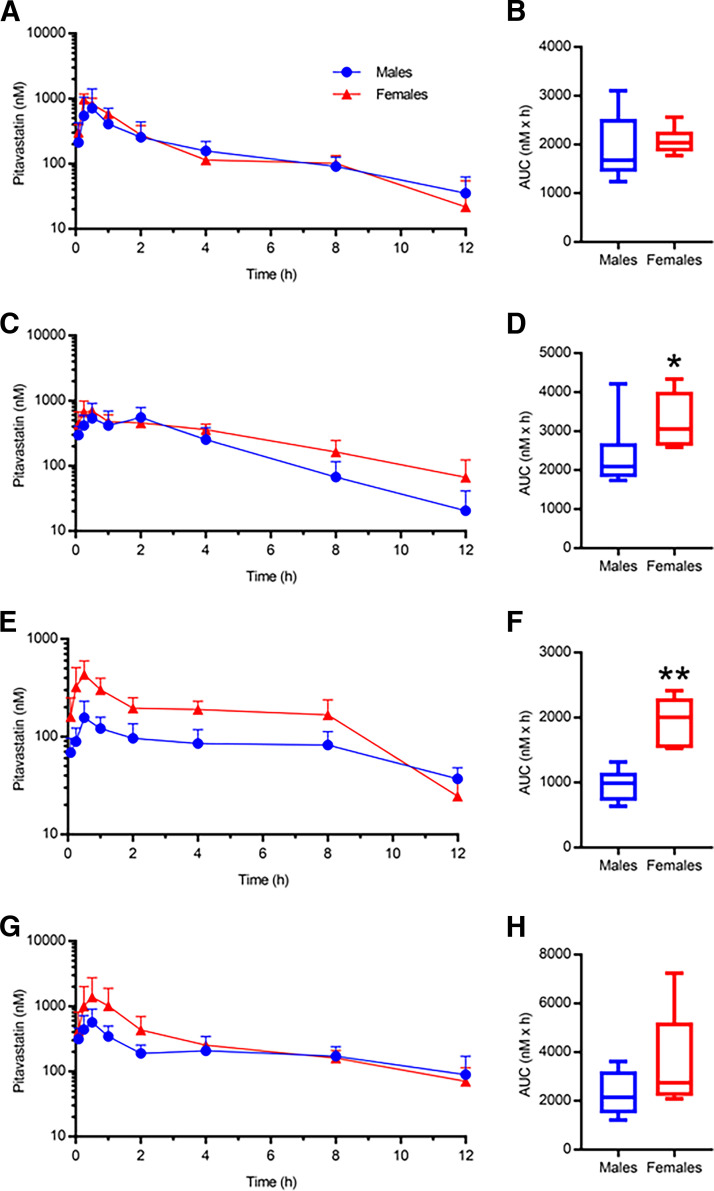
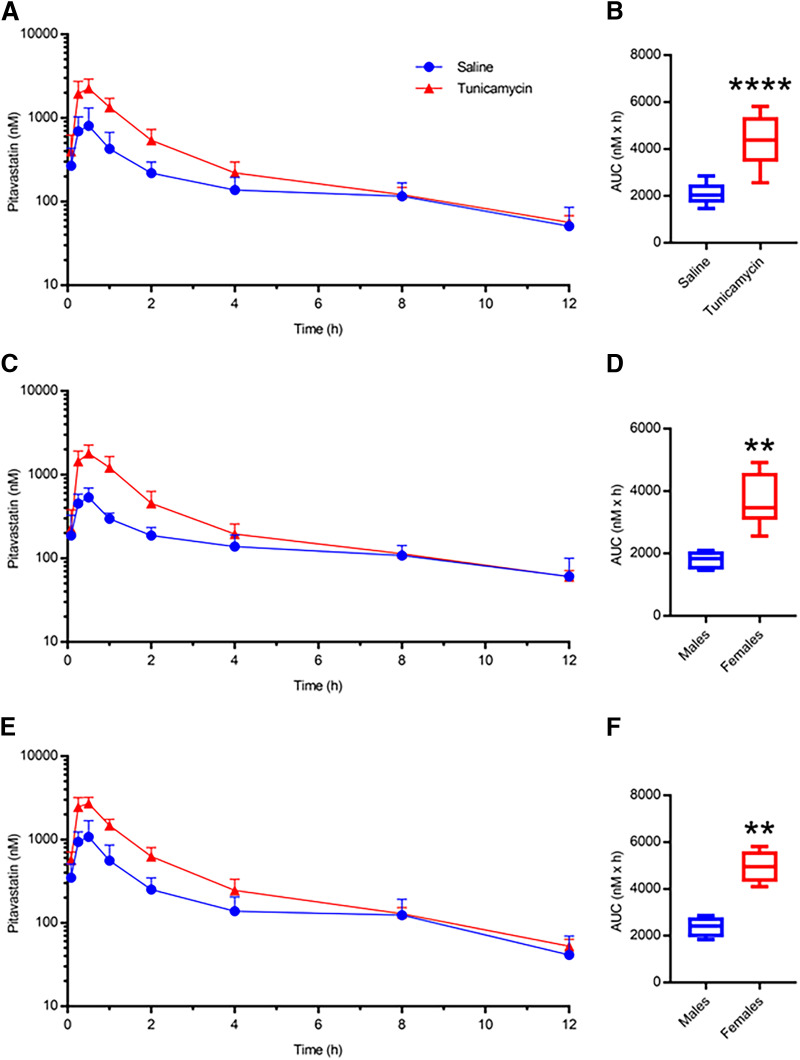
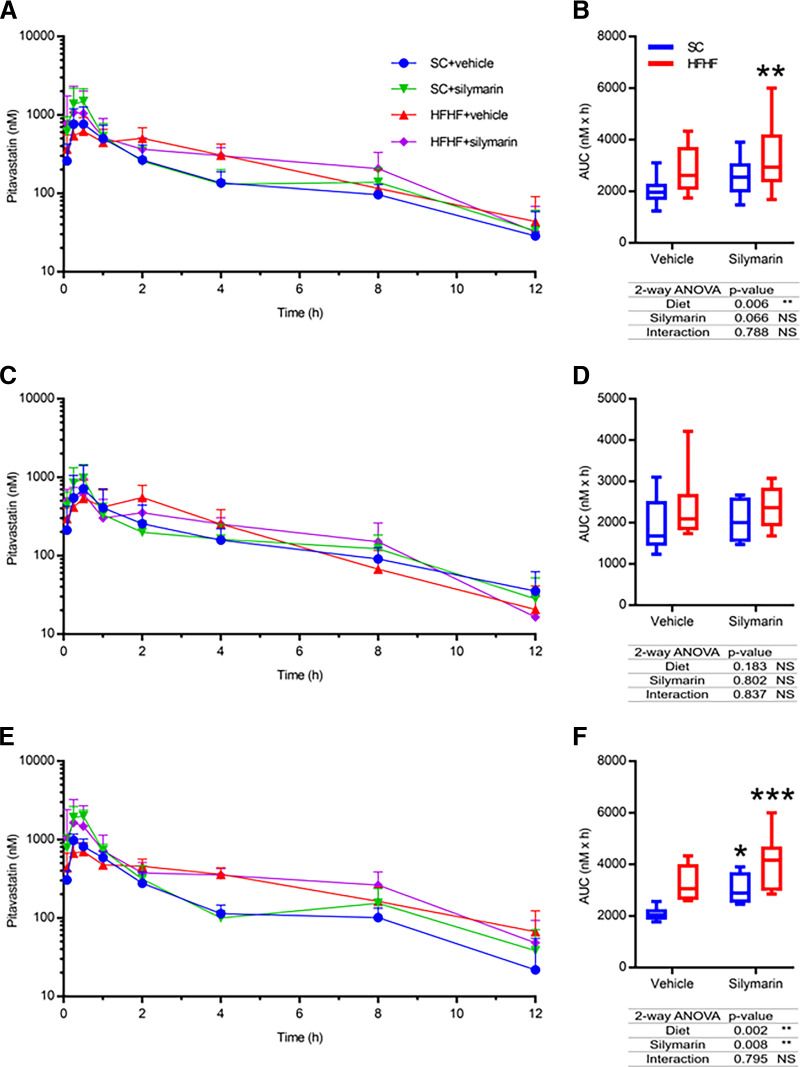
Organic anion transporting polypeptide (OATP) 1B1 and OATP1B3 (collectively, OATP1B) transporters encoded by the solute carrier organic anion transporter (SLCO) genes mediate uptake of multiple pharmaceutical compounds. Nonalcoholic steatohepatitis (NASH), a severe form of nonalcoholic fatty liver disease (NAFLD), decreases OATP1B abundance. This research characterized the pathologic and pharmacokinetics effects of three diet- and one chemical-induced NAFLD model in male and female humanized OATP1B mice, which comprises knock-out of rodent Oatp orthologs and insertion of human SLCO1B1 and SLCO1B3. Histopathology scoring demonstrated elevated steatosis and inflammation scores for all NAFLD-treatment groups. Female mice had minor changes in SLCO1B1 expression in two of the four NAFLD treatment groups, and pitavastatin (PIT) area under the concentration-time curve (AUC) increased in female mice in only one of the diet-induced models. OATP1B3 expression decreased in male and female mice in the chemical-induced NAFLD model, with a coinciding increase in PIT AUC, indicating the chemical-induced model may better replicate changes in OATP1B3 expression and OATP substrate disposition observed in NASH patients. This research also tested a reported multifactorial pharmacokinetic interaction between NAFLD and silymarin, an extract from milk thistle seeds with notable OATP-inhibitory effects. Males showed no change in PIT AUC, whereas female PIT AUC increased 1.55-fold from the diet alone and the 1.88-fold from the combination of diet with silymarin, suggesting that female mice are more sensitive to pharmacokinetic changes than male mice. Overall, the humanized OATP1B model should be used with caution for modeling NAFLD and multifactorial pharmacokinetic interactions. SIGNIFICANCE STATEMENT: Advanced stages of NAFLD cause decreased hepatic OATP1B abundance and increase systemic exposure to OATP substrates in human patients. The humanized OATP1B mouse strain may provide a clinically relevant model to recapitulate these observations and predict pharmacokinetic interactions in NAFLD. This research characterized three diet-induced and one drug-induced NAFLD model in a humanized OATP1B mouse model. Additionally, a multifactorial pharmacokinetic interaction was observed between silymarin and NAFLD.
Copyright © 2024 by The Author(s).
Figures
Similar articles
-
Rifampin- and Silymarin-Mediated Pharmacokinetic Interactions of Exogenous and Endogenous Substrates in a Transgenic OATP1B Mouse Model.Mol Pharm. 2024 May 6;21(5):2284-2297. doi: 10.1021/acs.molpharmaceut.3c01088. Epub 2024 Mar 26. Mol Pharm. 2024. PMID: 38529622 Free PMC article.
-
Characterization of organic anion transporting polypeptide (OATP)1B1 and OATP1B3 humanized rat as a translational model to study the pharmacokinetics of OATP1B substrate drugs.Drug Metab Dispos. 2025 Jul;53(7):100101. doi: 10.1016/j.dmd.2025.100101. Epub 2025 Jun 2. Drug Metab Dispos. 2025. PMID: 40554317
-
Hepatic organic anion transporting polypeptides mediate disposition of milk thistle flavonolignans and pharmacokinetic silymarin-drug interactions.Phytother Res. 2021 Jun;35(6):3286-3297. doi: 10.1002/ptr.7049. Epub 2021 Feb 15. Phytother Res. 2021. PMID: 33587330 Free PMC article.
-
Impact of OATP transporters on pharmacokinetics.Br J Pharmacol. 2009 Oct;158(3):693-705. doi: 10.1111/j.1476-5381.2009.00430.x. Epub 2009 Sep 25. Br J Pharmacol. 2009. PMID: 19785645 Free PMC article. Review.
-
Organic anion transporting polypeptide (OATP)1B1 and OATP1B3 as important regulators of the pharmacokinetics of substrate drugs.Biol Pharm Bull. 2015;38(2):155-68. doi: 10.1248/bpb.b14-00767. Biol Pharm Bull. 2015. PMID: 25747975 Review.
Cited by
-
TNBS colitis induces architectural changes and alpha-synuclein overexpression in mouse distal colon: A morphological study.Cell Tissue Res. 2025 Feb;399(2):247-265. doi: 10.1007/s00441-024-03932-4. Epub 2024 Dec 10. Cell Tissue Res. 2025. PMID: 39656240 Free PMC article.
References
-
- Charlton M, Krishnan A, Viker K, Sanderson S, Cazanave S, McConico A, Masuoko H, Gores G (2011) Fast food diet mouse: novel small animal model of NASH with ballooning, progressive fibrosis, and high physiological fidelity to the human condition. Am J Physiol Gastrointest Liver Physiol 301:G825–G834. - PMC - PubMed
MeSH terms
Substances
Grants and funding
LinkOut - more resources
Full Text Sources
Medical
