

Mechanisms of Exercise Intolerance Across the Breast Cancer Continuum: A Pooled Analysis of Individual Patient Data
- PMID: 38485730
- PMCID: PMC10948020
- DOI: 10.1249/MSS.0000000000003348
Mechanisms of Exercise Intolerance Across the Breast Cancer Continuum: A Pooled Analysis of Individual Patient Data
Abstract
Purpose: The purpose of this study is to evaluate the prevalence of abnormal cardiopulmonary responses to exercise and pathophysiological mechanism(s) underpinning exercise intolerance across the continuum of breast cancer (BC) care from diagnosis to metastatic disease.
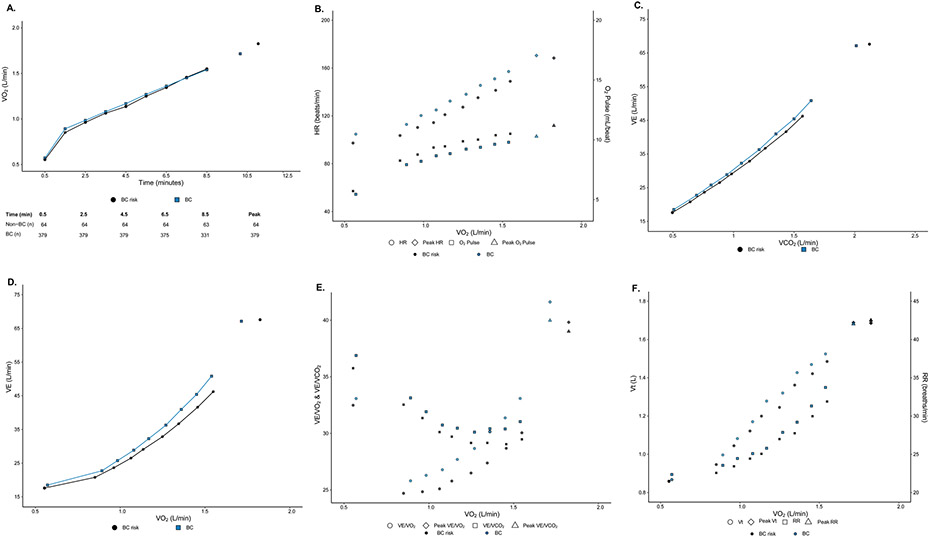
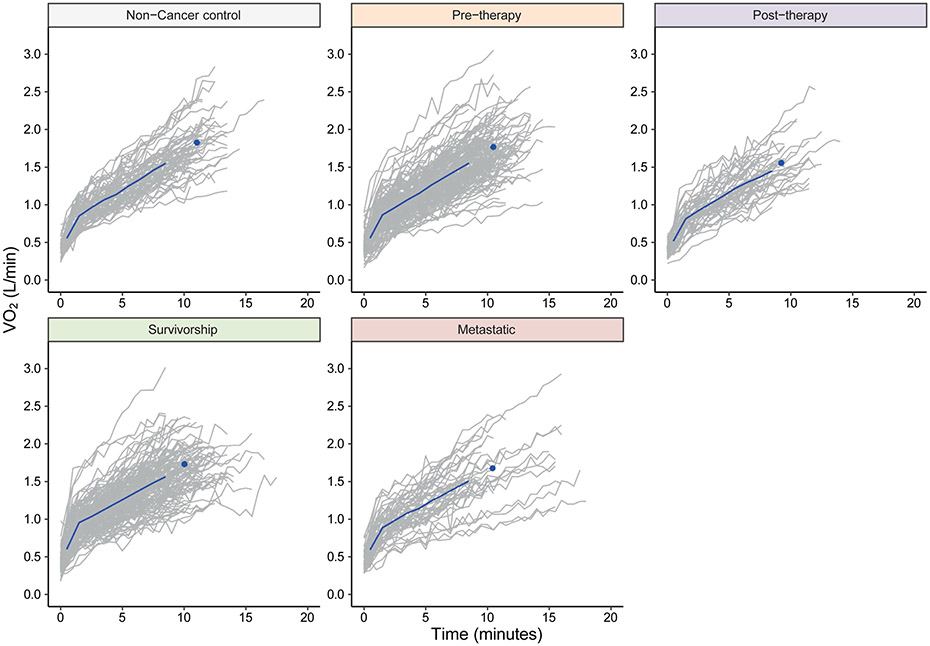
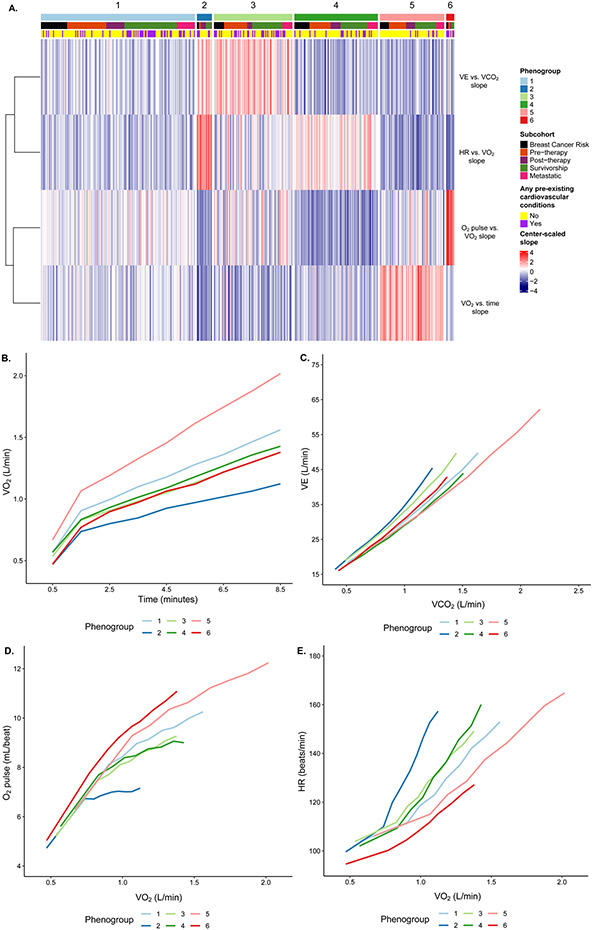
Methods: Individual participant data from four randomized trials spanning the BC continuum ([1] prechemotherapy [n = 146], [2] immediately postchemotherapy [n = 48], [3] survivorship [n = 138], and [4] metastatic [n = 47]) were pooled and compared with women at high-risk of BC (BC risk; n = 64). Identical treadmill-based peak cardiopulmonary exercise testing protocols evaluated exercise intolerance (peak oxygen consumption; V̇O2peak) and other resting, submaximal, and peak cardiopulmonary responses. The prevalence of 12 abnormal exercise responses was evaluated. Graphical plots of exercise responses were used to identify oxygen delivery and/or uptake mechanisms contributing to exercise intolerance. Unsupervised, hierarchical cluster analysis was conducted to explore exercise response phenogroups.
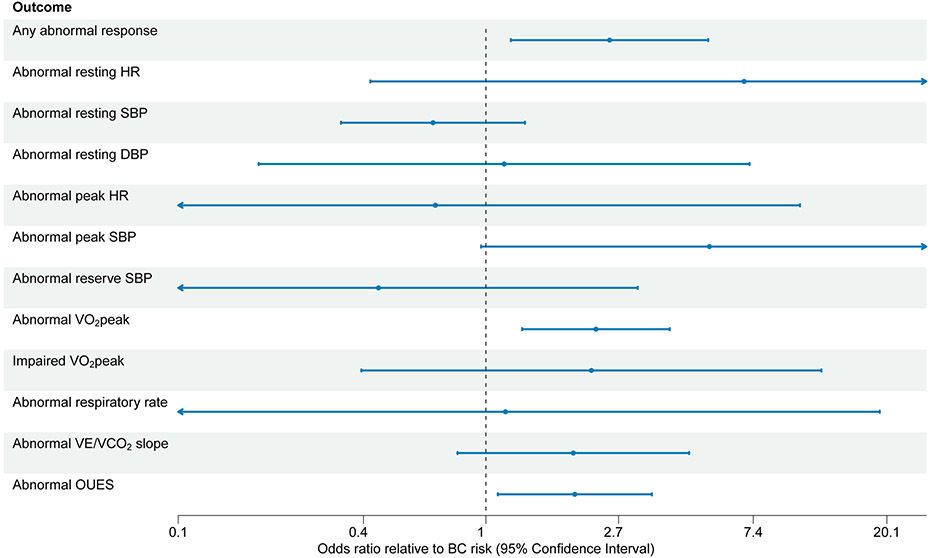
Results: Mean V̇O2peak was 2.78 ml O2.kg-1·min-1 (95% confidence interval [CI], -3.94, -1.62 mL O2.kg-1·min-1; P < 0.001) lower in the pooled BC cohort (52 ± 11 yr) than BC risk (55 ± 10 yr). Compared with BC risk, the pooled BC cohort had a 2.5-fold increased risk of any abnormal cardiopulmonary response (odds ratio, 2.5; 95% confidence interval, 1.2, 5.3; P = 0.014). Distinct exercise responses in BC reflected impaired oxygen delivery and uptake relative to control, although considerable inter-individual heterogeneity within cohorts was observed. In unsupervised, hierarchical cluster analysis, six phenogroups were identified with marked differences in cardiopulmonary response patterns and unique clinical characteristics.
Conclusions: Abnormal cardiopulmonary response to exercise is common in BC and is related to impairments in oxygen delivery and uptake. The identification of exercise response phenogroups could help improve cardiovascular risk stratification and guide investigation of targeted exercise interventions.
Copyright © 2023 by the American College of Sports Medicine.
Figures
Similar articles
-
Case-control study of heart rate abnormalities across the breast cancer survivorship continuum.Cancer Med. 2019 Jan;8(1):447-454. doi: 10.1002/cam4.1916. Epub 2018 Dec 21. Cancer Med. 2019. PMID: 30578624 Free PMC article.
-
Exercise Intolerance in Anthracycline-Treated Breast Cancer Survivors: The Role of Skeletal Muscle Bioenergetics, Oxygenation, and Composition.Oncologist. 2020 May;25(5):e852-e860. doi: 10.1634/theoncologist.2019-0777. Epub 2020 Jan 17. Oncologist. 2020. PMID: 31951302 Free PMC article.
-
Clinical phenogroup diversity and multiplicity: Impact on mechanisms of exercise intolerance in heart failure with preserved ejection fraction.Eur J Heart Fail. 2024 Mar;26(3):564-577. doi: 10.1002/ejhf.3105. Epub 2024 Jan 18. Eur J Heart Fail. 2024. PMID: 38156712 Free PMC article.
-
Determinants of oxygen utilization in breast cancer: Similarities between heart failure with preserved ejection fraction.Prog Cardiovasc Dis. 2022 Sep-Oct;74:45-52. doi: 10.1016/j.pcad.2022.10.005. Epub 2022 Oct 22. Prog Cardiovasc Dis. 2022. PMID: 36279949 Review.
-
Confirming the attainment of maximal oxygen uptake within special and clinical groups: A systematic review and meta-analysis of cardiopulmonary exercise test and verification phase protocols.PLoS One. 2024 Mar 28;19(3):e0299563. doi: 10.1371/journal.pone.0299563. eCollection 2024. PLoS One. 2024. PMID: 38547136 Free PMC article.
Cited by
-
Exercise pressor responses are exaggerated relative to force production during, but not following, thirty-minutes of rhythmic handgrip exercise.Eur J Appl Physiol. 2024 May;124(5):1547-1559. doi: 10.1007/s00421-023-05390-2. Epub 2023 Dec 29. Eur J Appl Physiol. 2024. PMID: 38155209
-
Tumor bearing in untreated breast cancer decreases exercise tolerance without lowering maximal oxygen uptake in rats.Am J Cancer Res. 2025 Feb 15;15(2):487-500. doi: 10.62347/QCCZ2316. eCollection 2025. Am J Cancer Res. 2025. PMID: 40084375 Free PMC article.
-
Effects of Aerobic Exercise on Cardiorespiratory Fitness and Cardiovascular Risk Factors in Long-Term Breast Cancer Survivors: A Randomized Controlled Trial.JACC CardioOncol. 2025 Jun;7(4):414-426. doi: 10.1016/j.jaccao.2025.04.006. JACC CardioOncol. 2025. PMID: 40537190 Free PMC article.
References
-
- ATS/ACCP Statement on cardiopulmonary exercise testing. Am J Respir Crit Care Med. 2003;167(2):211–77. - PubMed
-
- Jones LW, Eves ND, Haykowsky M, Freedland SJ, Mackey JR. Exercise intolerance in cancer and the role of exercise therapy to reverse dysfunction. Lancet Oncol. 2009;10(6):598–605. - PubMed
-
- Christensen RAG, Knight JA, Sutradhar R, Brooks JD. Association between estimated cardiorespiratory fitness and breast cancer: a prospective cohort study. Br J Sports Med. 2023;57(19):1238–47. - PubMed
MeSH terms
Substances
Grants and funding
LinkOut - more resources
Full Text Sources
Medical
Miscellaneous
