. 2024 Mar 14;7(1):328.
doi: 10.1038/s42003-024-06024-9.

Disparity of cycad leaves dispels the living fossil metaphor

Affiliations

Disparity of cycad leaves dispels the living fossil metaphor

Mario Coiro et al. Commun Biol. .

Abstract

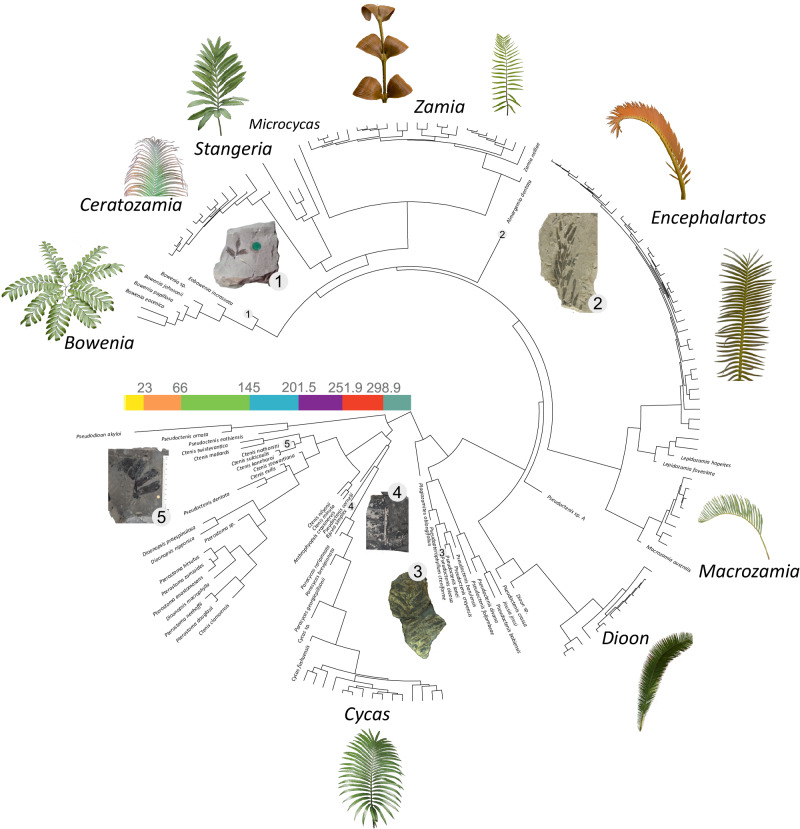
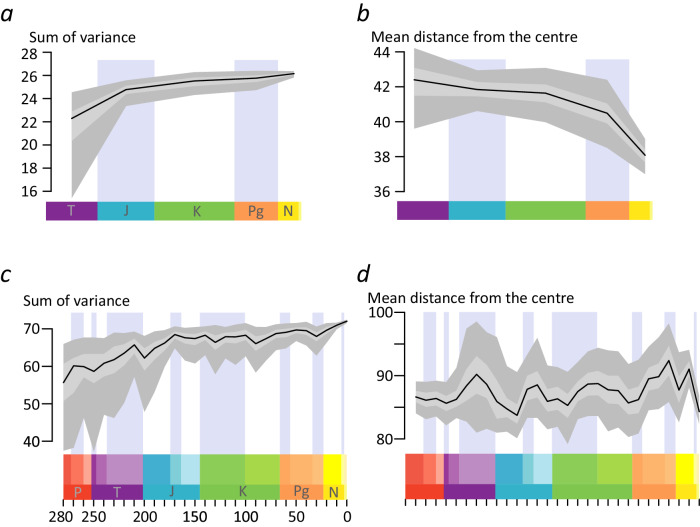
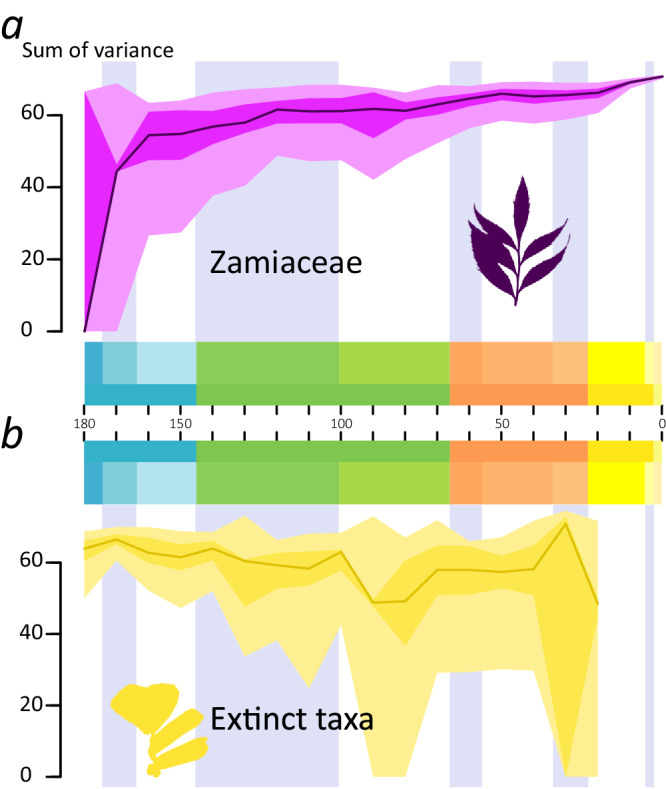
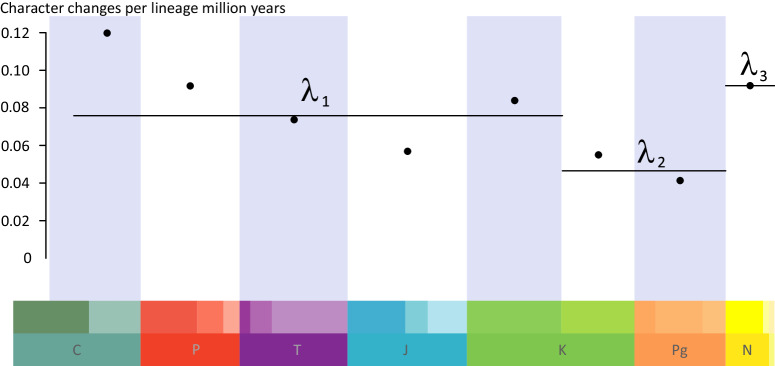
The living fossil metaphor is tightly linked with the cycads. This group of gymnosperms is supposed to be characterised by long-term morphological stasis, particularly after their peak of diversity and disparity in the Jurassic. However, no formal test of this hypothesis exists. Here, we use a recent phylogenetic framework and an improved character matrix to reconstruct the Disparity Through Time for cycad leaves using a Principal Coordinate Analysis and employing Pre-Ordination Ancestral State Reconstruction to test the impact of sampling on the results. Our analysis shows that the cycad leaf morsphospace expanded up to the present, with numerous shifts in its general positioning, independently of sampling biases. Moreover, they also show that Zamiaceae expanded rapidly in the Early Cretaceous and continued to expand up to the present, while now-extinct clades experienced a slow contraction from their peak in the Triassic. We also show that rates of evolution were constantly high up to the Early Cretaceous, and then experienced a slight decrease in the Paleogene, followed by a Neogene acceleration. These results show a much more dynamic history for cycads, and suggest that the 'living fossil' metaphor is actually a hindrance to our understanding of their macroevolution.


Conflict of interest statement

The authors declare no competing interest.

Figures

Fig. 1
Fig. 1. Trimmed time-calibrated consensus tree from Coiro et al. used in this study.
Leaves of Bowenia spectabilis Hook. ex Hook.f., Ceratozamia chimalapensis Pérez-Farr. & Vovides, Stangeria eriopus (Kunze) Baill., Zamia imperialis A.S.Taylor, J.L.Haynes & Holzman, Zamia sp., Encephalartos lehmannii Lehm., Encephalartos inopinus R.A.Dyer, Macrozamia secunda C.Moore, Dioon edule Lindl., and Cycas thouarsii R.Br. are shown as examples of extant cycad leaf diversity. Fossils of Eobowenia incrassata (S.Archang.) M.Coiro & C.Pott (1), Almargemia dentata Florin (2), Pseudoctenis oleosa Harris (3), Bjuvia simplex Florin (4), and Ctenis nathorstii Möller (5) are shown as examples of cycad fossil leaf diversity. Images are not to scale. Extant cycad images courtesy of Michael Calonje, except Dioon edule who has been taken by the authors. Image of Almargemia dentata from Coiro & Pott, used under a CC BY 4.0 license.
Fig. 2
Fig. 2. Scatter plots for the first eight Principal Coordinate Analysis axes (PC1-PC8) for the Only Taxa morphospace (top) and the Pre-Ordination Ancestral State Reconstruction morphospace (bottom).
Tips and nodes for Zamiaceae are coloured in purple, Cycadaceae in green, and extinct cycads in yellow. The figure shows that the first PcoA axis (PC1) separates Zamiaceae from the rest of the cycads, and that in general the three groups of cycads occupy different parts of the morphospace. On the bottom graphs, the root node is coloured in red, and the phylogenetic relationships are indicated with grey lines.
Fig. 3
Fig. 3. Disparity-Through-Time (DTT) plots of cycad leaves, showing a more dynamic pattern than expected from stasis and/or post-Jurassic decline.
a DTT plot of the sum of the variance of the ‘OT’ analysis, i.e. including only the tips of the cycad tree, showing an increase of the morphospace of cycad leaves up to the present. b DTT plot of the mean distance from the centre of the ‘OT’ analysis, showing the placement of the morphospace moving through time up to the present. c DTT plot of the sum of variance of the Pre-Ordination Ancestral Reconstruction analysis. d DTT plot of the mean distance from the centre of the pre-ordination ancestral reconstruction analysis. Both c and d show a similar but more complex pattern than a and b. Black line indicates the bootstrapped median, light grey indicates the 25%-75% percentiles, dark grey indicates the 2.5–97.5% percentiles.
Fig. 4
Fig. 4. Disparity-Through-Time (DTT) plots of different cycad groups from the Middle Jurassic to the Present.
a DTT plot of the sum of the variance of leaves of the Zamiaceae using the morphospace from the Pre-Ordination Ancestral Reconstruction analysis. The graph shows that in the Zamiaceae there is a fast increase during the early phase of the evolution of the group, followed by a slower increase up to a peak in the Early Cretaceous. b DTT plot of the sum of the variance of leaves of extinct cycads, i.e. excluding the crown groups of Zamiaceae and Cycadaceae. In the extinct taxa, it shows a gradual decrease with a low valley in the Late Cretaceous, with the lowest disparity reached before their extinction in the Neogene. The black line indicates the bootstrapped median, light grey indicates the 25–75% percentiles, dark grey indicates the 2.5–97.5% percentiles.
Fig. 5
Fig. 5. Rates through time plot for all the characters across the cycad phylogeny, showing high rates between the Carboniferous and the Early Cretaceous (λ1), lower rates during the Late Cretaceous and the Paleogene (λ2), and the highest rates during the Neogene (λ3).
Points represent estimates for each time bin, while lines represent estimates from the best model including three rates.
Fig. 6
Fig. 6. Model for rates of morphological evolution across the tree, testing whether lineages inferred to have acquired nitrogen fixation have different rates than the other cycads.
Though the best model has a single rate across the tree, the second model shows an increased rate in crown group Zamiaceae. A model with Cycadaceae having lower rates is significantly worse than the best model (ΔAICc =2).

References

    1. Darwin CR. On the origin of species by means of natural selection. London: John Murray; 1859.
    1. Turner DD. In defense of living fossils. Biol. Philos. 2019;34:23. doi: 10.1007/s10539-019-9678-y. - DOI
    1. Lidgard S, Love AC. Rethinking living fossils. BioScience. 2018;68:760–770. doi: 10.1093/biosci/biy084. - DOI - PMC - PubMed
    1. Lidgard S, Love AC. The living fossil concept: reply to Turner. Biol. Philos. 2021;36:13. doi: 10.1007/s10539-021-09789-z. - DOI
    1. Olson ME, Arroyo-Santos A, Vergara-Silva F. A user’s guide to metaphors in ecology and evolution. Trends Ecol. Evol. 2019;34:605–615. doi: 10.1016/j.tree.2019.03.001. - DOI - PubMed

Publication types