. 2024 Apr;43(8):1545-1569.
doi: 10.1038/s44318-024-00065-w. Epub 2024 Mar 14.

Metabolic priming by multiple enzyme systems supports glycolysis, HIF1α stabilisation, and human cancer cell survival in early hypoxia

Affiliations

Metabolic priming by multiple enzyme systems supports glycolysis, HIF1α stabilisation, and human cancer cell survival in early hypoxia

Fiona Grimm et al. EMBO J. 2024 Apr.

Abstract

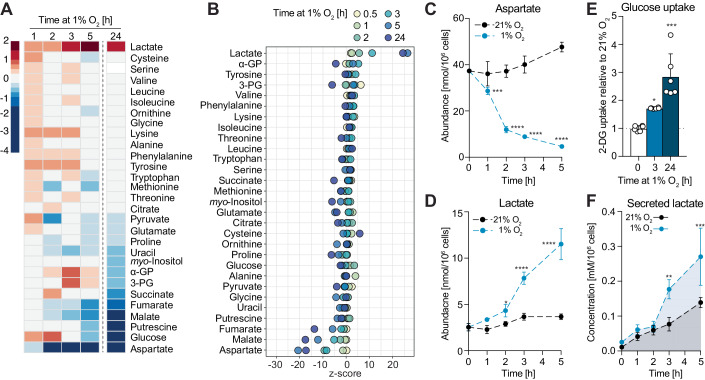
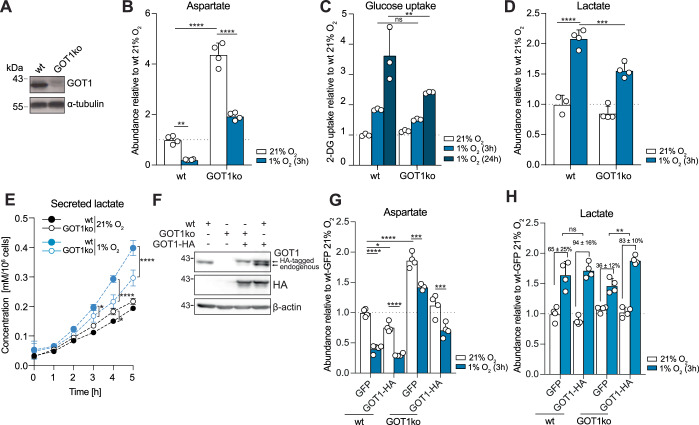
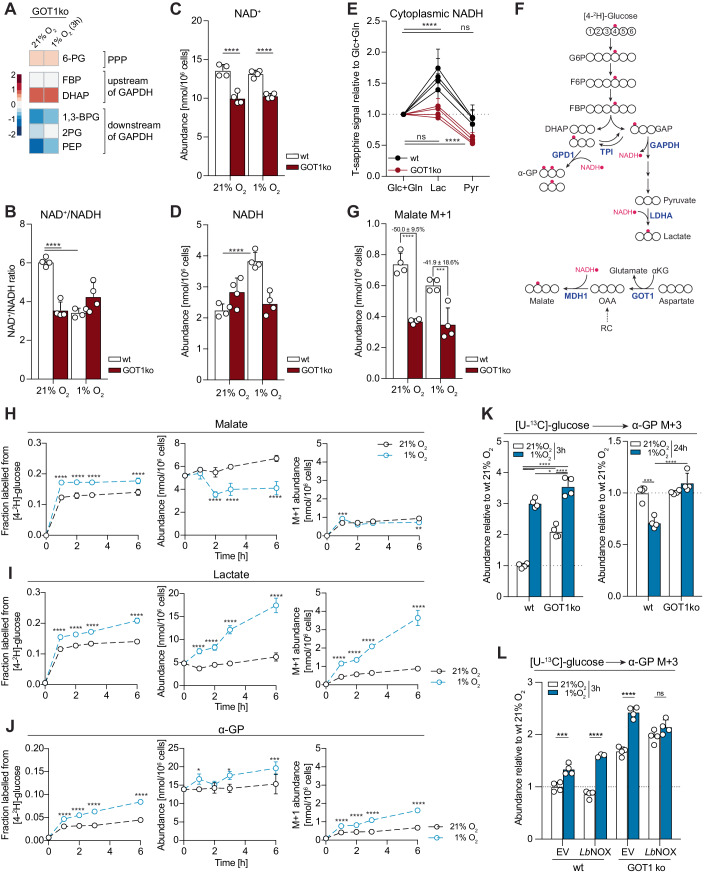
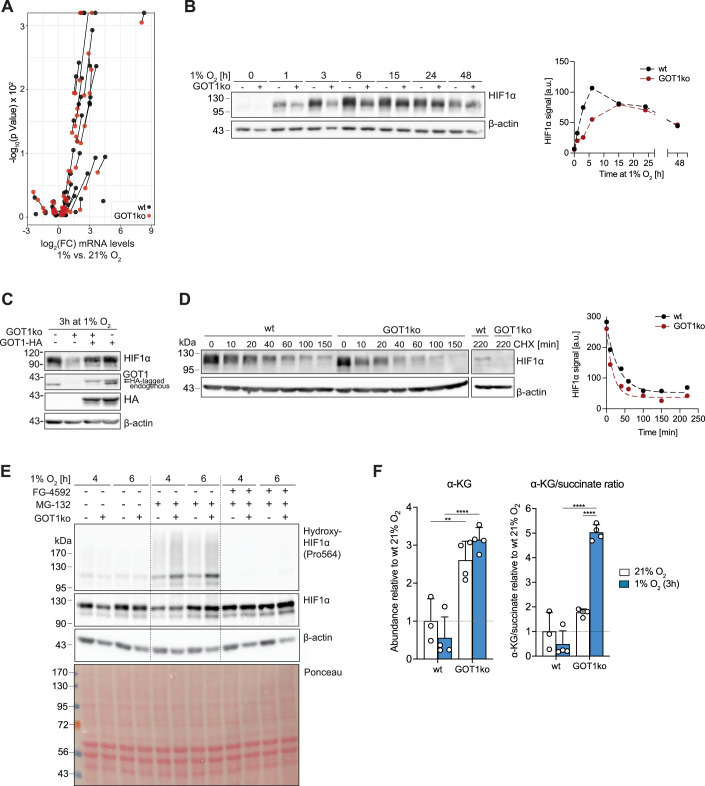
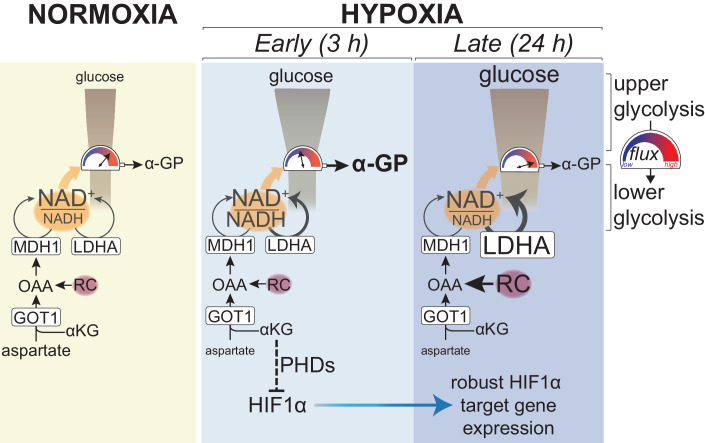
Adaptation to chronic hypoxia occurs through changes in protein expression, which are controlled by hypoxia-inducible factor 1α (HIF1α) and are necessary for cancer cell survival. However, the mechanisms that enable cancer cells to adapt in early hypoxia, before the HIF1α-mediated transcription programme is fully established, remain poorly understood. Here we show in human breast cancer cells, that within 3 h of hypoxia exposure, glycolytic flux increases in a HIF1α-independent manner but is limited by NAD+ availability. Glycolytic ATP maintenance and cell survival in early hypoxia rely on reserve lactate dehydrogenase A capacity as well as the activity of glutamate-oxoglutarate transaminase 1 (GOT1), an enzyme that fuels malate dehydrogenase 1 (MDH1)-derived NAD+. In addition, GOT1 maintains low α-ketoglutarate levels, thereby limiting prolyl hydroxylase activity to promote HIF1α stabilisation in early hypoxia and enable robust HIF1α target gene expression in later hypoxia. Our findings reveal that, in normoxia, multiple enzyme systems maintain cells in a primed state ready to support increased glycolysis and HIF1α stabilisation upon oxygen limitation, until other adaptive processes that require more time are fully established.

Keywords: Glycolysis; HIF1α; Hypoxia; Metabolism; α-Ketoglutarate.


Conflict of interest statement

The authors declare no competing interests.

Figures

Figure 1
Figure 1. Increased glycolysis occurs within 3 h upon exposure to 1% O2 and correlates with decreased intracellular aspartate levels.
(A) Heatmap showing log2 fold changes of the abundance of the indicated metabolites in MCF7 cells exposed to 1% O2 for the indicated lengths of time, compared to cells at 21% O2. Metabolites are ordered according to log2 fold changes after 24 h in 1% O2. (B) Z-score plot of changes in metabolite abundances shown in (A). Metabolites are ordered according to their z-score values at 3 h in 1% O2. (C, D) Intracellular abundances of aspartate and lactate, respectively, shown in (A). See also Appendix Fig. S1A,B. (E) Glucose (2DG) uptake of MCF7 cells in 21% O2 and after 3 or 24 h in 1% O2. (F) Lactate concentration in culture media of MCF7 cells incubated in 21% O2 or 1% O2 for the indicated lengths of time. Data information: Data are representative of experiments with similar conditions performed independently N times as follows: N ≥10 (AD, 3 h), N ≥2 (AD other time points and E, F). Datapoints in (C, D) represent mean ± s.d. n = 4 (AD, F) and n = 6 (E) cultures per time point and condition, except t = 0 in (F) (n = 1), which corresponds to media without cells. P values for differences between 21% vs 1% O2 were calculated by two-way ANOVA Sidak’s test (C, D, F) or one-way ANOVA Dunnett’s test (E). *P < 0.05, **P < 0.01, ***P < 0.001, ****P < 0.0001. Source data are available online for this figure.
Figure 2
Figure 2. Increased glycolysis and depletion of aspartate in early hypoxia are independent of HIF1α.
(A) Western blot to assess levels of HIF1α and a panel of HIF1α targets in wild-type (wt) MCF7 and HIF1αmut MCF7 cells incubated in 21% O2 or at 1% O2 for the indicated lengths of time. The asterisk marks a HIF1α immunoreactive band of smaller molecular weight than HIF1α that increases upon hypoxia in HIF1αmut MCF7 cells, indicative of a truncated HIF1α that likely lacks the transactivation domain where the sgRNA sequence is targeted at. See also Appendix Fig. S2A. (B) Log2 fold changes in mRNA expression levels of a panel of HIF1α targets in MCF7 cells exposed to 1% O2 for 3 or 24 h, compared to control cells at 21% O2. (C) Heatmap showing log2 fold changes in mRNA expression levels of a panel of HIF1α targets in wild-type (wt) and HIF1αmut MCF7 cells exposed to 1% O2 for 3 or 24 h, compared to control cells in normoxia. (D) Fraction labelled (left) and absolute abundances of the M + 2 isotopologue (right) of citrate from [U-13C]-glucose in wild-type (wt) and HIF1αmut MCF7 cells after incubation with the tracer at 21% O2 or 1% O2 for the indicated lengths of time. Time points indicate both the duration of hypoxia treatment and incubation with the tracer. See also Appendix Fig. S2C. (E) Changes in lactate and aspartate abundance in wild-type (wt) and HIF1αmut MCF7 cells incubated in 21% O2 or 1% O2 for the indicated lengths of time, compared to control cells in normoxia. Data information: Data are representative of experiments with similar conditions performed independently N times as follows: N ≥ 2 (A, D, E), N = 1 (B, C). Datapoints in (D, E) represent mean ± s.d. n = 3 (B, C) and n = 4 (D, E) cultures for each time point and condition. Statistical errors in (D, left and E) were propagated to calculate variance of the change in isotopic labelling between normoxia and hypoxia for each cell line. FDRs in (B, C) were calculated using the ’exactTest’ function of the edgeR package (see 'Methods') with a cut-off set at 1%; only changes with FDR < 0.01 are shown. The P values shown were calculated by two-way ANOVA Sidak’s test (D, left and E) or two-way ANOVA Tukey’s test (D, right). ns non-significant, *P < 0.05, **P < 0.01, ***P < 0.001, ****P < 0.0001. Source data are available online for this figure.
Figure 3
Figure 3. GOT1 supports increased glycolysis in early hypoxia.
(A) Western blot to assess levels of GOT1 in wild-type (wt) and GOT1ko MCF7 cells. (B) The intracellular abundance of aspartate in wild-type (wt) and GOT1ko MCF7 cells incubated in 21% O2 or 1% O2 for 3 h. (C) Glucose (2DG) uptake of wild-type (wt) and GOT1ko MCF7 cells in normoxia and after 3 and 24 h in 1% O2. (D) The intracellular abundance of lactate in wild-type (wt) and GOT1ko MCF7 cells incubated in 21% O2 or 1% O2 for 3 h. (E) Lactate concentration in cell culture media of wild-type (wt) and GOT1ko MCF7 cells incubated in 21% O2 or 1% O2 for the indicated lengths of time. (F) Western blot to assess the levels of HIF1α, endogenous GOT1 and HA-tagged GOT1 in wild-type (wt) and GOT1ko MCF7 cells stably expressing GOT1-HA or GFP. (G, H) Intracellular abundance of aspartate and lactate in wild-type (wt) and GOT1ko MCF7 cells stably expressing GOT1-HA or GFP at 21% O2 and after 3 h in 1% O2, relative to wild-type cells at 21% O2. Data information: Data are representative of experiments with similar conditions performed independently N times as follows: N ≥9 (A), N ≥5 (B, D), N ≥ 2 (C, E, G, H), N ≥3 (F). Datapoints in (BE, G, H) represent mean ±  s.d. n = 3 assays per condition (C) and n = 4 cultures for each time point and condition (B, D, E, G, H), except for E 1% O2, t = 0 and all measurements at 21% O2 where n = 3. P values shown were calculated by two-way ANOVA Sidak’s test (C) or two-way ANOVA Tukey’s test (B, D, E, G). Statistical errors in (H) were propagated to calculate the error of the change in lactate between normoxia and hypoxia for each condition, and significance between these changes was then tested using one-way ANOVA Tukey’s test. ns non-significant, *P < 0.05, **P < 0.01, ***P < 0.001, ****P < 0.0001. Source data are available online for this figure.
Figure 4
Figure 4. GOT1 supports MDH1 flux and cytoplasmic redox balance, but MDH1 flux does not change in hypoxia vs. normoxia.
(A) Heatmap showing log2 fold changes in the abundance of the indicated metabolites in GOT1ko at 21% O2 or after 3 h in 1% O2, compared to wild-type MCF7 cells under the same conditions. Data for each condition separately are shown in Appendix Fig. S4A. 6-PG 6-phosphogluconic acid, FBP fructose 1,6-biphosphate, DHAP dihydroxyacetone phosphate, 1,3-BPG 1,3-biphosphoglyceric acid, 2PG 2-phosphoglyceric acid, PEP phosphoenolpyruvate. (BD) NAD+/NADH ratio (B) calculated from the intracellular abundance of NAD+ (C) and NADH (D) in wild-type (wt) and GOT1ko MCF7 cells incubated in 21% O2 or 1% O2 for 3 h. (E) Peredox T-sapphire fluorescence signal intensity of wild-type (wt) and GOT1ko MCF7 cells in buffer containing 5.5 mM glucose and 2 mM glutamine (Glc+Gln) and after sequential incubation first with 10 mM lactate (Lac) and then with 10 mM pyruvate (Pyr). Signal was normalised per nucleus and is shown relative to the Glc+Gln condition. See also Appendix Fig. S4B,C. (F) Schematic showing theoretical labelling patterns in the indicated metabolites from [4-2H]-glucose. Carbon atoms are shown in white and deuterium atoms are shown in red. Adapted from (Lewis et al, 2014). (G) The intracellular abundance of the M + 1 isotopologues of malate in wild-type (wt) and GOT1ko MCF7 cells after incubation with [4-2H]-glucose for 3 h. See also Appendix Fig. S4E. (HJ) Fraction labelled from [4-2H]-glucose, absolute total abundances and absolute abundances of M + 1-labelled isotopologues from [4-2H]-glucose of the shown metabolites. Time points indicate duration of incubation at 21% O2 or 1% O2, as well as duration of incubation with the isotopic tracer. (K) The intracellular abundance of α-glycerophosphate (α-GP) M + 3 labelled from [U-13C]-glucose in wild-type (wt) and GOT1ko MCF7 cells after the indicated lengths of time in 21% O2 or 1% O2. Cells were incubated with the tracer for 3 or 24 h, respectively. (L) Intracellular abundance of α-glycerophosphate (α-GP) M + 3 labelled from [U-13C]-glucose in wild-type (wt) and GOT1ko MCF7 cells, stably expressing an empty vector (EV) or LbNOX. Cells were incubated with the tracer for 3 h in 21% O2 or 1% O2, respectively. Data information: Data are representative of experiments with similar conditions performed independently N times as follows: N ≥2 (A, K), N ≥3 (BD, G), N = 4 (E), N = 1 (HJ, except 3 h time-point where N = 3, and L). Datapoints in (BE, GL) represent mean ± s.d. n = 4 cultures for each time point or cell line and condition (AD, G, HL) except for (HJ): 1% O2, 2 h, n = 3 and 21% O2, 3 h, n = 2. Data points in (E) represent mean ± s.d. of four independent replicates per cell line (n = 25–55 cells per replicate). P values shown were calculated by two-way ANOVA Dunnett’s test (BE), two-way ANOVA Sidak’s test (GJ, L) or two-way ANOVA Tukey’s test (K). ns non-significant, *P < 0.05, **P < 0.01, ***P < 0.001, ****P < 0.0001. Source data are available online for this figure.
Figure 5
Figure 5. LDHA has spare capacity in normoxia and is necessary to maintain ATP levels in early hypoxia.
(A) Western blot to assess the levels of LDHA in wild-type (wt) and LDHAko MCF7 cells. (B) The intracellular abundance of pyruvate, lactate and α-glycerophosphate (α-GP) in wild-type (wt) and LDHAko MCF7 cells. Striped bars represent the fraction of metabolites fully labelled from [U-13C]-glucose after 3 h incubation with the tracer. (C) Heatmap showing log2 fold changes in the abundance of the indicated metabolites in LDHAko at 21% O2 or after 3 h in 1% O2, compared to wild-type MCF7 cells in the same conditions. Data for each condition separately are shown in Appendix Fig. S5A. Wild-type data are the same as shown in Fig. 4A and Appendix Fig. S4A and statistical tests were performed on the whole data set. 6-PG 6-phosphogluconic acid, FBP fructose 1,6-biphosphate, DHAP dihydroxyacetone phosphate, 1,3-BPG 1,3-biphosphoglyceric acid, 2PG 2-phosphoglyceric acid, PEP phosphoenolpyruvate. (D) Mitochondrial respiration of MCF7 cells after incubation at 1% O2 for the indicated lengths of time. Cellular oxygen consumption was corrected for ROX (residual oxygen consumption) by the addition of the complex III inhibitor antimycin A. (E) ATP levels in wild-type (wt), GOT1ko and LDHAko MCF7 cells at 21% O2 and after 3 h or 24 h in 1% O2. See also Appendix Fig. S5B. (F) Schematic of a theoretical working model, for illustrative purposes, summarising the observed effects of GOT1 and LDHA deletion (GOT1ko and LDHAko, respectively) on carbon flux from upper to lower glycolysis (indicated by the colour scale) and changes in cellular ATP during early hypoxia. Decreased NAD+/NADH ratio in GOT1ko cells leads to an attenuation of carbon flux into lower glycolysis that is not large enough to affect ATP levels. In contrast, loss of LDHA leads to more profound inhibition of lower glycolysis, associated with ATP depletion and cell death. wt: wild-type cells. (G) Intracellular abundance of lactate and α-glycerophosphate (α-GP) in MCF7 cells treated with a range of concentrations of the LDHA inhibitor oxamate for 3 h at 21% O2 or 1% O2. Striped bars represent the fraction of metabolites fully labelled from [U-13C]-glucose after 3 h incubation with the tracer. (H) ATP levels in wild-type (wt) and GOT1ko MCF7 cells at 21% O2 and after 3 h in 1% O2 treated with the indicated oxamate concentrations for 3 h. (I) Scatter plot showing changes in abundance of α-glycerophosphate (α-GP) M + 3 labelled from [U-13C]-glucose (3 h incubation with the tracer) versus the corresponding changes in ATP levels, in MCF7 cells treated with a range of oxamate concentrations for 3 h at 1% O2 relative to cells treated at 21% O2. (J) Change in cell confluence of wild-type (wt) and GOT1ko MCF7 cells within 24 h at 21% O2 or 1% O2 with the indicated oxamate concentration in cell culture media, shown relative to 0 mM oxamate per cell line. Data information: Data are representative of experiments with similar conditions performed independently N times as follows: N = 2 (B, D, H, J), N ≥3 (A), N = 1 (C, E, G, I). Datapoints in (B, D, GJ) represent mean ± s.d. n = 4 (B, C) and n = 3 (E, I, J) cultures for each cell line and condition; n = 3 assays per cell line, time point and condition; n = 3 cultures per condition; (D) graphs show combined replicates of two independent experiments: [n = 7 (0 h); n = 5 (3 h); n = 4 (6 h); n = 6 (24 h)]. P values shown were calculated by two-way ANOVA Dunnett’s test (D, E, G) or two-way ANOVA Sidak’s test (B, H, J). ns non-significant, *P < 0.05, **P < 0.01, ***P < 0.001, ****P < 0.0001. Source data are available online for this figure.
Figure 6
Figure 6. Elevated αKG levels, increased HIF1α hydroxylation and attenuated HIF1α stabilisation in GOT1ko cells under hypoxia.
(A) Volcano plot of gene expression changes of a panel of HIF1α target genes in wild-type (wt) MCF7 and GOT1ko cells exposed to 1% O2 for 24 h, compared to control cells in normoxia. Lines connect identical genes in the two cell lines to illustrate the differences in hypoxia-induced gene expression changes. (B) Western blot to assess HIF1α protein levels in wild-type (wt) and GOT1ko MCF7 cells exposed to 1% O2 for the indicated lengths of time. The graph on the right shows the quantification of the HIF1α signal. (C) Western blot to assess the protein levels of HIF1α, endogenous GOT1 and HA-tagged GOT1 in wild-type (wt) and GOT1ko MCF7 cells stably expressing GOT1-HA or GFP and exposed to 1% O2 for 3 h. (D) Western blot to assess HIF1α protein levels in wild-type (wt) and GOT1ko MCF7 cells exposed to 1% O2 for 3 h and then treated with cycloheximide (CHX, 20 μM) for the indicated lengths of time. Graph on the right shows the quantification of the HIF1α signal. (E) Western blot to assess the levels of HIF1α, and HIF1α hydroxylated at proline 564 (Pro564) in wild-type (wt) and GOT1ko MCF7 cells exposed to 1% O2 for the indicated lengths of time. Cells were treated with the PHD inhibitor FG-4592 (50 μM), the proteasome inhibitor MG-132 (10 μM) or a combination of both for the duration of the experiment. See also Appendix Fig. S6F for additional controls. (F) The intracellular abundance of α-ketoglutarate (α-KG, left) and corresponding αKG/succinate ratios (right) in wild-type (wt) and GOT1ko MCF7 cells after 3 h at 21% O2 or 1% O2. Data information: Data are representative of experiments with similar conditions performed independently N times as follows: N = 1 (A), N = 3 (B), N ≥ 3 (C), N = 2 (DF). Datapoints in (F) represent mean ± s.d. n = 3 (A) and n = 4 (F) cultures for each cell line and condition. FDRs in (A) were calculated using the ’exactTest’ function of the edgeR package (see 'Methods') with a cut-off set at 1%; only changes with FDR < 0.01 are shown. The P values shown in (F) were calculated by two-way ANOVA Sidak’s test. ns non-significant, *P < 0.05, **P < 0.01, ***P < 0.001, ****P < 0.0001. Source data are available online for this figure.
Figure 7
Figure 7. Model summarising the dual role of GOT1 in enabling the cellular response to hypoxia.
In normoxia, carbon flux through lower glycolysis matches that of upper glycolysis because LDHA and GOT1-driven MDH1 provide sufficient NAD+, which is needed for the flow of carbons (indicated by the high reading of the gauge) to lower glycolysis. The coloured scale for the reading of the gauge indicates flux from upper to lower glycolysis. In early hypoxia, elevation of upper glycolysis increases the requirement for regeneration of NAD+, which is supported by an increase in the flux through LDHA and by GOT1-dependent MDH1 activity that does not increase compared to normoxia. However, carbon flow to lower glycolysis is limited by NAD+ in early hypoxia, as indicated by the increased efflux of glucose carbons to α-GP. In late hypoxia, increased RC provides additional OAA for MDH1 and, combined with increased LDHA expression, confers additional NAD+-regenerating capacity enabling increased flow of carbons to lower glycolysis. In parallel, GOT1 consumes αKG (an essential co-factor for PHDs), which, in combination with lower oxygen, suppresses HIF1α hydroxylation and therefore promotes its stabilisation, leading to robust HIF1α target gene expression later in hypoxia. RC reductive carboxylation.

References

    1. Abboud MI, McAllister TE, Leung IKH, Chowdhury R, Jorgensen C, Domene C, Mecinovic J, Lippl K, Hancock RL, Hopkinson RJ, et al. 2-Oxoglutarate regulates binding of hydroxylated hypoxia-inducible factor to prolyl hydroxylase domain 2. Chem Commun. 2018;54:3130–3133. doi: 10.1039/C8CC00387D. - DOI - PMC - PubMed
    1. Aithal HN, Walsh-Reitz MM, Toback FG. Regulation of glyceraldehyde-3-phosphate dehydrogenase by a cytosolic protein. Am J Physiol. 1985;249:C111–116. doi: 10.1152/ajpcell.1985.249.1.C111. - DOI - PubMed
    1. Altea-Manzano P, Vandekeere A, Edwards-Hicks J, Roldan M, Abraham E, Lleshi X, Guerrieri AN, Berardi D, Wills J, Junior JM, et al. Reversal of mitochondrial malate dehydrogenase 2 enables anaplerosis via redox rescue in respiration-deficient cells. Mol Cell. 2022;82:4537–4547.e4537. doi: 10.1016/j.molcel.2022.10.005. - DOI - PubMed
    1. Amelunxen R, Grisolia S. The mechanism of triosephosphate dehydrogenase inactivation by reduced diphosphopyridine nucleotide. J Biol Chem. 1962;237:3240–3244. doi: 10.1016/S0021-9258(18)50152-6. - DOI - PubMed
    1. Barros LF, Bittner CX, Loaiza A, Porras OH. A quantitative overview of glucose dynamics in the gliovascular unit. Glia. 2007;55:1222–1237. doi: 10.1002/glia.20375. - DOI - PubMed

Substances