Randomized Controlled Trial
. 2024 Mar 14;14(1):6234.
doi: 10.1038/s41598-024-55667-5.

Identification of a hyperinflammatory sepsis phenotype using protein biomarker and clinical data in the ProCESS randomized trial

Affiliations
Randomized Controlled Trial

Identification of a hyperinflammatory sepsis phenotype using protein biomarker and clinical data in the ProCESS randomized trial

Kimberley M DeMerle et al. Sci Rep. .

Abstract

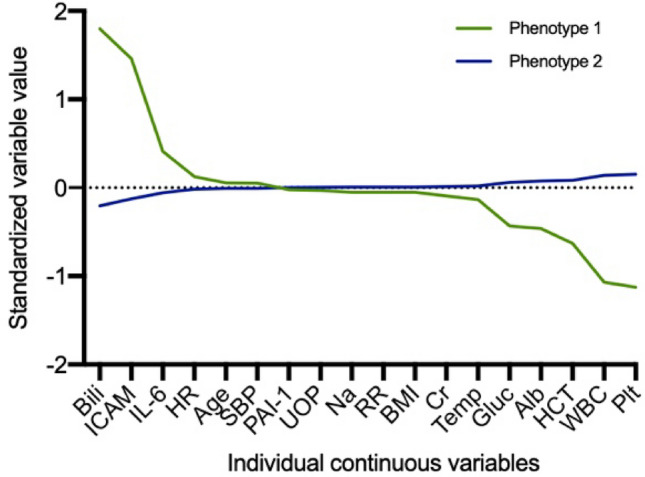
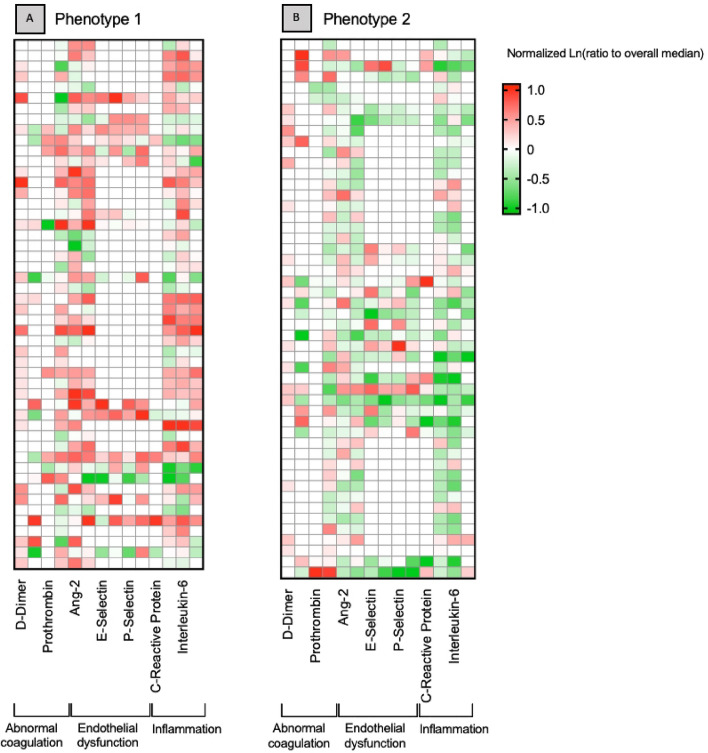
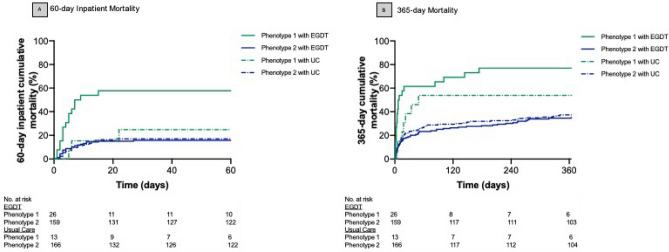
Sepsis is a heterogeneous syndrome and phenotypes have been proposed using clinical data. Less is known about the contribution of protein biomarkers to clinical sepsis phenotypes and their importance for treatment effects in randomized trials of resuscitation. The objective is to use both clinical and biomarker data in the Protocol-Based Care for Early Septic Shock (ProCESS) randomized trial to determine sepsis phenotypes and to test for heterogeneity of treatment effect by phenotype comparing usual care to protocolized early, goal-directed therapy(EGDT). In this secondary analysis of a subset of patients with biomarker sampling in the ProCESS trial (n = 543), we identified sepsis phenotypes prior to randomization using latent class analysis of 20 clinical and biomarker variables. Logistic regression was used to test for interaction between phenotype and treatment arm for 60-day inpatient mortality. Among 543 patients with severe sepsis or septic shock in the ProCESS trial, a 2-class model best fit the data (p = 0.01). Phenotype 1 (n = 66, 12%) had increased IL-6, ICAM, and total bilirubin and decreased platelets compared to phenotype 2 (n = 477, 88%, p < 0.01 for all). Phenotype 1 had greater 60-day inpatient mortality compared to Phenotype 2 (41% vs 16%; p < 0.01). Treatment with EGDT was associated with worse 60-day inpatient mortality compared to usual care (58% vs. 23%) in Phenotype 1 only (p-value for interaction = 0.05). The 60-day inpatient mortality was similar comparing EGDT to usual care in Phenotype 2 (16% vs. 17%). We identified 2 sepsis phenotypes using latent class analysis of clinical and protein biomarker data at randomization in the ProCESS trial. Phenotype 1 had increased inflammation, organ dysfunction and worse clinical outcomes compared to phenotype 2. Response to EGDT versus usual care differed by phenotype.

Keywords: Biomarkers; Phenotypes; Sepsis.


Conflict of interest statement

The authors declare no competing interests.

Figures

Figure 1
Figure 1
Phenotype variables ranked by the difference in mean standardized value. Mean standardized difference of continuous variables comparing Phenotype 1 (green) and Phenotype 2 (blue). The variables are ranked on the x-axis by degree of separation from Phenotype 1 versus 2 with maximum positive degree of separation on the right to maximum negative degree of separation on the left. Bili bilirubin, ICAM intercellular adhesion molecule, IL-6 interlukin-6, HR heart rate, SBP systolic blood pressure, PAI-1 plasminogen activator inhibitor-1, RR respiratory rate, BMI body mass index, Temp temperature, HCT hematocrit, WBC white blood cell.
Figure 2
Figure 2
Heatmap of biomarkers by phenotype (N = 100). Heatmap showing the log of the fold change of the median biomarker value (column) per patient (row) for various markers of the septic host response grouped by those reflecting coagulation, endothelium and inflammation in a random selection of 100 patients from (A) phenotype 1 and (B) phenotype 2. Red represents greater median biomarker value for that phenotype compared to the median of the entire study, while green represents lower values of the biomarker compared to the median of the entire study. White cells are those in which the biomarker was not measured.
Figure 3
Figure 3
Short- and long-term mortality by phenotype (N = 543). (A) 60-day inpatient mortality probability. (B) 365-day mortality probability, by phenotype, where phenotype 1 is green and phenotype 2 is blue. Both panels show significant differences in mortality probability by phenotype (log rank P < 0.01). Panel (A) captures inpatient mortality from any-cause at 60 days whereas Panel (B) captures overall mortality from any cause up to 365 days.
Figure 4
Figure 4
Short- and long-term mortality stratified by phenotype and treatment arm (N = 364). (A) 60-day inpatient mortality probability. (B) 365-day mortality probability, by phenotype and treatment arm, where phenotype 1 is green, phenotype 2 is blue, EGDT is a solid line, Usual Care (UC) is a dashed line. Panel (A) captures inpatient mortality from any cause at 60 days whereas Panel (B) captures overall mortality from any cause up to 365 days.

References

    1. Liu V, Escobar GJ, Greene JD, et al. Hospital deaths in patients with sepsis from 2 independent cohorts. JAMA. 2014;312(1):90–92. doi: 10.1001/jama.2014.5804. - DOI - PubMed
    1. Rhee C, Dantes R, Epstein L, et al. Incidence and trends of sepsis in US hospitals using clinical vs claims data, 2009–2014. JAMA. 2017;318(13):1241–1249. doi: 10.1001/jama.2017.13836. - DOI - PMC - PubMed
    1. Dantes RB, Epstein L. Combatting sepsis: A public health perspective. Clin. Infect. Dis. 2018;67(8):1300–1302. doi: 10.1093/cid/ciy342. - DOI - PMC - PubMed
    1. Yealy DM, Kellum JA, et al. A randomized trial of protocolbased care for early septic shock. N. Engl. J. Med. 2014;370(18):1683–1693. doi: 10.1056/NEJMoa1401602. - DOI - PMC - PubMed
    1. Seymour CW, Kennedy JN, Wang S, et al. Derivation, validation, and potential treatment implications of novel clinical phenotypes for sepsis. JAMA. 2019;321(20):2003–2017. doi: 10.1001/jama.2019.5791. - DOI - PMC - PubMed

Publication types