. 2024 Mar 14;7(1):323.
doi: 10.1038/s42003-024-05985-1.

A neural network-based model framework for cell-fate decisions and development

Affiliations

A neural network-based model framework for cell-fate decisions and development

Mátyás Paczkó et al. Commun Biol. .

Abstract

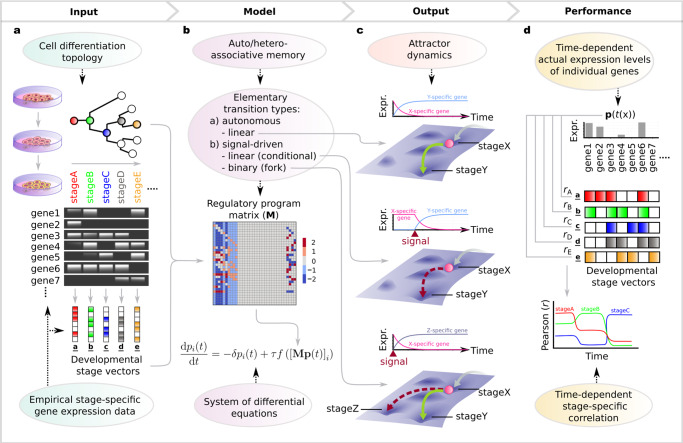
Gene regulatory networks (GRNs) fulfill the essential function of maintaining the stability of cellular differentiation states by sustaining lineage-specific gene expression, while driving the progression of development. However, accounting for the relative stability of intermediate differentiation stages and their divergent trajectories remains a major challenge for models of developmental biology. Here, we develop an empirical data-based associative GRN model (AGRN) in which regulatory networks store multilineage stage-specific gene expression profiles as associative memory patterns. These networks are capable of responding to multiple instructive signals and, depending on signal timing and identity, can dynamically drive the differentiation of multipotent cells toward different cell state attractors. The AGRN dynamics can thus generate diverse lineage-committed cell populations in a robust yet flexible manner, providing an attractor-based explanation for signal-driven cell fate decisions during differentiation and offering a readily generalizable modelling tool that can be applied to a wide variety of cell specification systems.


Conflict of interest statement

The authors declare no competing interests.

Figures

Fig. 1
Fig. 1. Schematic illustration of the AGRN model.
a Input components of the AGRN framework. An AGRN model takes as model inputs: (i) the cell differentiation topology of a given developmental process, i.e., the order of the subsequent developmental stages corresponding to different cellular identities, and (ii) the stage-specific binary representations of individual gene expression states in the form of developmental stage vectors. In the developmental stage vectors, colored cells represent on and empty cells represent off gene expression states. The input components are then used to construct a regulatory program matrix M according to simple, modular algebraic rules described in Eqs. (4–6). The M matrix then governs the dynamics of the model by regulating the expression levels of individual genes (pi) as described by the system of differential equations in Eq. 1. (b). c Output components of the AGRN framework. The attractor dynamics is realized by a series of elementary transitions encoded by the associative memory of the matrix. At fork and conditional transitions, in concert with cell-intrinsic machinery (represented by the regulatory program matrix), instructive external signals (triggers) determine the behavior of the system. Pink marbles represent the system’s current state, continuous green- and dashed red arrows represent default- and trigger-induced differentiation pathways, respectively. Gray arrows with blurred end represent previous transitions. The elementary transitions correspond to time series of gene expression level changes (here, for simplicity, only the expression of one key gene per stage is shown). To measure the performance of the model over time, we calculated the Pearson correlation coefficients (r) between the state of the gene expression vector (p(t)) and each developmental stage vector at all t + ∆t time points (d).
Fig. 2
Fig. 2. Illustration of the hematopoietic cell differentiation process with an associative GRN.
a Hematopoietic differentiation topology of the model. Uppercase letters with rounded and colored background represent cell differentiation stages, the arrows between them represent transitions between the stages. The fork transitions and the conditional transition are controlled by the expression of transition-specific triggers (denoted as tr-1, tr-2, …). The two differentiation pathways demonstrated here are highlighted with black arrows. b Realizations of stages, as measured by Pearson correlation coefficients between the p(t) expression vector and the stage-specific developmental stage vectors (Supplementary Data 1). Color code for the lines that correspond to the cellular differentiation stages is given at (a). c The first two principal components of the differentiation stages of the hematopoietic hierarchy and the dynamical trajectories of the system. Principal components for the stages are obtained from the developmental stage vectors. PCA trajectories of the two realized pathways are obtained from the p(t) expression vector sampled at Δt = 0.1 frequency. Color code for the time scale of consecutive samples with the timing of the corresponding triggers is shown on the right. In the nomenclature and topology of the differentiation hierarchy, we followed ref. . Abbreviations׃ EC endothelial cell, LTR long-term repopulating, HSC hematopoietic stem cell, STR short-term repopulating, CMP common myeloid progenitor, CLP common lymphoid progenitor, GMP granulocyte-macrophage progenitor, MEP megakaryocyte erythroid progenitor, BFU-E burst forming unit erythroid, BFU-meg burst forming unit megakaryocyte, CFU-E colony-forming unit erythroid.
Fig. 3
Fig. 3. Demonstration of the AGRN model functionality to describe cyclic dynamics on the human cell cycle (CC) data.
a, b Gene expression time evolution of individual genes in the p(t) expression vector. Expression levels are normalized by the maximal gene expression rate (τ/δ) of the model. c Positions of the checkpoints considered in the cycle. d, e Realization of phases, as measured by Pearson correlation coefficients between the p(t) expression vector and the cell cycle phase-specific gene expression profile vectors (Supplementary Data 2) as a function of the time. Note the common x-axes with (a) and (b). Color code for the lines that correspond to the phases is given at (c). Termination of the cyclic dynamics and converging into the subsequent apoptotic pathway after two complete cycles is triggered by the expression of an apoptotic signal-mediating trigger (tr+) at the G1/S (a, d) and at the G2/M (b, e) checkpoints. The exact expression times of the triggers are denoted by vertical arrows on the horizontal axes.
Fig. 4
Fig. 4. C. elegans embryonic development with an associative GRN.
a Differentiation topology of the model representing developmental stages and pathways. Black lines indicate linear transitions or the default branches of fork transitions, while gray lines illustrate the triggered branch of forks. The text labels at the tip of the tree indicate the tissue type that develops from the lineages. In the nomenclature and topology of the differentiation hierarchy, we followed ref. . b Realizations of stages, as measured by Pearson correlation coefficients between the p(t) expression vector and the stage-specific developmental stage vectors (Supplementary Data 3). c The first three principal components of the differentiation stages and the dynamical trajectories of the system. Principal components for the stages are obtained from the developmental stage vectors. PCA trajectories of the two realized pathways are obtained from the p(t) expression vector sampled at Δt = 0.1 frequency. Color codes for the time scale of consecutive samples with the timing of the corresponding triggers are shown on the right.
Fig. 5
Fig. 5. Possible alternative pathways in C. elegans embryonic development.
The chart represents the differentiation topology of C. elegans embryonic development with the corresponding developmental stages and pathways. Black lines indicate the default branches of forks transitions, while gray lines illustrate the triggered branch of forks. Colored arrows indicate alternative pathways illustrated in ref. , which can be interpreted in our model. Color of the arrows represent reproducibility: greens are feasible, while red arrows illustrate the alternative pathways that are not achievable.
Fig. 6
Fig. 6. The effects of regulatory interaction perturbations.
The performance of three AGRN model systems (human hematopoiesis, human cell cycle and C. elegans P5.p vulval precursor cell differentiation) as a function of the standard deviation (σ) of multiplicative perturbations (a); and as a function of the proportion of nullified elements (b) in the regulatory program matrices. The performance was measured as the fraction of successful runs (for detailed explanation, see Methods). Parameters are from the standard parameter set.
Fig. 7
Fig. 7. Subsequent stage transitions with expression level perturbations.
a The structure of the differentiation topology. b Perturbation with three consecutive misexpressions: the first at the end of an expressed stage (t = 22), the second in the middle (t = 55), and the third at the beginning of an expressed stage (t = 108). c Single perturbations of the system with the same misexpression and at the same time as in (b). The notation and the color of the misexpressed stages are in line with (a). The level of misexpression is 5% of the maximal expression level (0.05⋅τ/δ). Dashed lines show the correlations of the unperturbed system (same as in Fig. 2b right panel), continuous lines indicate the perturbed ones. For the nomenclature and topology of the differentiation hierarchy, see Fig. 2.
Fig. 8
Fig. 8. Construction of regulatory program matrices in the AGRN framework.
a Three elementary stage transition types of the model. Linear (upper), fork (middle), and conditional transitions (bottom). Uppercase letters with rounded background represent developmental stages with the corresponding expression profile of the developmental stage vectors in which genes with an on, or off state are indicated by value 1, or 0, respectively. Black outline of the squares denotes stage-specific genes; gray outline refers to triggers (tr). The elements of the corresponding regulatory matrix M indicate the nature of the pairwise regulatory interactions (negative: repressor, positive: activator, zero: neutral). b Illustration of the model functionality on a simple differentiation hierarchy. Due to the fork transition in stage C, there are two possible developmental pathways depending on tr-1. C → D is the default pathway that needs no trigger, while C → F is the triggered branch that the differentiation process follows, if the tr-1 trigger is on. The conditional transition between D and E stages requires a second signal (tr-2 +). We used minimal expression representation: stage A corresponds to a stage vector in which the first element is 1, while in stage F the 6th value is 1; the 7th and 8th values of the stage vectors correspond to triggers tr-1 and tr-2, respectively. The lower left panel shows the system’s state as a function of time, as measured by the expression levels of the stage-specific genes in case of the two possible developmental pathway realizations (line colors correspond to the colors of the stages as shown in the upper panel). Arrows denote the time of the induction of the trigger signals. The regulatory program matrix M corresponding to this system is shown in the rightmost panel. This matrix is derived by a combination of the elementary transition rules depicted in (a) and defined in Eqs. 4–6. We used the standard parameter set (see Methods).

References

    1. Hobert O. Regulatory logic of neuronal diversity: terminal selector genes and selector motifs. Proc. Natl Acad Sci. USA. 2008;105:20067–20071. doi: 10.1073/pnas.0806070105. - DOI - PMC - PubMed
    1. Yuh C-H, Bolouri H, Davidson EH. Genomic cis-regulatory logic: experimental and computational analysis of a sea urchin gene. Science. 1998;279:1896–1902. doi: 10.1126/science.279.5358.1896. - DOI - PubMed
    1. Levine M, Davidson EH. Gene regulatory networks for development. Proc. Natl Acad Sci. USA. 2005;102:4936–4942. doi: 10.1073/pnas.0408031102. - DOI - PMC - PubMed
    1. Bonzanni N, et al. Hard-wired heterogeneity in blood stem cells revealed using a dynamic regulatory network model. Bioinformatics. 2013;29:i80–i88. doi: 10.1093/bioinformatics/btt243. - DOI - PMC - PubMed
    1. Davidson EH, Levine MS. Properties of developmental gene regulatory networks. Proc. Natl Acad Sci. USA. 2008;105:20063–20066. doi: 10.1073/pnas.0806007105. - DOI - PMC - PubMed

Publication types

MeSH terms