. 2024 Apr;8(4):361-379.
doi: 10.1038/s41551-024-01179-6. Epub 2024 Mar 14.

In vivo affinity maturation of mouse B cells reprogrammed to express human antibodies

Affiliations

In vivo affinity maturation of mouse B cells reprogrammed to express human antibodies

Yiming Yin et al. Nat Biomed Eng. 2024 Apr.

Abstract

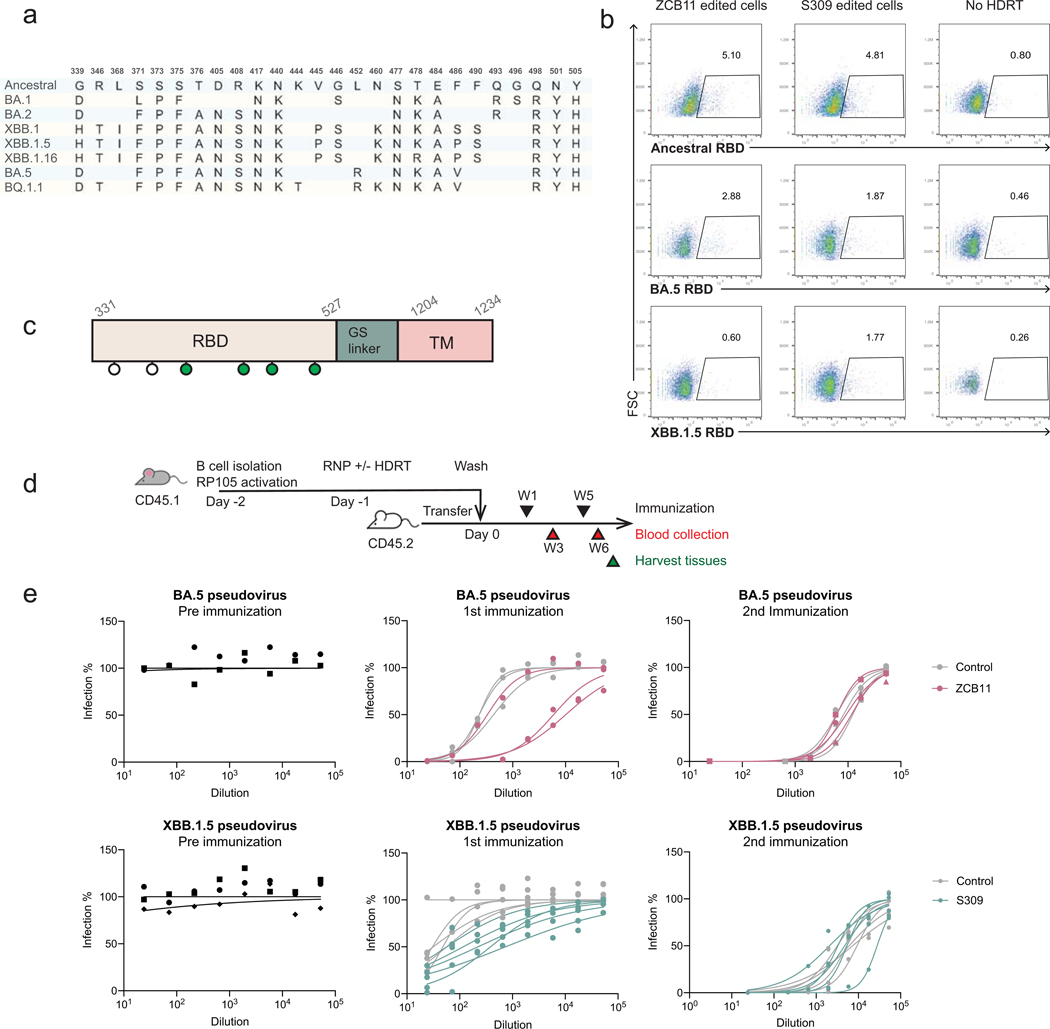
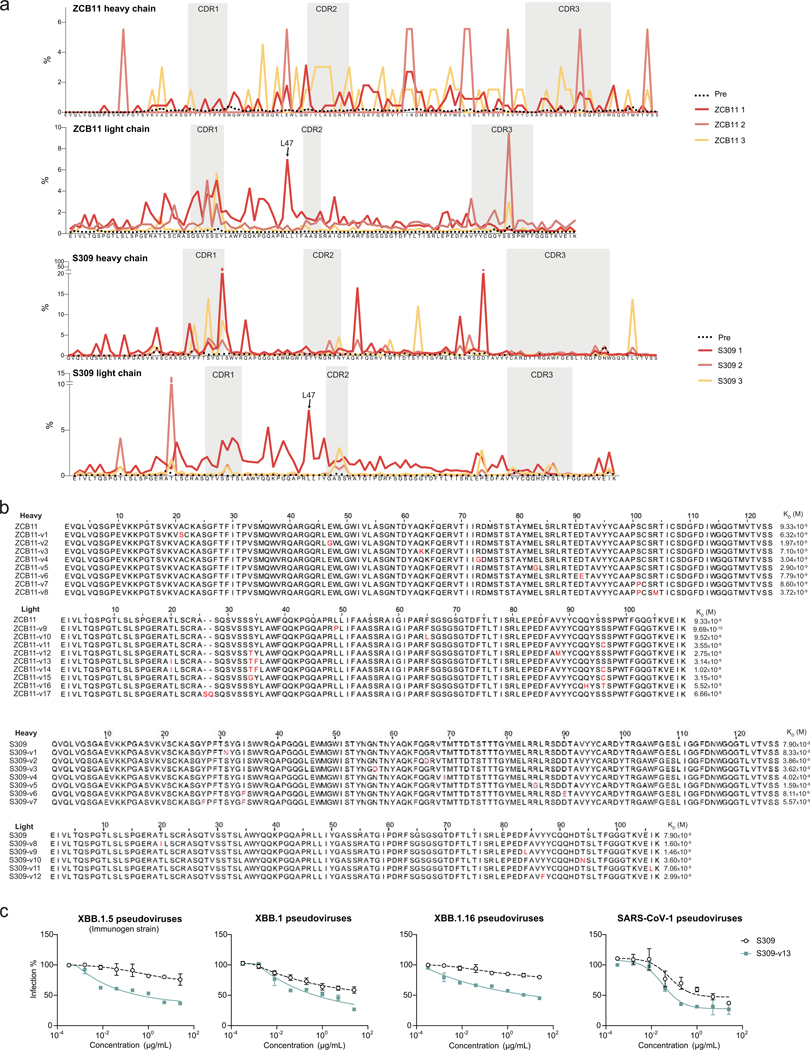
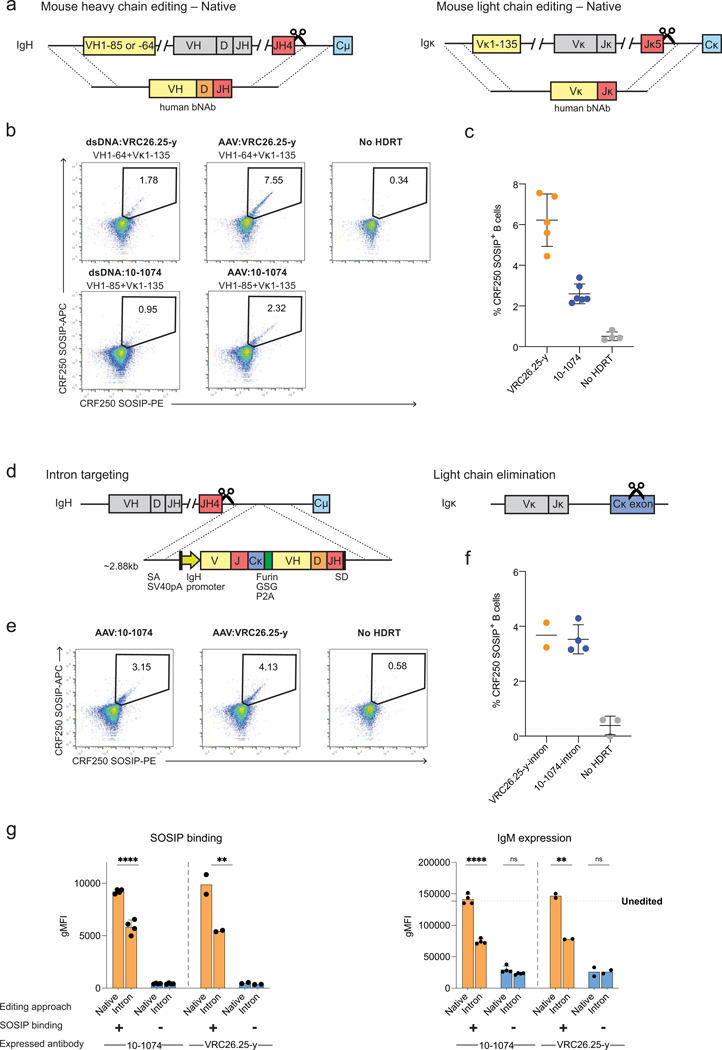
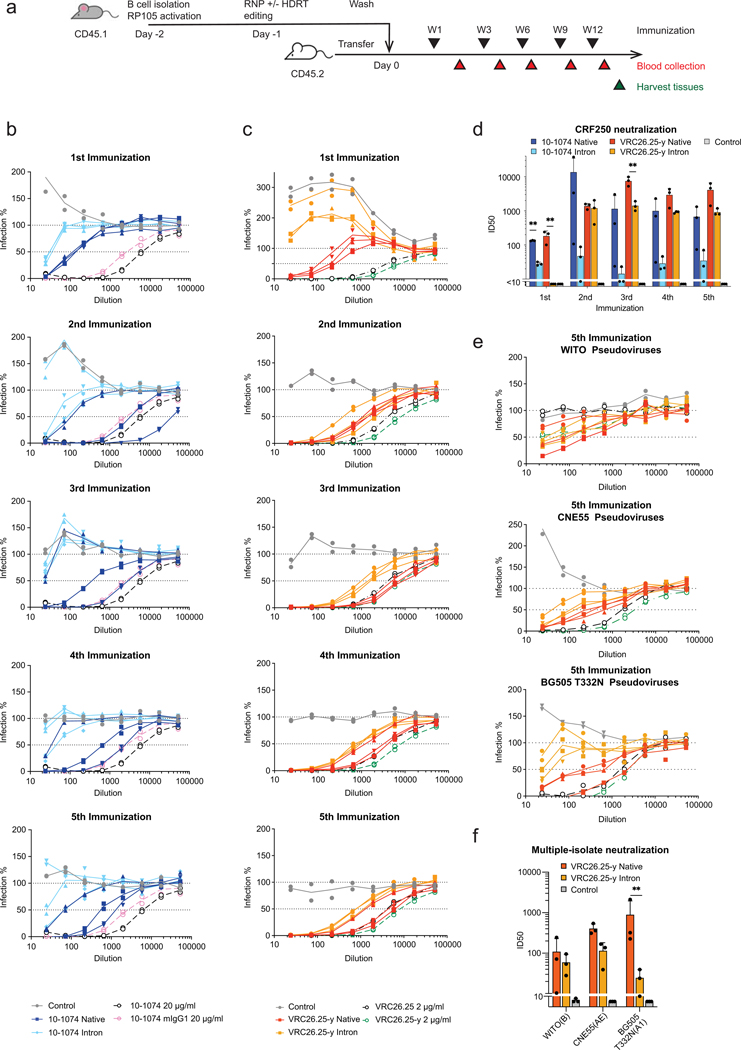
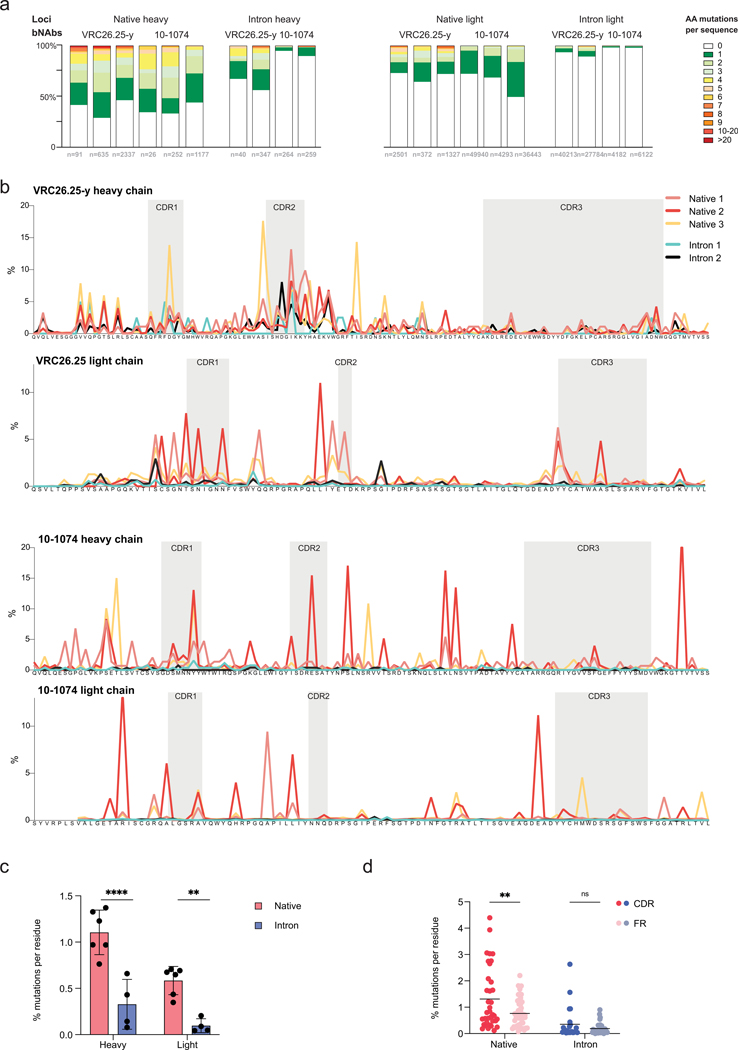
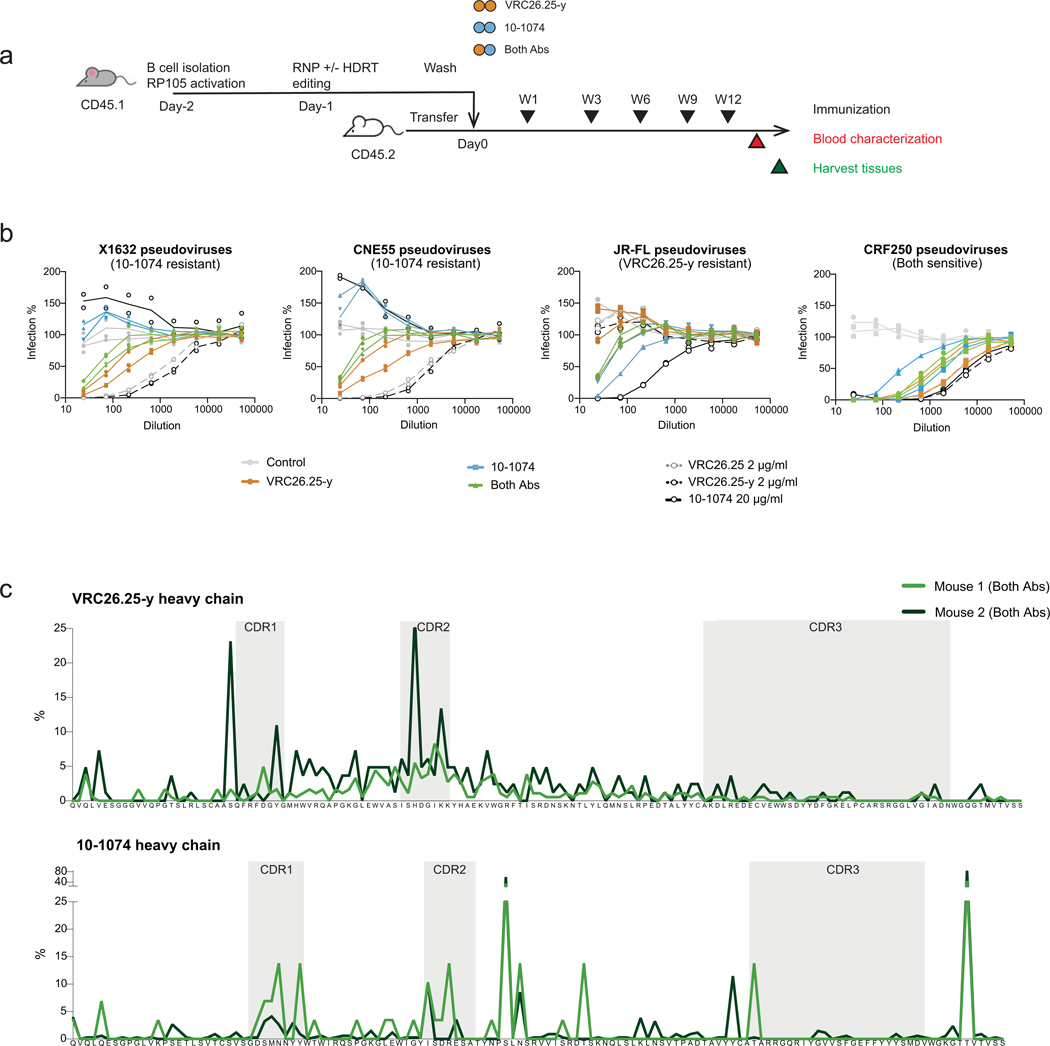
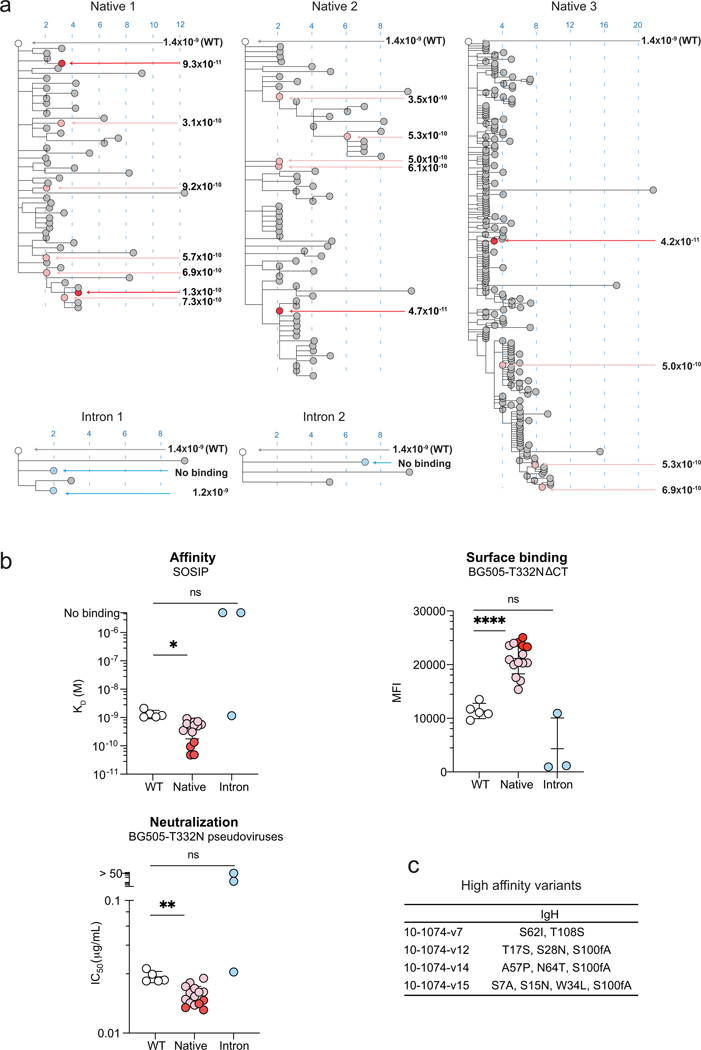
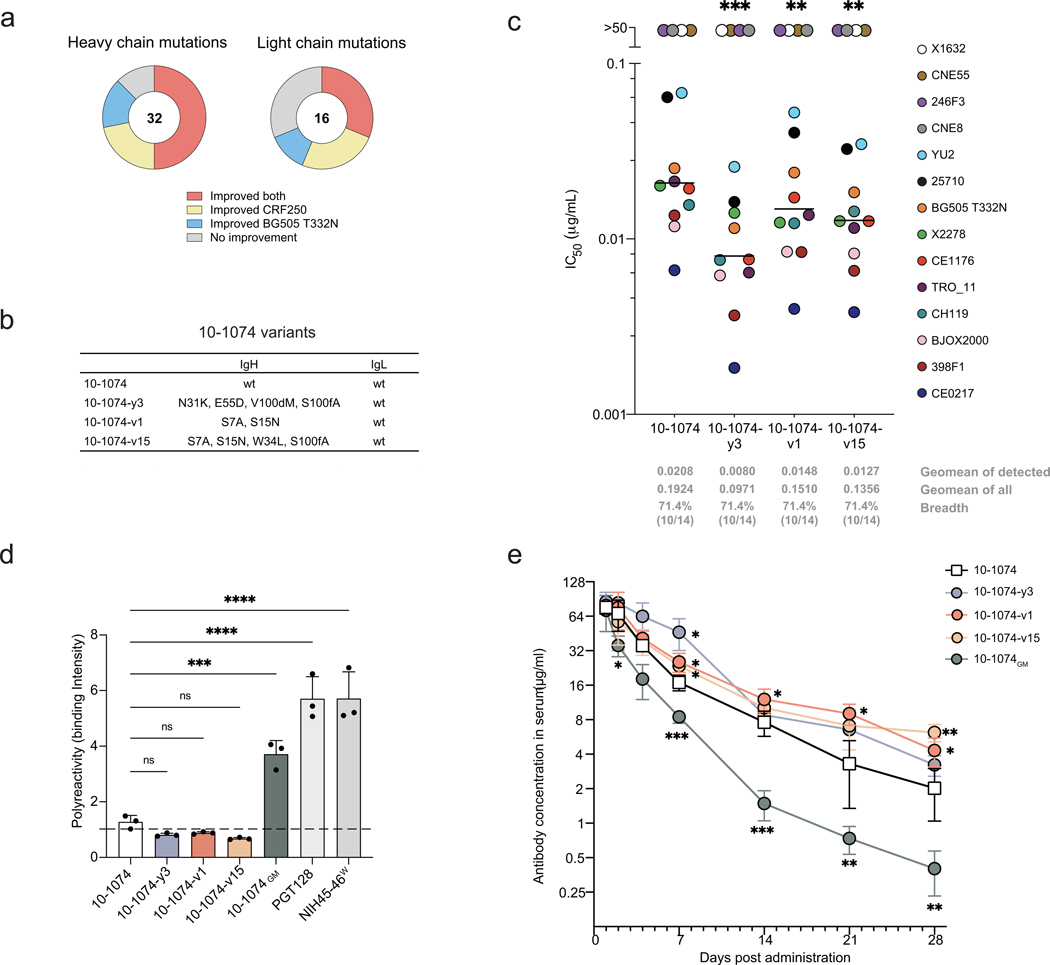
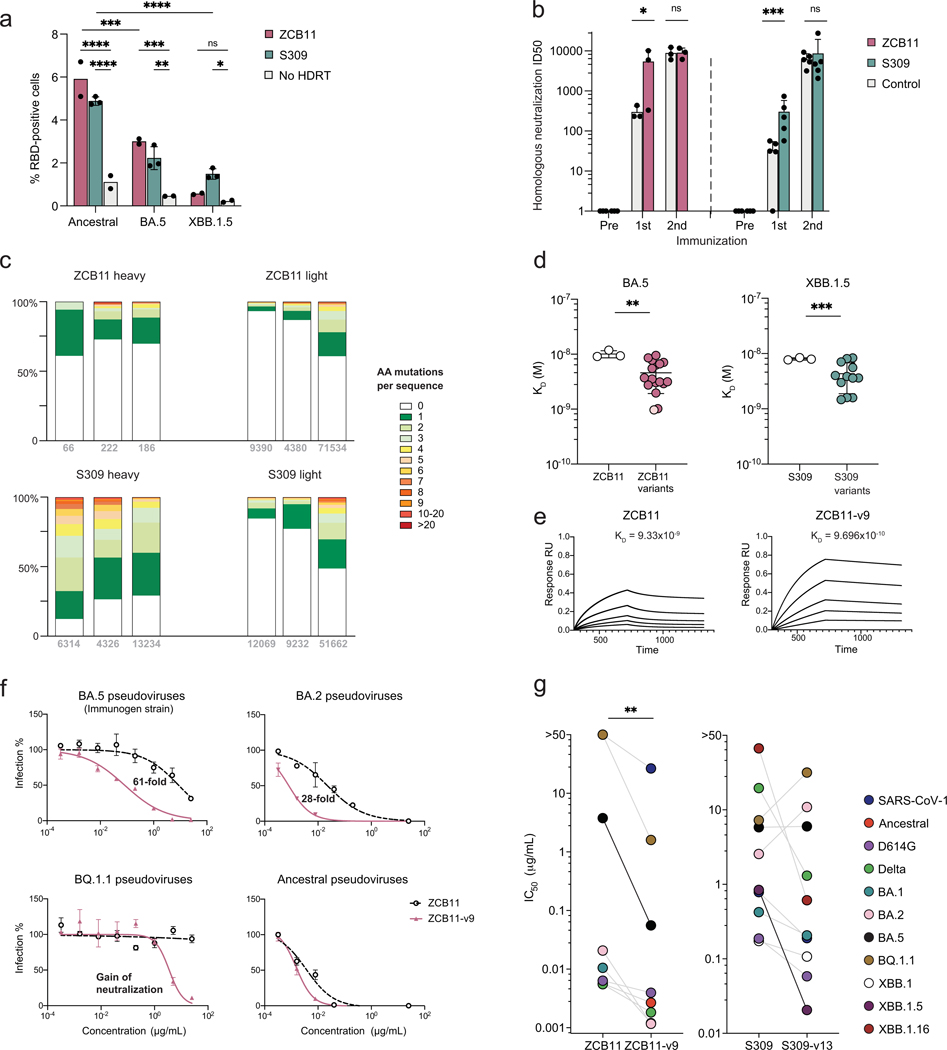
Mice adoptively transferred with mouse B cells edited via CRISPR to express human antibody variable chains could help evaluate candidate vaccines and develop better antibody therapies. However, current editing strategies disrupt the heavy-chain locus, resulting in inefficient somatic hypermutation without functional affinity maturation. Here we show that these key B-cell functions can be preserved by directly and simultaneously replacing recombined mouse heavy and kappa chains with those of human antibodies, using a single Cas12a-mediated cut at each locus and 5' homology arms complementary to distal V segments. Cells edited in this way to express the human immunodeficiency virus type 1 (HIV-1) broadly neutralizing antibody 10-1074 or VRC26.25-y robustly hypermutated and generated potent neutralizing plasma in vaccinated mice. The 10-1074 variants isolated from the mice neutralized a global panel of HIV-1 isolates more efficiently than wild-type 10-1074 while maintaining its low polyreactivity and long half-life. We also used the approach to improve the potency of anti-SARS-CoV-2 antibodies against recent Omicron strains. In vivo affinity maturation of B cells edited at their native loci may facilitate the development of broad, potent and bioavailable antibodies.


Figures

ED_Fig. 1 |
ED_Fig. 1 |. B-cell editing approaches.
The human or mouse heavy- and kappa light-chain loci are represented, with HDRT shown underneath each chromosomal target. Scissors indicate a double-strand break introduced by the Cas9 CRISPR effector protein, except in this paper and in , which used the CRISPR protein Mb2Cas12a. References for each editing approach are indicated beneath each panel,,,,,,,.
ED. Fig. 2 |
ED. Fig. 2 |. Native-loci editing of a human B cell line.
a, A representation of a native loci-editing approach targeting the human heavy chain locus. Jeko-1 cells were electroporated with an RNP complex targeting the 3’ region of JH6. HDRTs were delivered as double-stranded DNA (dsDNA) or via AAV6, as indicated. The HDRT encodes the recombined heavy-chain variable gene bounded by homology arms complementary to the sequence encoding the promoter of VH7–81 (5’ homology arm) and the intronic region downstream of JH6 (3’ homology arm). b, A similar representation of a native-loci editing approach for overwriting the human kappa-chain variable region. The light-chain HDRT similarly encodes the recombined kappa-chain variable region with homology arms complementary to the Vκ2–40 promoter sequences (5’ homology arm), and the intronic region downstream of Jκ5 (3’ arm). c, Representative flow-cytometry analysis of Jeko-1 cells edited as shown in panel (a) (IgH) or (a and b) (IgH+Igκ). Cells were analyzed using the same soluble HIV-1 envelope glycoprotein trimer (CRF250-SOSIP) conjugated to different fluorophores. Numbers with the gate indicate the percentage of double positive cells. Note the markedly greater editing efficiency when HDRT is provided as an AAV vector. d, Different gRNA-targeting approaches were used with the same HDRT to overwrite the native Jeko-1 IgH variable-chain gene. RNP complexes were loaded with gRNA targeting the JH6 segment (JH6ex), the V7–81 promoter and the JH6 segment (VH7+JH6ex), or the same promoter and the intronic region downstream of JH6 (VH7+intron), as shown at left. Jeko-1 cells were electroporated with the RNP and the indicated HDRT, and analyzed by flow cytometry (right panel). Cells were stained with fluorescently labeled CRF250 SOSIP-APC (vertical axis) and CRF250 SOSIP-PE (horizontal axis). Numbers within the gate indicate the percent of cells expressing the VRC26.25 heavy chain. Data from all studies is summarized at right. Mean ± s.d, n = 3 independent experiments. Significance was determined by one-way ANOVA with Tukey’s multiple comparison tests: **p = 0.008; **p = 0.0015; ***p = 0.0003. e, A comparison between native-loci strategy (Template: native) shown in panel (a) and a JH6 replacement approach (Template: JH6) in which a heavy-chain variable region together with a promoter is edited into the JH6 region. Edited cells were analyzed as in panel (d). Data from all studies is summarized at right. Mean ± s.d, n = 3 independent experiments. Significance was determined by one-way ANOVA with Tukey’s multiple comparison tests: **p = 0.0037; ***p = 0.0004; ****p < 0.0001. f, Genomic DNA of Jeko-1 cells edited with a native-locus strategy to introduce the heavy chain of VRC26.25 was isolated and amplified using the primer represented as red arrows. Unedited Jeko-1 cells were used as a control. The circled red band is ~5.45 kb, the expected size of the amplicon after integration between the V7–81 promoter and intronic region immediately after JH6. Sanger-sequencing confirmed that the full VRC26.25 heavy-chain gene was inserted at the expected site. g, Genomes of wild-type Jeko-1 cells or Jeko-1 cells expressing VRC26.25 were sequenced entirely. Reads were mapped to human chromosome 14, and analyzed using Integrative Genomic Viewer (IGV). The top panel represents the human heavy-chain locus. The coverage depth of the indicated regions is shown at the homology-arm target regions and proximal to an interior V segment. Note the drop in coverage between the homology arm targets in the histogram of edited cells, consistent with excision of this region in the productive allele. This histogram is representative of two experiments with similar results.
ED Fig. 3 |
ED Fig. 3 |. Optimizing HDRTs and gRNAs in primary murine B cells.
a, A representation of part of the murine heavy-chain locus used to indicate the locations of V1–85, −82, −64, −55, and −53 segments. HDRTs with 5’ homology arms complementary to the indicated region in the promoter of each variable gene, as well as an HDRT with a 5’ homology arm complementary to the consensus of V1-family genes in the same region, were compared. All 3’ homology arms were identical and complementary to the intronic region immediately 3’ of JH4. Homology arms and their target regions are indicated in gray. The bottom panel indicates editing efficiency as determined by flow cytometry using two differently labeled CRF250-SOSIP antigens. Mouse primary B cells were electroporated using the same JH4-targeting RNP and HDRTs encoding the VRC26.25-y heavy chain with 5’ homology arms complementary to the indicated VH1 gene. Note that targeting the VH1–85 and VH1–64 genes resulted in most efficient editing. b, gRNAs that cut near JH4 or Jκ5 were characterized. The panels indicate editing efficiency as determined by flow cytometry using two differently labeled CRF250-SOSIP antigens. RNP complexes were loaded with the indicated gRNAs and HDRTs inserting the VRC26.25-y heavy chain (top) or 10–1074 heavy and light chains (bottom panel). Red text indicates gRNAs used in the main text to edit heavy (gRNA-A) and light (gRNA-2) loci. c, A summary of results in Fig. 1c and 1f, here directly comparing native-loci and intron-targeted editing approaches for both antibodies. Horizontal lines indicate mean values, n = 11 (Native), n = 6 (Intron). Significance was determined by unpaired two-tailed t tests: nsp = 0.5539. d, The viability of primary murine B cells, engineered by native-loci or intron-targeting approaches, was assessed by trypan-blue staining three days post-electroporation. These cells were also compared to cells without electroporation and cells electroporated in the absence of HDRT, as indicated. Mean ± s.d, n = 4 independent experiments. Statistical significance was determined by one-way ANOVA followed by Tukey’s multiple comparisons: nsp = 0.9958; nsp = 0.1507; *p = 0.0222. e, The gating strategy of Fig. 1g is presented at left. Engineered primary murine B cells were stained with an anti-IgM antibody and CRF250 SOSIPs. Cells were gated into SOSIP-positive and -negative populations, and the IgM expression of each population is represented at the right. Unedited cells were cultured under identical conditions without electroporation.
ED Fig. 4 |
ED Fig. 4 |. Characterization of plasma and cells from recipient mice.
a, Figure represents the immunogen and immunization schedule for 10–1074 mice (top) or VRC26.25-y mice (bottom) engrafted with native-loci- and intron-edited B cells in Fig. 2. 10–1074 mice were immunized with the I3–01 60-mer fused to the gp120 protein of BG505. VRC26.25-y mice were immunized with a previously described SOSIP.v7 based on the CRF250 isolate (CRF250-SOSIP). Antigens were produced in GnTI-negative (GnTI) cells or Expi293 cells, as indicated. Antigens produced in GnTI-negative cells lack complex glycans. b, Figure shows the frequency of CRF250 SOSIP-binding cells among blood-derived CD45.1+ donor B cells following each immunization for the indicated groups of mice described in Fig. 2. c, A representative gating strategy used for panel (d). Cells were isolated from spleen and lymph nodes of mice analyzed in Fig. 2 one week after the final immunization. Viable germinal center (GC) B cells (CD19+, CD38, GL7+) were gated and, among these viable cells, the percentage of antigen-reactive donor cells (CD45.1+, CRF250-SOSIP+) was determined. Control cells (rightmost panel) were isolated from unengrafted but identically immunized mice. d, The percent of antigen-reactive donor cells within the total GC B-cell population, determined as in panel (c), is shown. Mean ± s.d, n = 6 (Native, Intron), n = 2 (Control) mice. *p = 0.0214 (one-way ANOVA followed by Tukey’s multiple comparisons). e, The frequency of IgG and IgM constant regions was determined by next-generation sequencing of CD45.1-positive donor B cells analyzed in Fig. 2. Mean ± s.d, n = 6 (Native), n = 4 (Intron) mice. Significance is indicated from left to right: ***p = 0.0003; ***p = 0.0003 (two-way ANOVA followed by Tukey’s multiple comparisons).
ED Fig. 5 |
ED Fig. 5 |. Somatic hypermutation in B cells engineered with native-loci and intron-targeting approaches.
a, Figure similar to that in Fig. 3c except that results from the indicated antibodies are presented separately. Mean ± s.d, n = 3 (Native) n = 2 (Intron) mice. **p = 0.0030; *p = 0.0387; *p = 0.0106; *p = 0.0466; Two-way ANOVA with Šídák’s multiple comparisons. b, Figure similar to that in Fig. 3d except that results from the indicated antibodies are presented separately. Horizontal lines indicate mean values. Significance was determined by two-way ANOVA with Šídák’s multiple comparisons and indicated from left to right: ***p = 0.0008; nsp = 0.5330; nsp = 0.5116; nsp = 0.9922. c, The percent of amino-acid mutations in each heavy and light-chain CDR and framework (FR) region from native loci- and intron-edited B cells is indicated for each mouse. Horizontal line indicates the average number of mutations found in each region. **p = 0.0056; *p = 0.0232; **p = 0.0018; Two-way ANOVA with Šídák’s multiple comparisons.
ED Fig. 6 |
ED Fig. 6 |. 10–1074 heavy-chain variants isolated from engrafted mice.
a, The sequences of wild-type 10–1074, 15 10–1074 heavy-chain sequences randomly selected from the native-loci edited cells, and all three functional sequences from intron-edited cells, each characterized in Fig. 5, are provided with Kabat numbering indicated. Differences from wild type are indicated in red. The affinity of each sequence for CRF250-SOSIP trimers as determined by surface plasmon resonance (SPR) is provided at the right. Variants with greater than 10-fold higher affinity over wild-type are indicated in red. b, Pearson correlations between each pair of the three assays in Fig. 5b are presented. Dark line indicates best-fit linear regression. Grey indicates ± 95% confidence intervals. The square of correlation (R2) and significance are presented in the figure.
ED Fig. 7 |
ED Fig. 7 |. Down-selection of 10–1074 variants.
a, The frequency of heavy- and light-chain amino-acid mutations averaged from three mice engrafted with native-loci edited 10–1074 cells is shown. White arrowheads indicate positions where the most frequent mutation emerged in more than one mouse, the criteria for further characterization. Two arrowheads indicate that two different amino-acid substitutions were present at the same position. b, Neutralization (IC50) values against the CRF250 or BG505-T332N isolates of 10–1074 variants, each bearing a single mutation marked with triangles in panel (a), are presented. Values are compared to the average independent measurements of the IC50 of wild-type 10–1074 against CRF250 pseudoviruses and BG505-T332N pseudoviruses (n = 5). Horizontal lines indicate geometric mean IC50 values. Dark blue dots indicate four heavy chain variants and one light chain variant with the lowest average IC50 across both isolates. These variants, listed below the figure, were further characterized in combination in panel (c). c, Neutralization potencies of the 10–1074 variants bearing single, double, or triple combinations of the five mutations highlighted in dark blue in panel (b). Horizontal lines indicate geometric means. CDRH3 mutations, V100dM and S100fA, indicated in red, combined to enhance 10–1074 neutralization more efficiently than other combinations. d, The structure of 10–1074 Fab bounded with BG505 SOSIP.664 (PDB 6UDJ). The three gp120 subunits of BG505 SOSIP.664 are indicated in gray, yellow, and light green. Glycans resolved in the structure are indicated with dark green spheres. 10–1074 Fab fragments are shown, with the 10–1074 heavy chain shown in salmon, and the light chain in light blue. Inset highlights the two residues, V100d and S100f, whose mutation to methionine and alanine, respectively, improved neutralization of most isolates tested. V100d interacts with the glycan appended to gp120 N332, and with the ‘GDIR’ region (residues 324 to 327) and H330 at the C-terminus of the gp120 third variable loop. S100f interacts primarily with the N332 glycan.
ED Fig. 8 |
ED Fig. 8 |. Further characterization of 10–1074 variants.
a, A table presents nomenclature and mutations of 10–1074 variants characterized in the subsequent panels, each bearing the combination of V100dM and S100fA. b, A summary of IC50 values similar to that in Fig. 6c, except that 10–1074 variants listed in panel (a) were characterized. Significant differences between wild-type 10–1074 and each variant were determined by a repeated one-way ANOVA followed by Dunnett’s multiple comparison tests, **p = 0.0012; **p = 0.0016; ***p = 0.0007; **p = 0.0014. c, Initial characterization of the neutralizing potency of four naturally emerging variants with the highest affinity for CRF250-SOSIP, as determined in Extended Data Fig. 6a. Among these, 10–1074-v15 was neutralized the three indicated HIV-1 isolates most efficiently, and was therefore characterized with 10–1074-y3 in subsequent panels and in Fig. 6. d, Representative views of antibody binding to HEp-2 cells measured by an immunofluorescence assay (IFA) with 100 μg/mL of the indicated bNAbs, and used to generate Fig. 6d. Negative indicates serum without polyreactivity provided by the manufacturer. e, A study similar to that shown in Fig. 6e and a summary table of half-lives with 95% CI obtained from both studies are presented. For each time point, the antibody concentrations were calculated. Mean ± s.d, n = 4 mice. Significance in comparison to wild-type 10–1074 was determined by mixed-effects model of repeated measures followed by Dunnett’s multiple comparison tests.
ED Fig. 9 |
ED Fig. 9 |. B cells edited to express SARS-CoV-2 neutralizing antibodies.
a, Table lists amino-acid receptor-binding domain (RBD) differences from ancestral SARS-CoV-2. Residue numbers, based on the ancestral S protein, are indicated. b, Representative plots of edited cells expressing ZCB11 or S309 used to generate Fig 7a. Cells were analyzed by flow cytometry using the S-protein RBD of the indicated SARS-CoV-2 variants conjugated to APC. Control cells were electroporated with the same RNP complex without HDRT (no HDRT). Numbers indicate the percentage of RBD-positive cells. c, Figure represents the mRNA-expressed antigen used to drive affinity maturation of the SARS-CoV-2 neutralizing antibodies ZCB11 and S309. As indicated, RBD antigens of the BA.5 (ZCB11) and XBB.1.5 (S309) Omicron variants were modified to include four additional glycans (white, pre-existing glycans; green, engineered glycans) that promote expression and immunogenicity. These RBDs were fused to the S-protein transmembrane domain through an 8-amino acid linker (GGGSGGTG). Numbers indicate S-protein position. d. A schedule of immunization and blood collection used to generate plasma and cells analyzed in Fig. 7 and panel (e). e, Neutralization studies of plasma against the BA.5 (ZCB11; n = 3 mice) or XBB.1.5 (S309; n = 5 mice) immunogen variants are presented. Panels characterize plasma before and after each of two vaccinations from mice engrafted with B cells edited to express the indicated antibody, summarized in Fig. 7b. Negative control (grey) indicates identically vaccinated mice without adoptive transfer. Black represents pooled sera from mice pre-immunization. Each curve is fitted to the mean of two independent replicates.
ED Fig. 10 |
ED Fig. 10 |. Characterization of SARS-CoV-2 antibody variants.
a, Figure shows the frequency of heavy- and light-chain amino-acid substitutions at each ZCB11 and S309 residue, observed in cells isolated from three native-loci-edited mice. Grey indicates heavy- and light-chain CDRs. SHM levels in electroporated cells cultured ex vivo without in vivo evolution are indicated with dotted lines. b, Sequences of wild-type ZCB11 heavy and light chains and their variants (top) and S309 chains and their variants (bottom), characterized in Fig. 7d, are provided. Changes from wild type are indicated in red. The affinity of these variants for the BA.5 S protein (ZCB11 variants) and XBB.1.5 RBD (S309 variants), are shown at the right of each sequence. c, Representative curves comparing S309 (grey) and S309-v13 (green) neutralization against SARS-CoV-1 and the indicated SARS-CoV-2 variants. Mean ± s.e.m, n = 3 technical replicates. A summary of IC50 values against a broader panel of variants is provided in Fig. 7g.
Fig. 1 |
Fig. 1 |. Comparison of native-loci and intron-targeted editing of mouse B-cell-receptor loci.
a, In native-loci editing, two HDRTs guide replacement of mouse heavy and kappa variable regions with exogenous analogues. RNPs cleave within murine JH4 (left) or Jκ5 (right) segments. One HDRT (left) encodes a human heavy-chain variable gene with homology arms encoding sequence upstream of the VH1–85 or VH1–64 variable segments (5’ arm) and downstream of JH4 (3’ arm). A second HDRT (right) encodes a human kappa-chain variable gene, with homology arms encoding sequence upstream of Vκ1–135 and downstream of Jκ5. b, Primary murine B cells edited as described were analyzed by flow cytometry three days post-electroporation using a soluble HIV-1 Env trimer (CRF250-SOSIP) conjugated to APC (horizontal axis) or PE (vertical axis). The bNAb introduced (10–1074 or VRC26.25-y), HDRT delivery method (dsDNA or AAV-DJ), and targets of the 5’ homology arms (heavy: VH1– 64 or VH1–85; kappa: Vκ1–135) are indicated. Control cells were electroporated with the same RNP without HDRT (no HDRT). Numbers indicate the percentage of SOSIP-positive cells. c, A summary of results from experiments like those of panel (b) using AAV vectors to template repair. Mean ± s.d, n = 5 (VRC26.25-y), n = 6 (10–1074), n = 4 (No HDRT) independent experiments. d, In a previously described editing approach, a bicistronic cassette is introduced at the intron downstream of JH4. The cassette encodes a splice acceptor (SA), an SV40 polyadenylation signal, an IgHV4–9 promoter, a human light-chain variable chain, a murine Cκ chain, a furin-cleavage site, a linker (GSG), a self-cleaving sequence (P2A), a human heavy-chain variable chain, and a splice donor (SD). This cassette is introduced with the RNP used in panel (a). In parallel, the endogenous murine kappa is eliminated by NHEJ-mediated repair. e, A flow cytometry study like that in panel (b) except that the intron-targeting approach was used. f, A summary of experiments like those shown in panel (e). Mean ± s.d, n = 2 (VRC26.26-y) n = 4 (10–1074), n = 3 (No HDRT) independent experiments. g, Primary murine B cells edited as in panels (a) or (d) were analyzed by flow cytometry with an anti-IgM antibody and fluorescently labeled CRF250-SOSIP trimers. Cells were gated into CRF250 SOSIP-positive (orange) and -negative (blue) populations. The geometric mean fluorescence intensity (gMFI) from bound SOSIP trimers (left) or IgM expression (right) is presented. Dotted line represents IgM expression of unedited murine B cells cultured in the same manner. Mean ± s.d, n = 4 (10–1074), n = 2 (VRC26.25-y). Significant results are indicated from left to right: ****p < 0.0001; **p = 0.0089; ****p < 0.0001; nsp = 0.3508; **p = 0.0011; nsp > 0.9999; two-way ANOVA with Tukey’s comparisons.
Fig. 2 |
Fig. 2 |. B-cells engineered with native-loci editing generate potent HIV-1 neutralizing plasma in vivo.
a, The schedule of immunization and blood collection used to generate plasma and cells analyzed in panels (b-f). CD45.1-positive primary B cells were engineered with either native-loci or intron editing approaches, and adoptively transferred to CD45.2-positive recipient mice. These recipient mice were immunized with CRF250 SOSIP (VRC26.25-y) or the I3–01 BG505-T332N 60-mer (10–1074) at weeks 1 3, 6, 9, and 12 after transfer. Blood was collected at weeks 2, 4, 6, 10, and 13. b, Neutralization studies against the CRF250 HIV-1 isolate are shown. Panels characterize plasma after each of five vaccinations from mice engrafted with the same numbers of SOSIP-reactive 10–1074 native-loci- and intron-edited B cells. Each panel compares plasma from three native-loci-edited (dark blue) mice with three intron-edited (light blue) mice. Naïve murine plasma mixed with 20 μg/ml of 10–1074 with a murine (purple dotted line) or human (black dotted line) constant domain served as positive controls. Negative control (gray) indicates identically vaccinated mice without adoptive transfer. Lines connect means of technical duplicates, with each curve representing a single mouse. c, A series of studies like those in panel (b) except native-loci introduced VRC26.25-y (orange) is compared to its intron-edited counterpart (yellow). Black and green dotted lines indicate plasma obtained from wild-type mice mixed with 2 μg/ml of wild-type VRC26.25 or the VRC26.25-y variant, respectively. Lines connect means of technical duplicates, with each curve representing a single mouse. d, A summary of 50% inhibitory dilution (ID50) values from panels (b) and (c). Comparisons between native-loci- and intron-editing are significant after the first immunization for 10–1074 (**p = 0.0023) and VRC26.25-y (**p = 0.0049) and after the third immunization for VRC26.25-y (**p = 0.0067), determined by mixed-effects model of repeated measures followed by Tukey’s multiple comparisons. Pooled sera from mice before immunization did not neutralize CRF250 (ID50 < 10). Mean ± s.d, n = 3 mice. e, Neutralization studies like those of panel (c) except that neutralization of heterologous isolates CNE55, WITO, and BG505-T332N was measured. Lines connect means of technical duplicates, with each curve representing a single mouse. f, A summary of ID50 values from panel (e) indicating that each plasma retained the breadth of VRC26.25-y. Mean ± s.d, n = 3 mice. Significance was determined by two-way ANOVA followed by Tukey’s multiple comparisons: **p = 0.0052.
Fig. 3 |
Fig. 3 |. Native-loci editing enables more efficient somatic hypermutation.
CD45.1 donor B cells from spleen and lymph nodes in VRC26.25-y and 10–1074 recipient mice characterized in Fig. 2 were sequenced one week after their final vaccination. a, The number of amino-acid mutations per sequence is represented with proportions in each library. Each bNAb and locus are indicated above the figure, and the number of unique sequences is shown below. b, Figure shows the frequency of amino-acid substitutions at each VRC26.25-y and 10–1074 residue, observed in three mice engrafted with native-loci-edited cells and two mice engrafted with intron-edited cells. Grey indicates heavy- and light-chain CDRs. Note the higher frequency of SHM, especially in the CDR regions, in native loci-edited mice. c, The percent of heavy- and light-chain amino-acid mutations is shown for native-loci and intron-targeting approaches for both antibodies. Mean ± s.d, n = 6 (native), n = 4 (intron) mice. ****p < 0.0001; **p = 0.0033; Two-way ANOVA with Šídák’s multiple comparisons. d, The percent of amino-acid mutations in CDRs of both antibodies is compared to those in framework (FR) regions from native-loci and intron-edited B cells. Horizontal lines indicate means. Values for individual FR and CDR regions are presented in Extended Data Fig. 5c. Significance is indicated from left to right: **p = 0.0015; nsp = 0.6465; two-way ANOVA with Šídák’s multiple comparisons.
Fig. 4 |
Fig. 4 |. VRC26.25-y and 10–1074-expressing B cells can be combined to provide broader neutralization.
a, The schedule of immunization and blood collection in panels (b-c). CD45.1-positive primary B cells were engineered with native-loci editing approach to express VRC26.25-y or 10–1074. Engineered cells were adoptively transferred to CD45.2-positive recipient mice, separately or in combination, with each mouse receiving the same number of successfully engineered cells. Mice were immunized with CRF250 SOSIPs at weeks 1 3, 6, 9, and 12 after transfer. Blood was collected at week 13. b, Neutralization studies against the indicated HIV-1 isolates using plasma harvested after the fifth immunization, according to the schedule in panel (a). X1632 and CNE55 are both resistant to 10–1074, whereas JR-FL is resistant to VRC26.25-y and CRF250 is sensitive to both antibodies. Each panel compares plasma from two VRC26.25-y mice (orange), two 10–1074 mice (blue), and two mice receiving both antibodies (green). Naïve murine plasma mixed with 20 μg/ml of 10–1074 with human (black line) constant domain, 2 μg/ml of wild-type VRC26.25 (gray dashed line) or the VRC26.25-y variant (black dashed line), serve as positive controls. Negative control (gray) indicates identically vaccinated mice without adoptive transfer. Lines connect means of technical duplicates, with each curve representing a single mouse. No neutralization was observed in pooled sera from mice before immunization. c, The average frequency of amino-acid substitutions at each position of the VRC26.25-y and 10–1074 heavy chains in mice engrafted to express both antibodies.
Fig. 5 |
Fig. 5 |. Affinity maturation of 10–1074 in wild-type mice.
a, Phylogenetic analyses are presented of heavy-chain 10–1074 variants with multiple amino-acid substitutions isolated one week after the final immunization from mice characterized in Figs. 2 and 3. Distance from wild-type 10–1074 indicates the number of amino-acid substitutions. The affinity of unmutated 10–1074 (white) and 15 randomly selected variants (pink and red), is provided for native loci-edited cells. Red indicates four variants with affinities 10-fold higher than wild-type 10–1074. Grey indicates uncharacterized variants. Among intron-edited cells, blue indicates three characterized variants with affinity provided, while grey indicates four uncharacterized variants that did not express. b, Panel represents the affinity of 15 sampled native loci-edited and 3 intron-edited variants, as determined by SPR, their association with cell-expressed Env as determined by flow cytometry, and their neutralization potency. Higher affinity variants are indicated in red, corresponding to those in panel (a). Mean ± s.d, n = 5 (wild-type), n = 15 (native-loci), n = 3 (intron). Significance was determined by Welch’s ANOVA with Dunnett’s multiple comparisons: *p = 0.0159, nsp = 0.2882 (affinity); ****p < 0.0001, nsp = 0.2713 (surface binding); **p = 0.0018, nsp = 0.5989 (neutralization). c, Mutations of the four highest-affinity variants are listed.
Fig. 6 |
Fig. 6 |. More potent and bioavailable 10–1074 variants.
a, Frequent 10–1074 heavy- and light-mutations identified in more than one mouse, defined in Extended Data Fig. 7a, were introduced individually into wild-type 10–1074. Their neutralization activity against CRF250 and BG505-T332N isolates was measured. The proportion of variants neutralized by each antibody, or by both antibodies, is represented. The number of variants characterized is indicated within each circle. b, Heavy-chain mutations of the four variants characterized in subsequent panels are listed with their amino-acid substitutions. c, A summary of IC50 values for wild-type 10–1074 and each 10–1074 variant is presented. Each point represents a mean of two independent sets of triplicates. Geometric mean values are indicated by a horizontal bar. Geometric mean values for 10–1074-sensitive isolates, for all isolates, and the breadth of each variant are indicated beneath the figure. Asterisks indicate significant differences between the indicated variant and wild-type 10–1074 (***p = 0.0008; **p = 0.0015; **p = 0.0027; repeated one-way ANOVA followed by Dunnett’s multiple comparison tests). d, The polyreactivity of wild-type 10–1074 and the indicated 10–1074 variants including the rationally engineered 10–1074GM were compared to polyreactive antibodies PGT128 and NIH45–46W by immunofluorescence assays (IFA), using HEp-2 cells and 100 μg/ml of each antibody. Mean ± s.d, n = 3 independent measurement. 10–1074 variants generated in this study (-y3, -v1, -v15) retained the low polyreactivity of wild-type 10–1074 (nsp = 0.8521; nsp = 0.5496, nsp = 0.7597; one-way ANOVA with Dunnett’s comparison tests). In contrast, 10–1074GM was significantly more polyreactive than 10–1074 (***p = 0.0003). PGT128, and NIH45–46W serve as positive controls, with significantly greater polyreactivity than 10–1074 (****p < 0.0001; ****p < 0.0001). Line indicates the value of a negative control sample provided by the manufacturer. Representative images of HEp-2 bound to the indicated antibodies are provided in Extended Data Fig. 8d. e, 5 mg/kg of the indicated 10–1074 variant was infused into homozygous human FcRn Tg32 mice per group. Blood was drawn and antibody concentration was determined at the indicated time points. Mean ± s.d, n = 5 (10–1074, 10–1074-v1, 10–1074-v15), n = 4 (10–1074-y3, 10–1074GM) mice. Asterisks adjacent to each point indicate significant differences between wild-type 10–1074 and the indicated variant, determined by mixed-effects model of repeated measures followed by Dunnett’s multiple comparison tests (from earlier to later for each variant: 10–1074-y3: *p = 0.0184; 10–1074-v1: *p = 0.0251; *p = 0.0388; *p = 0.0236; *p = 0.0323; 10–1074-v15: *p = 0.0432; **p = 0.0051; 10–1074GM: *p = 0.0315; ***p = 0.0007; ***p = 0.0002; **p = 0.0083; **p = 0.0053). A second study with similar results is presented in Extended Data Fig. 8e.
Fig. 7 |
Fig. 7 |. Affinity maturation of SARS-CoV-2 neutralizing antibodies.
a, ZCB11 or S309 heavy- and light-chains were introduced by native-loci editing into primary murine B cells. Cells were analyzed by flow cytometry using the indicated SARS-CoV-2 RBDs. Control cells were electroporated with the same RNPs without HDRT (no HDRT). Mean ± s.d, n = 2 (ZCB11, no HDRT), n = 3 (S309) independent experiments. Significance was determined by two-way ANOVA followed by Tukey’s multiple comparison tests, from left to right: ****p < 0.0001; ****p < 0.0001; ***p = 0.0005; ***p = 0.0002; **p = 0.0022; ****p < 0.0001; nsp = 0.7093; *p = 0.0197. b, Mice were immunized at weeks 1 and 5 with LNP-encapsulated RNA expressing membrane-bound, glycan-modified RBDs (gRBD-TM). ZCB11- and S309-engrafted mice were immunized, respectively, with BA.5 or XBB.1.5 gRBD-TM variants. Neutralization activity was measured against their respective immunogen strains from serum harvested after each immunization. ‘Pre’ indicates serum from mice before engraftment. Control indicates identically vaccinated mice without adoptive transfer. Mean ± s.d, n = 3 (ZCB11), n = 5 (S309) mice. Significance was determined by mixed-effects model of repeat measures followed by Šídák’s multiple comparison tests, from left to right: *p = 0.0188; nsp > 0.9999; ***p = 0.0006, nsp > 0.9999. c, The number of mutations per unique sequence isolated from CD45.1-positive B cells from spleen and lymph nodes of mice characterized in panel (b) is represented. Number beneath each bar indicates the number of unique sequences for each mouse. d, Heavy and light chain variants with amino-acid substitutions found in multiple mice were expressed and characterized by bilayer interferometry (BLI) for their ability to bind their respective immunogen RBDs. 17 ZCB11 variants were analyzed with the BA.5 S protein and 12 S309 variants were analyzed with the XBB.1.5 RBD. These affinities were compared to three independent measurements using unmodified antibodies (WT). The highest affinity ZCB11 variant, ZCB11-v9, is indicated by a lighter red. Mean ± s.d, n = 3 (WT), n = 17 (ZCB11 variants), n = 12 (S309 variants). Significance was determined by unpaired two-tailed t tests with Welch’s correction: **p = 0.0047; ***p = 0.0003. e, BLI binding curves like those used to generate panel (d), comparing unmodified ZCB11 and ZCB11-v9, with KD values indicated. f, Neutralization curves comparing ZCB11 (grey) and ZCB11-v9 (red) against selected SARS-CoV-2 isolates are presented. Mean ± s.e.m, n = 3 technical replicates. g, Each point represents the IC50 values for a panel of SARS-CoV-1 or −2 variants of wild-type ZCB11 and S309, as well as ZCB11-v9 and S309-v13, generated as in panel (f) and Extended Data Fig. 10c. A dark line indicates the immunogen strain. Each point represents a mean IC50 of two independent sets of triplicates. Significance was determined by paired two-tailed t tests: **p = 0.0047.

Update of

Similar articles

Cited by

References

    1. Hoogenboom HR Selecting and screening recombinant antibody libraries. Nature biotechnology. 23, 1105–1116 (2005). - PubMed
    1. Liu W, Meckel T, Tolar P, Sohn HW, & Pierce SK Antigen affinity discrimination is an intrinsic function of the B cell receptor. Journal of Experimental Medicine. 207, 1095–1111 (2010). - PMC - PubMed
    1. Shih TA, Meffre E, Roederer M, & Nussenzweig MC Role of BCR affinity in T cell–dependent antibody responses in vivo. Nature immunology. 3, 570–575 (2002). - PubMed
    1. Wardemann H. et al. Predominant autoantibody production by early human B cell precursors. Science. 301, 1374–1377 (2003). - PubMed
    1. Jarasch A. et al. Developability assessment during the selection of novel therapeutic antibodies. Journal of pharmaceutical sciences. 104, 1885–1898 (2015). - PubMed

Publication types