. 2024 May;8(5):1010-1020.
doi: 10.1038/s41559-024-02367-y. Epub 2024 Mar 14.

Emergence and maintenance of stable coexistence during a long-term multicellular evolution experiment

Affiliations

Emergence and maintenance of stable coexistence during a long-term multicellular evolution experiment

Rozenn M Pineau et al. Nat Ecol Evol. 2024 May.

Abstract

The evolution of multicellular life spurred evolutionary radiations, fundamentally changing many of Earth's ecosystems. Yet little is known about how early steps in the evolution of multicellularity affect eco-evolutionary dynamics. Through long-term experimental evolution, we observed niche partitioning and the adaptive divergence of two specialized lineages from a single multicellular ancestor. Over 715 daily transfers, snowflake yeast were subjected to selection for rapid growth, followed by selection favouring larger group size. Small and large cluster-forming lineages evolved from a monomorphic ancestor, coexisting for over ~4,300 generations, specializing on divergent aspects of a trade-off between growth rate and survival. Through modelling and experimentation, we demonstrate that coexistence is maintained by a trade-off between organismal size and competitiveness for dissolved oxygen. Taken together, this work shows how the evolution of a new level of biological individuality can rapidly drive adaptive diversification and the expansion of a nascent multicellular niche, one of the most historically impactful emergent properties of this evolutionary transition.


Conflict of interest statement

Competing interests

The authors declare no competing interests.

Figures

Extended Data Fig. 1 |
Extended Data Fig. 1 |. Size distributions of isolates from the ancestor and the five lines subject to long term evolution, after 715 days of serial transfers ( ~ 4,300 generations).
We observe the emergence of phenotypic diversity in lines PO-3, PO-4 and PO-5. The different colors denote different isolates.
Extended Data Fig. 2 |
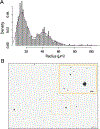
Extended Data Fig. 2 |. Standing diversity within population PO-4.
(A) Whole population size distribution (n > 1000) and b picture of PO-4 after 715 days of serial transfers ( ~ 4300 generations). Large-sized snowflake yeast were present at a mean frequency of 9.4% in the whole t715 population (Extended Data Fig. 4). This image is representative of the whole population.
Extended Data Fig. 3 |
Extended Data Fig. 3 |. Phylogeny of independently evolved line PO-3, showing deep divergence between Small and Large isolates.
They do not share any mutations, indicating that the last common ancestor of these lineages was the genotype used to found the experiment, and these lineages have been coexisting for the full duration of the experiment. Here, the color represents the phenotype (Small or Large), and numbers PO-3–1, PO-3–2, and PO-3–3 represent three isolates of Small and Large yeast sampled from line PO-3.
Extended Data Fig. 4 |
Extended Data Fig. 4 |. Coexistence over time.
To examine the stability of coexistence throughout the experiment, we measured the frequency and group size at time 200, 400 and 600. We estimated the frequency of large and small phenotypes by segmenting microscopy images at these timepoints. (A) The large phenotype declined in frequency as a function of time, at approximately 1.3% per 100 transfers (y = 11.96 −.013x, P = 0.00017, linear regression. Adjusted R2 = 0.86). Bars represent one standard deviation. (B) There were no obvious differences in the size of large and small phenotypes over time, though the main effects of time and phenotype were highly significant (F1, 18173 = 226.8 and 6989.5, respectively, P < 10−15 for each, two-way ANOVA), as was the interaction between phenotype and time (F1,18173 = 23.7, P < 10−5). Bars represent one standard deviation. (C) Snapshots of PO-4 populations for each time point measured.
Extended Data Fig. 5 |
Extended Data Fig. 5 |. Frequency dependence and specialization along a growth-survival trade-off.
To test for frequency dependence in the experiment, we initiated one round of growth and one round of settling selection starting from a wide range of initial 10 frequencies (from 1% to 99%). The proportion of Large clusters after 24 hours of growth (A), but not after settling (B), is frequency dependent. Linear regression fit for growth: β = −1.5, R2 = 0.6, P = 0.0002; Linear regression fit for selection: β = −1.2, R2 = 0.04, P = 0.2.
Fig. 1 |
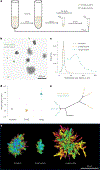
Fig. 1 |. Emergence and long-term coexistence of large and small snowflake yeast phenotypes.
a, Daily transfers consist of 24 h of batch culture in which selection favours faster growth, followed by a round of settling selection for larger group size. b, While the experiment started from a monomorphic multicellular ancestor, after 715 rounds of selection, the population is composed of large and small phenotypes (here, Small are marked with GFP to differentiate them from Large). c, We measured the cluster size distribution via microscopy. Small-sized snowflake yeast (yellow) are similar in size to their ancestor (grey). The volume of large-sized snowflake yeast isolates (teal), in contrast, is on average 48 times larger. d, The Large genotype evolved highly elongate cells with a mean aspect ratio (length to width) of 2.36, while the Small genotype became nearly perfectly spherical (aspect ratio 1.01) from the ancestor’s slightly oblate cells (aspect ratio 1.14) (n = 128 for ancestor cells, 120 for large cells and 50 for small cells). Bars represent 1 s.d. e, The phylogeny of the Small and Large genotypes reveals that they only share one mutation in common, indicating that the lineages leading to each genotype have been coexisting throughout the majority of our long-term evolution experiment (PO-4–1 to 3 in yellow are the three Small isolate strains and PO-4–1 to 3 in teal are three Large isolate strains). f, Differences in cellular morphology between the multicellular ancestor, Small and Large genotypes shown via confocal microscopy. Pictured are representative clusters from the populations. Note that the Large cluster shown here is smaller than its maximum possible size (this cluster is in the 40th percentile of size). Colour indicates depth.
Fig. 2 |
Fig. 2 |. Coexistence between Small and Large group-forming genotypes is mediated by oxygen.
a, Under standard oxygen conditions (~26% PAL, grey), our populations converge on an equilibrium of ~9% Large snowflake yeast after the growth phase regardless of their starting frequency (n = 8). b, Under standard oxygen conditions, frequency-dependent selection maintains coexistence between Small and Large strains at 9% Large clusters. Data points reflect changes in frequency of each genotype between days 1 and 6 of the competition reported in a. Linear regression for Small y = −0.095 + 1.03x, P < 0.01, adjusted R2 = 0.96. c, The Large genotype has an advantage under supplemental oxygen, increasing to a mean equilibrium frequency of 86% in a high-oxygen environment (~84% PAL, dark blue, n = 6).
Fig. 3 |
Fig. 3 |. Coexistence arises in a general model via size-dependent trade-offs between growth rate and survival.
a, The grey area shows combinations of growth and size ratios that establish coexistence between pairs of Small and Large snowflake clusters, when the population expands and contracts by the mean amount during each transfer of the MuLTEE, 32 fold (that is, X=32). Coexistence is possible in this grey shaded region. b, The selection coefficient for large clusters is shown as a function of starting proportions of large clusters (using parameters X=32,λr=2,nr=32) for different phases of the competition. Selection coefficients during growth, but not during settling, are negatively frequency dependent. The combination of selection coefficients is 0 when large clusters are 10% of the population, meaning both genotypes coexist. Since the combined selection coefficient for Large is positive below 10% and negative above it, coexistence is stable to perturbations in the genotype frequency.
Fig. 4 |
Fig. 4 |. Selection drives divergence via character displacement.
a, In a clonal population of Small snowflake clusters, there is a range (shown in grey) of larger cluster-forming genotypes that can invade and establish a stable coexistence (for example, the strain indicated by the empty circle). b, This pair of coexisting strains establishes a fitness isocline (dotted line) that determines the type of future strains that can invade (that is, above the fitness isocline). A larger, slower-growing mutant of the Large strain, shown with an ‘x’, falls below the line and cannot invade. c, A mutation that increases the growth rate of the Small genotype (yellow circle) displaces its ancestor and establishes a new, steeper fitness isocline (red line in d). d, In the context of this new fitness isocline, the larger, slower-growing mutant of the Large strain shown in b can now invade. Taken together, this illustrates how coexistence can arise from a monomorphic ancestor and how adaptation by Small and Large types can drive divergence via character displacement.
Fig. 5 |
Fig. 5 |. The divergent traits of Large and Small genotypes appear to have arisen via character displacement.
a, To determine whether competition between Large and Small snowflake yeast strains has driven divergence due to character displacement, we evolved five replicate populations of the Small and the Large isolates separately for 40 days. Removing their competitor resulted in the rapid evolution of intermediate sizes, with the Small strain evolving to be approximately twice as large (14–27 μm), while the Large strain shrank on average by 15% (from 55 μm to 47 μm). This suggests that the divergence seen between these strains was the result of competitive interactions, with character displacement evolving to minimize competitive overlap at intermediate phenotypes. b, We observe the re-emergence of Small and Large strain diversity in the Small monoculture re-evolution experiments in as little as 15 transfers. Shown is an image from a replicate population after 40 days.

Update of

Similar articles

Cited by

References

    1. Maloof AC et al. The earliest Cambrian record of animals and ocean geochemical change. GSA Bull. 122, 1731–1774 (2010).
    1. McMahon S & Parnell J The deep history of Earth’s biomass. J. Geol. Soc. 175, 716–720 (2018).
    1. Delwiche CF & Cooper ED The evolutionary origin of a terrestrial flora. Curr. Biol. 25, R899–R910 (2015). - PubMed
    1. Odling-Smee FJ, Laland KN & Feldman MW Niche construction. Am. Nat. 147, 641–648 (1996).
    1. Boyce CK The evolutionary history of roots and leaves. in Vascular Transport in Plants (eds Holbrook NM & Zwieniecki MA) 479–499 (Elsevier, 2005).

MeSH terms