

A first characterization of the microbiota-resilience link in swine
- PMID: 38486255
- PMCID: PMC10941389
- DOI: 10.1186/s40168-024-01771-7
A first characterization of the microbiota-resilience link in swine
Abstract
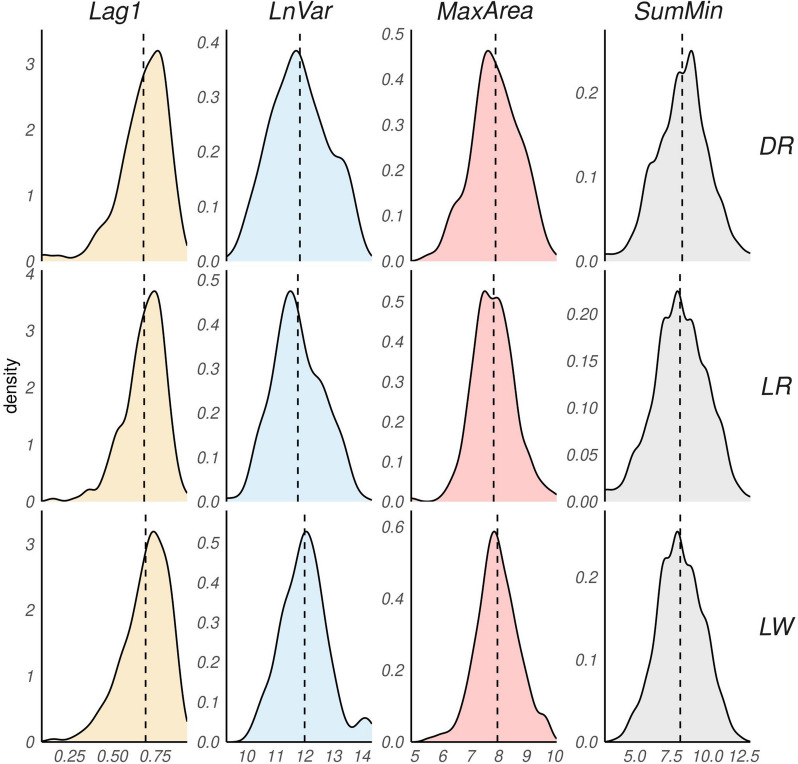
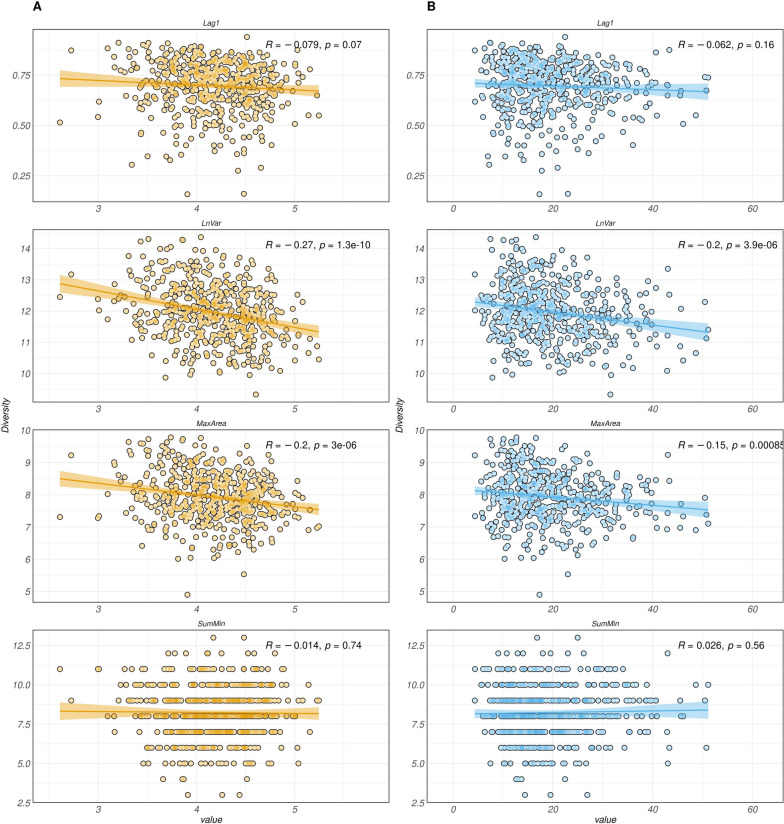
Background: The gut microbiome plays a crucial role in understanding complex biological mechanisms, including host resilience to stressors. Investigating the microbiota-resilience link in animals and plants holds relevance in addressing challenges like adaptation of agricultural species to a warming environment. This study aims to characterize the microbiota-resilience connection in swine. As resilience is not directly observable, we estimated it using four distinct indicators based on daily feed consumption variability, assuming animals with greater intake variation may face challenges in maintaining stable physiological status. These indicators were analyzed both as linear and categorical variables. In our first set of analyses, we explored the microbiota-resilience link using PERMANOVA, α-diversity analysis, and discriminant analysis. Additionally, we quantified the ratio of estimated microbiota variance to total phenotypic variance (microbiability). Finally, we conducted a Partial Least Squares-Discriminant Analysis (PLS-DA) to assess the classification performance of the microbiota with indicators expressed in classes.
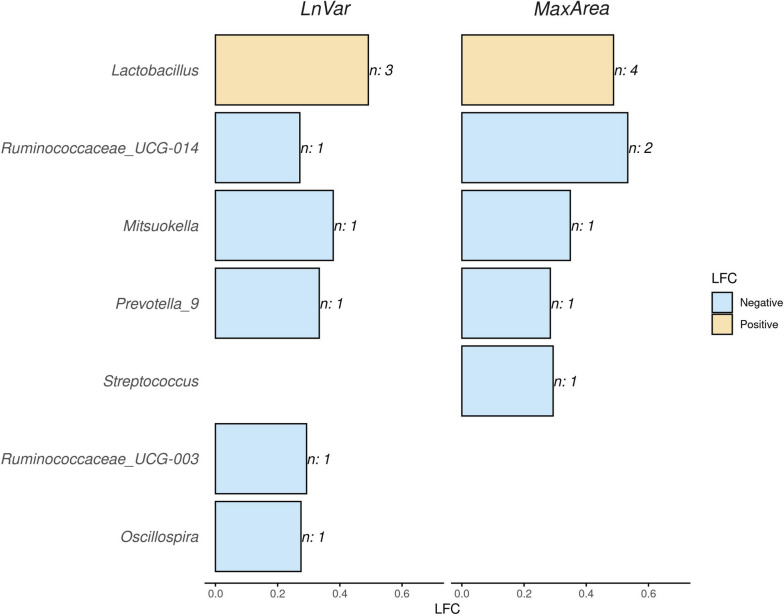
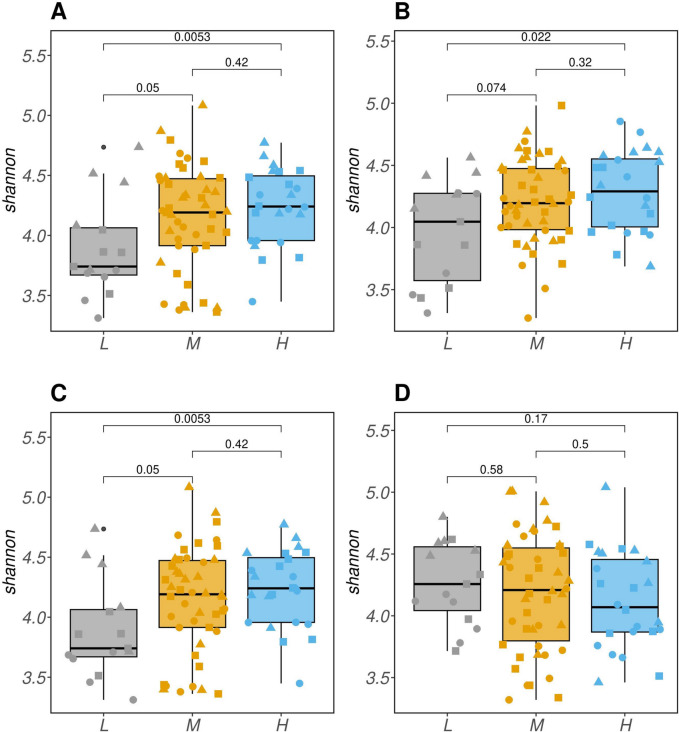
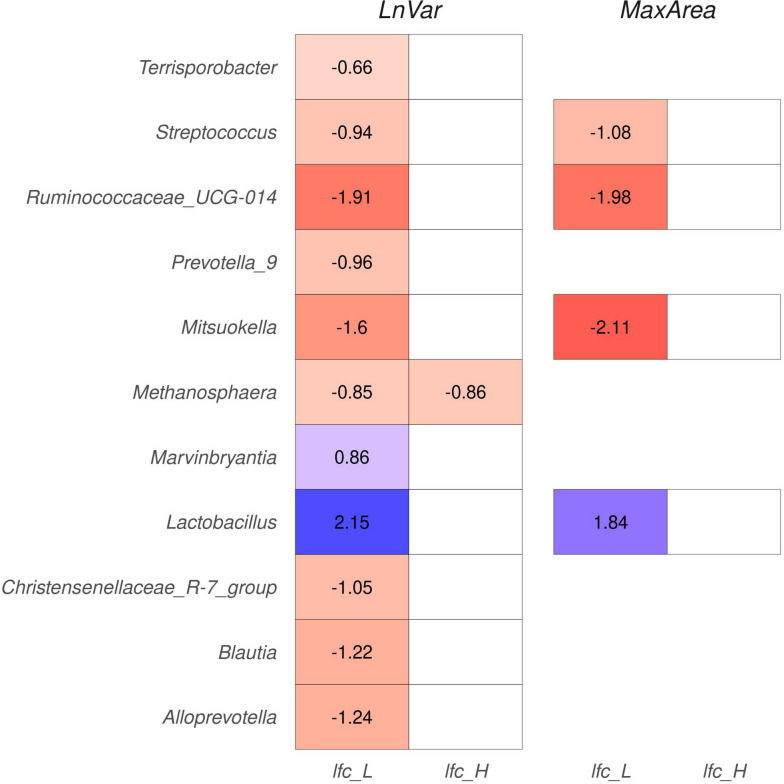
Results: This study offers four key insights. Firstly, among all indicators, two effectively captured resilience. Secondly, our analyses revealed robust relationship between microbial composition and resilience in terms of both composition and richness. We found decreased α-diversity in less-resilient animals, while specific amplicon sequence variants (ASVs) and KEGG pathways associated with inflammatory responses were negatively linked to resilience. Thirdly, considering resilience indicators in classes, we observed significant differences in microbial composition primarily in animals with lower resilience. Lastly, our study indicates that gut microbial composition can serve as a reliable biomarker for distinguishing individuals with lower resilience.
Conclusion: Our comprehensive analyses have highlighted the host-microbiota and resilience connection, contributing valuable insights to the existing scientific knowledge. The practical implications of PLS-DA and microbiability results are noteworthy. PLS-DA suggests that host-microbiota interactions could be utilized as biomarkers for monitoring resilience. Furthermore, the microbiability findings show that leveraging host-microbiota insights may improve the identification of resilient animals, supporting their adaptive capacity in response to changing environmental conditions. These practical implications offer promising avenues for enhancing animal well-being and adaptation strategies in the context of environmental challenges faced by livestock populations. Video Abstract.
Keywords: Animal-health; Gut microbiota; Pigs; Resilience.
© 2024. The Author(s).
Conflict of interest statement
The authors declare no competing interests.
Figures


Similar articles
-
Exploring methods to summarize gut microbiota composition for microbiability estimation and phenotypic prediction in swine.J Anim Sci. 2022 Sep 1;100(9):skac231. doi: 10.1093/jas/skac231. J Anim Sci. 2022. PMID: 35775583 Free PMC article.
-
Selection for environmental variance shifted the gut microbiome composition driving animal resilience.Microbiome. 2023 Jul 4;11(1):147. doi: 10.1186/s40168-023-01580-4. Microbiome. 2023. PMID: 37400907 Free PMC article.
-
Gut microbiome composition differences among breeds impact feed efficiency in swine.Microbiome. 2020 Jul 22;8(1):110. doi: 10.1186/s40168-020-00888-9. Microbiome. 2020. PMID: 32698902 Free PMC article.
-
Gut Microbiota Resilience: Definition, Link to Health and Strategies for Intervention.Front Microbiol. 2020 Sep 15;11:572921. doi: 10.3389/fmicb.2020.572921. eCollection 2020. Front Microbiol. 2020. PMID: 33042082 Free PMC article. Review.
-
The Profound Influence of Gut Microbiome and Extracellular Vesicles on Animal Health and Disease.Int J Mol Sci. 2024 Apr 4;25(7):4024. doi: 10.3390/ijms25074024. Int J Mol Sci. 2024. PMID: 38612834 Free PMC article. Review.
Cited by
-
Effect of host breeds on gut microbiome and fecal metabolome in commercial pigs.BMC Vet Res. 2024 Oct 10;20(1):458. doi: 10.1186/s12917-024-04308-0. BMC Vet Res. 2024. PMID: 39390513 Free PMC article.
-
Use of Subtherapeutic Tylvalosin Against Mycoplasma hyopneumoniae: Implications For Respiratory Microbiome Dysbiosis and Swine Lung Health.Transbound Emerg Dis. 2025 Aug 18;2025:8903237. doi: 10.1155/tbed/8903237. eCollection 2025. Transbound Emerg Dis. 2025. PMID: 40861113 Free PMC article.
-
Capturing resilience from phenotypic deviations: a case study using feed consumption and whole genome data in pigs.BMC Genomics. 2024 Nov 21;25(1):1128. doi: 10.1186/s12864-024-11052-0. BMC Genomics. 2024. PMID: 39574040 Free PMC article.
-
Genomic regions and biological mechanisms underlying climatic resilience traits derived from automatically-recorded vaginal temperature in lactating sows under heat stress conditions.Front Genet. 2024 Nov 7;15:1498380. doi: 10.3389/fgene.2024.1498380. eCollection 2024. Front Genet. 2024. PMID: 39574795 Free PMC article.
References
-
- Holling CS. Resilience and Stability of Ecological Systems. In: Robin L, Sörlin S, Warde P, editors. Doc Glob Chang New Haven: Yale University Press; 1973. p. 245–60
-
- Folke, C. Resilience (Republished). Ecol Soc. 2016;21(4). http://www.jstor.org/stable/26269991
Publication types
MeSH terms
Grants and funding
LinkOut - more resources
Full Text Sources
Research Materials
