. 2024 Jul 1;15(7):530-546.
doi: 10.1093/procel/pwae012.

Comprehensive transcriptional atlas of human adenomyosis deciphered by the integration of single-cell RNA-sequencing and spatial transcriptomics

Affiliations

Comprehensive transcriptional atlas of human adenomyosis deciphered by the integration of single-cell RNA-sequencing and spatial transcriptomics

Tao Chen et al. Protein Cell. .

Abstract

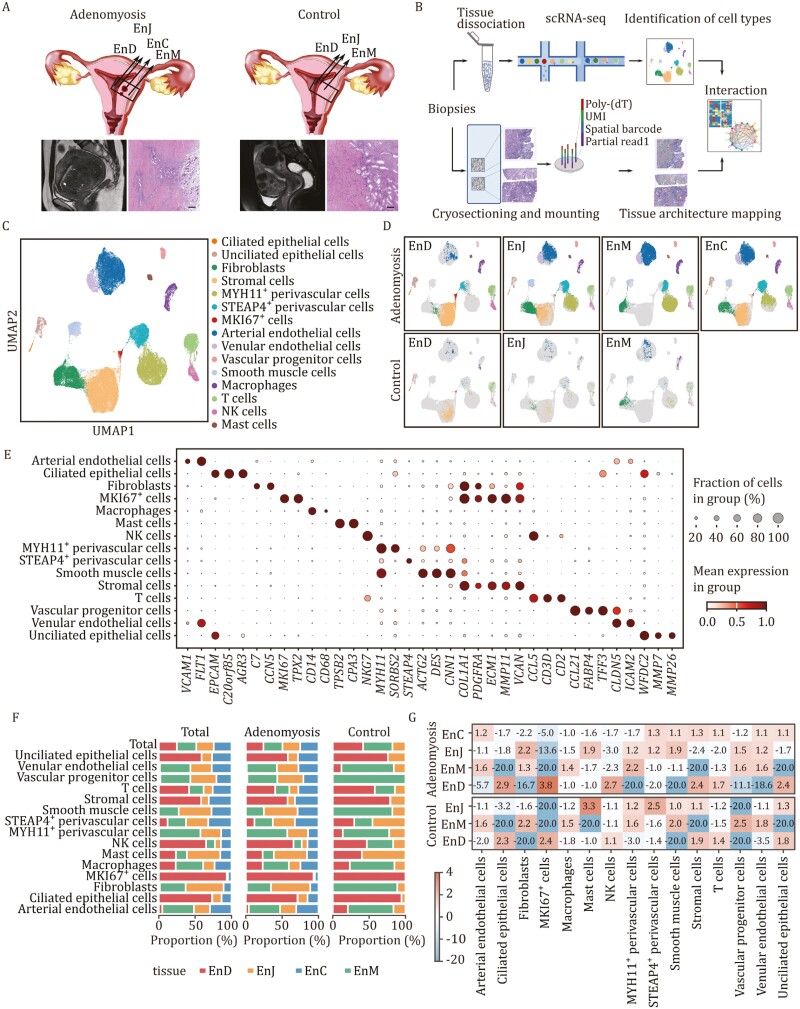
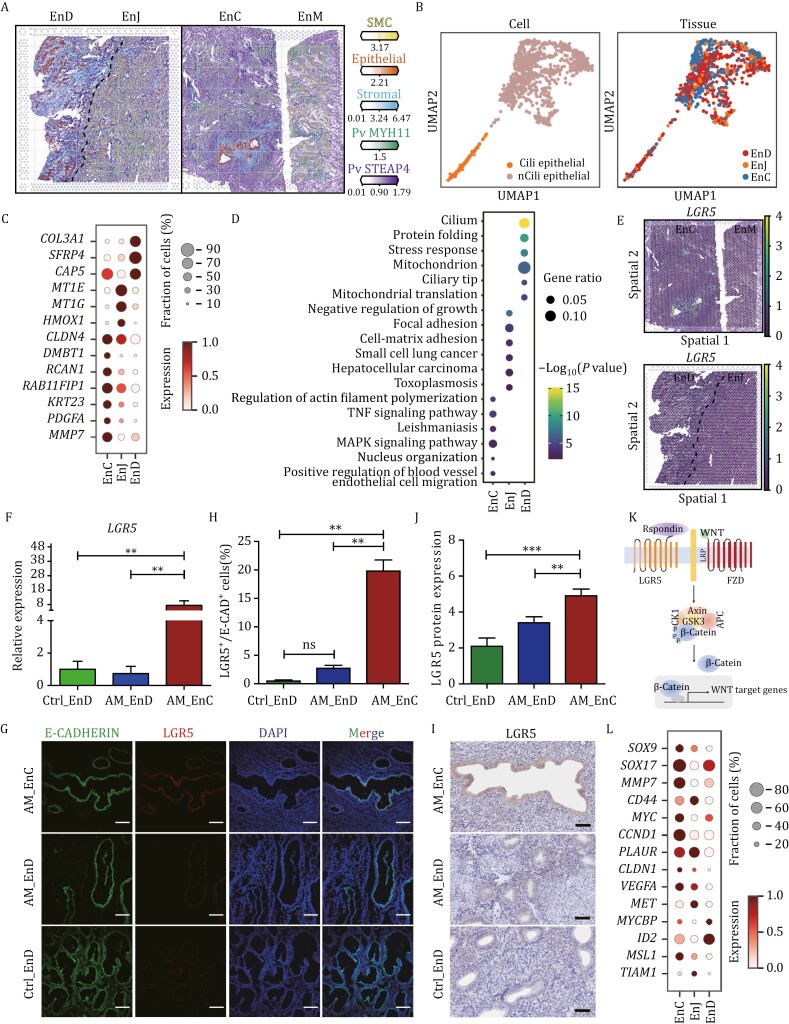
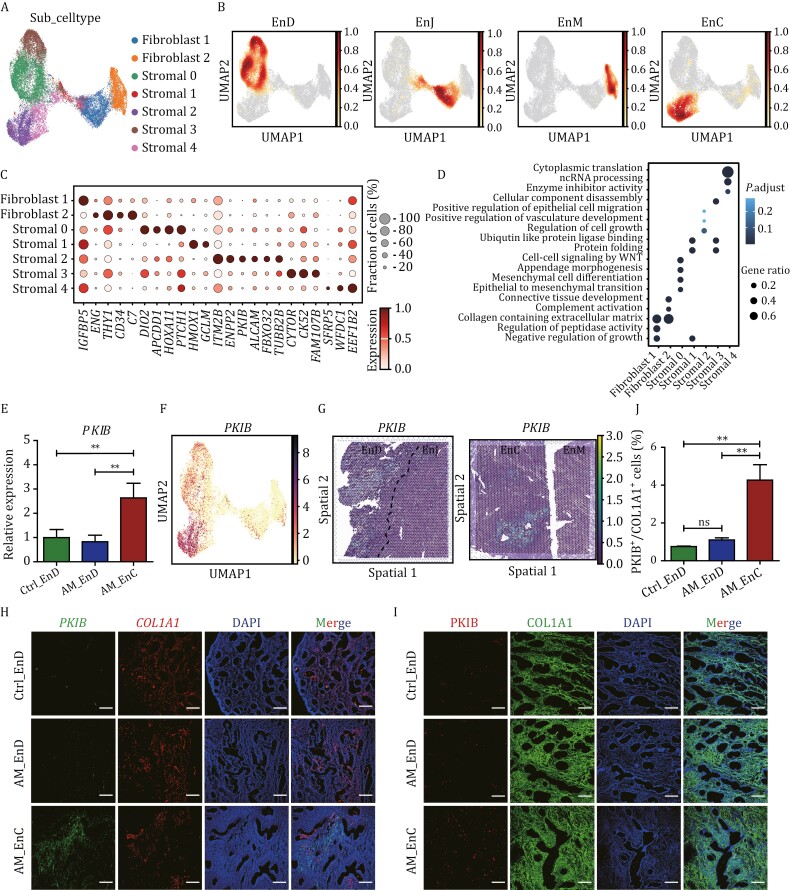
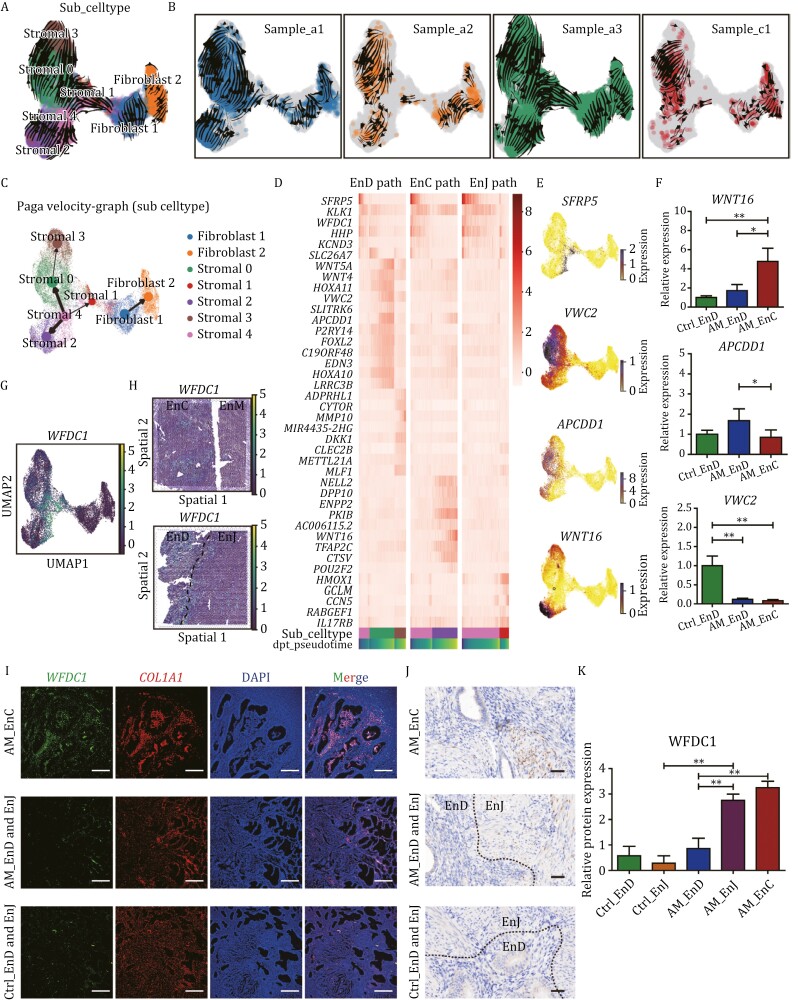
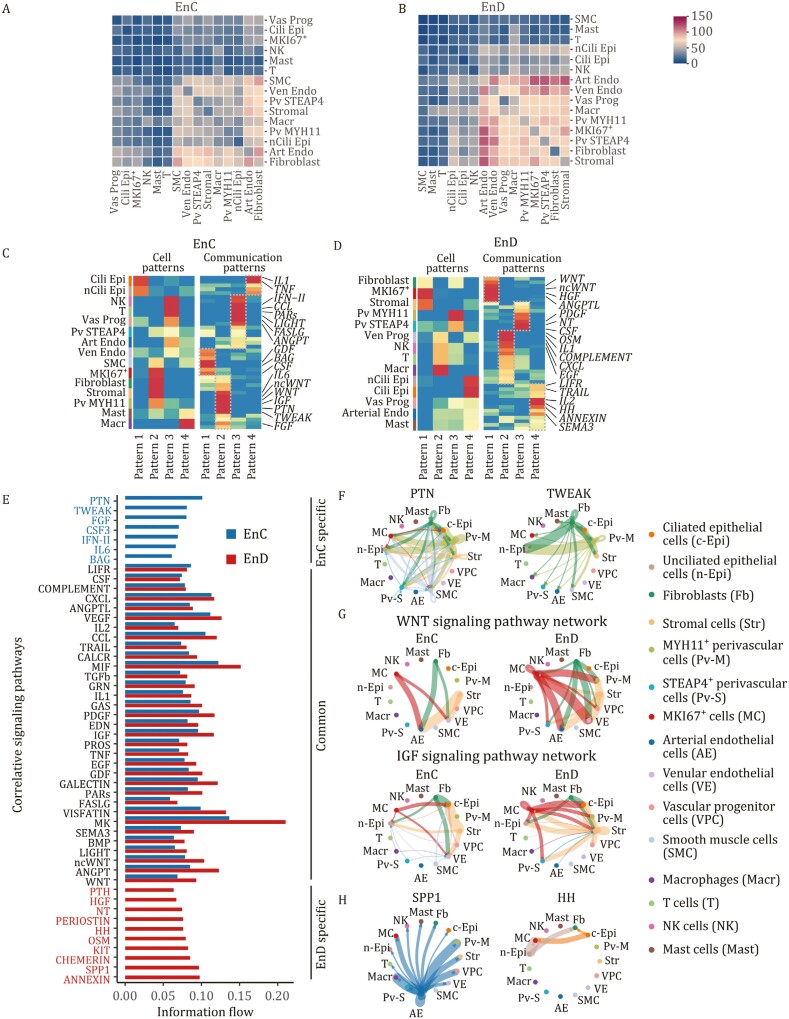
Adenomyosis is a poorly understood gynecological disorder lacking effective treatments. Controversy persists regarding "invagination" and "metaplasia" theories. The endometrial-myometrial junction (EMJ) connects the endometrium and myometrium and is important for diagnosing and classifying adenomyosis, but its in-depth study is just beginning. Using single-cell RNA sequencing and spatial profiling, we mapped transcriptional alterations across eutopic endometrium, lesions, and EMJ. Within lesions, we identified unique epithelial (LGR5+) and invasive stromal (PKIB+) subpopulations, along with WFDC1+ progenitor cells, supporting a complex interplay between "invagination" and "metaplasia" theories of pathogenesis. Further, we observed endothelial cell heterogeneity and abnormal angiogenic signaling involving vascular endothelial growth factor and angiopoietin pathways. Cell-cell communication differed markedly between ectopic and eutopic endometrium, with aberrant signaling in lesions involving pleiotrophin, TWEAK, and WNT cascades. This study reveals unique stem cell-like and invasive cell subpopulations within adenomyosis lesions identified, dysfunctional signaling, and EMJ abnormalities critical to developing precise diagnostic and therapeutic strategies.

Keywords: adenomyosis; endometrial-myometrial junction; progenitor cells; single-cell RNA sequencing; spatial transcriptomics.


Conflict of interest statement

The author declares no competing interests.

Figures

Figure 1.
Figure 1.
Characterization of the cell types in various regions of adenomyosis and control samples. (A) Summary of the sample origins. Schematic diagram of collected tissue biopsy samples including endometrium (EnD), endometrium–myometrial interface (EnJ), ectopic lesions (EnC), and myometrium (EnM) (top). The location of the sampling locations is based on MRI and hematoxylin and eosin staining (bottom). Uterine fibroids as controls. Scale bar: 400 μm. (B) Summary of the analysis workflow. The experimental design involved mincing the specimens, enzymatically digesting them into single-cell suspension, constructing a library, and conducting single-cell transcriptome sequencing, including 15 specimens from 4 patients (3 with adenomyosis and 1 with uterine fibroids). Additionally, a subset of the specimens underwent spatial transcriptome analysis (1 with adenomyosis). (C) The distribution of 15 main cell-type clusters in a total of 15 samples by UMAP plots. Fifteen cell types were identified with typical cell markers and visualized by UMAP plots. They included ciliated epithelial cells (EPCAM+ and AGR3+), unciliated epithelial cells (EPCAM+ and WFDC2+), stromal cells (VCAN+ and ECM1+), fibroblasts (COL1A1+), venular endothelial cells (CLDN5+), arterial endothelial cells (FLT1+), vascular progenitor cells (CCL21+ and TFF3+), smooth muscle cells (CNN1+ and DES+), MYH11+ and STEAP4 + perivascular cells (MYH11+ and STEAP4+, respectively), NK cells (NKG7+ and CCL5+), mast cells (TPSB2+ and CPA3+), macrophages (CD14+), T cells (CD2+), and MKI67+ cells (MKI67+ and TPX2+). (D) The distribution of 15 main cell type clusters in different uterine regions of adenomyosis and Ctrl samples. (E) Expression of typical marker genes of each cell type. (F) The proportion of each cell type in different uterine regions of adenomyosis and Ctrl samples by stacked bar chart. (G) Fold enrichment of each cell type in different uterine regions of adenomyosis and Ctrl samples.
Figure 2.
Figure 2.
Characterization of epithelial cells in adenomyosis. (A) The overall landscape of adenomyosis was exhibited using spatial transcriptomic incorporating scRNA-seq data. Number of mRNA molecules per spot (color intensity) confidently assigned to SMCs, epithelial, stromal cells, Pv MYH11, and Pv STEAP4 in different uterine regions of adenomyosis. (B) The distribution of ciliated and unciliated epithelial cells in EnD, EnJ, and EnC in all 15 samples by UMAP. (C) The expression of differential gene expressions (DEGs) of epithelial cells in EnD, EnJ, and EnC. (D) Gene Ontology (GO) enrichment analysis of the top 100 DEGs in EnD, EnJ, and EnC. (E) Visualization of LGR5+ cells in adenomyosis samples by spatial transcriptomics. (F) mRNA expression levels of LGR5 in epithelial cells in Ctrl_EnD, AM_EnD, and AM_EnC examined by qRT-PCR (n = 5 per group). Data are presented as the mean ± SEM, *P < 0.05, **P < 0.01. (G) Immunofluorescence (IF) staining for the expression of LGR5 and the epithelial marker E-CADHERIN in AM_EnC, AM_EnD, and Ctrl_EnD. Nuclei are stained with DAPI. Scale bar: 100 μm. (H) Statistical graph of the percentage of LGR5+ to E-CADHERIN+ cells in H (n = 3 per group). Data are presented as the mean ± SEM, *P < 0.05, **P < 0.01; ns: no significance. (I) Immunohistochemistry (IHC) staining for the expression of LGR5 in epithelial cells. Scale bar: 200 μm. (J) Protein expression of LGR5 was examined in epithelial cells in Ctrl_EnD, AM_EnD, and AM_EnC by semi-quantitative detection of immunohistochemistry (n = 10 per group). Data are presented as the mean ± SEM, **P < 0.01. ***P < 0.001. (K) Schematic diagram of the LGR5/WNT signaling pathway. (L) The expression of DEGs for WNT signaling pathway of epithelial cells in EnD, EnJ, and EnC.
Figure 3.
Figure 3.
Characterization of stromal cells subpopulations in adenomyosis. (A) Stromal cells were extracted and further re-clustered and finally seven subclusters were obtained: fibroblast 1, fibroblast 2, stromal 0, stromal 1, stromal 2, stromal 3, and stromal 4. (B) The distribution of the stromal subclusters in different uterine regions of adenomyosis by UMAP plot. (C) Expression of typical marker genes of each stromal subclusters. (D) GO enrichment analysis of the top 100 DEGs in stromal subclusters. (E) mRNA expression levels of PKIB for stromal 2 markers in Ctrl_EnD, AM_EnD and AM_EnC examined by qRT-PCR (n = 6 per group). Data are presented as the mean ± SEM, *P < 0.05, **P < 0.01. (F) The expression pattern of PKIB in stromal 2 subclusters by UMAP plot. (G) Visualization of PKIB + cells in adenomyosis samples using spatial transcriptomics. (H) Fluorescence in situ hybridization (FISH) staining for the expression of the stromal 2 marker PKIB and stromal fibroblast marker COL1A1. Nuclei are stained with DAPI. Scale bar: 200 μm. (I) Immunofluorescence (IF) staining for the expression of the stromal 2 marker PKIB and stromal fibroblast marker COL1A1. Nuclei are stained with DAPI. Scale bar: 200 μm. (J) Statistical graph of the percentage of PKIB+ cells in COL1A1+ cells (n = 4 per group). Data are presented as the mean ± SEM, *P < 0.05, **P < 0.01; ns: no significance.
Figure 4.
Figure 4.
Differentiation trajectories of stromal cells in adenomyosis. (A) RNA velocity trajectory for all stromal subclusters shown by UMAP. (B) RNA velocity trajectory for the stromal subclusters of each patient sample. (C) Pseudo-time analysis of all stromal subclusters showing three trajectory fates. (D) Expression heatmap showing DEGs among three transition states, including the endometrium path (EnD path), the ectopic lesions path (EnC path) and the endometrium-myometrial junction path (EnJ path). (E) Expressions level of SFRP5, VWC2, APCDD1, and WNT16 in the stromal subclusters. (F) mRNA expression levels of WNT16, APCDD1, and VWC2 for stromal cells in Ctrl-EnD, AM-EnD, and AM-EnC examined by qRT-PCR (n = 6 per group). Data are presented as the mean ± SEM, *P < 0.05, **P < 0.01. (G) The expression pattern of WFDC1 in stromal 4 subcluster by UMAP plot. (H) Visualization of WFDC1+ cells in adenomyosis samples by spatial transcriptomics. (I) FISH staining for the expression of WFDC1 and COL1A1. Nuclei are stained with DAPI (blue). Scale bar: 200 μm. (J) Immunohistochemistry (IHC) staining for the expression of WFDC1 in stromal cells. Scale bar: 200 μm. (K) Protein expression of WFDC1 was examined in Ctrl_EnD and Ctrl_EnJ, AM_EnD, AM_EnC, and AM_EnJ by semi-quantitative detection of immunohistochemistry (n = 4 per group). Data are presented as the mean ± SEM, **P < 0.01.
Figure 5.
Figure 5.
Characterization of EC in adenomyosis. (A) EC were extracted and further re-clustered and finally seven subclusters were obtained: lymphatic EC (LEC), high endothelial venule (EC-HEV), capillary (EC-capillary), post-capillary venous (EC-PCV), activated PCV (EC-aPCV), EC-tip and arterial (EC-artery). (B) The distribution of the endothelial subclusters in different uterine regions of adenomyosis and control samples by UMAP plot. (C) Expression of typical marker genes of each endothelial subclusters. (D) The expression of upregulated immune-related and chemokines genes in different uterine regions of adenomyosis by heatmap. (E) The expression of upregulated angiogenesis-associated genes in different uterine regions of adenomyosis by heatmap. (F) The expression signaling patterns of VEGF in various cell types by Dot plot. (G) The expression of significant DEGs of EC-tip endothelial cell subsets in EnC and EnD of adenomyosis. (H) Ligand-receptor pairs network of ANGPTL signaling pathways for intercellular communication in EnC and EnD.
Figure 6.
Figure 6.
Cell-to-cell crosstalk in EnD and EnC of adenomyosis. (A) The number of connections between different cell types in EnC of adenomyosis by CellphoneDB: vascular progenitor cells (Vas Prog), ciliated epithelial cells (Cili Epi), MKI67+ cells (MKI67+), NK cells (NK), mast cells (Mast), T cells (T), smooth muscle cells (SMC), venular EC (Ven Endo), STEAP4+ perivascular cells (Pv STEAP4), stromal cells (stromal), macrophages (Macr), MYH11+ perivascular cells (Pv MYH11), unciliated epithelial cells (nCili Epi), arterial EC (Art Endo), fibroblasts (fibroblast). (B) The number of connections between different cell types in EnD of adenomyosis by CellphoneDB. (C) Heatmap of signal patterns of different cell types in EnC of adenomyosis shown by CellChat. (D) Heatmap of signal patterns of different cell types in EnD of adenomyosis shown by CellChat. (E) Bar graph shows the correlation of signaling pathway in EnC and EnD. (F) Circle plot showing the inferred PTN and TWEAK signaling networks between different cell types in EnC. (G) Circle plot showing the inferred WNT and IGF signaling networks between different cell types in both EnC and EnD. (H) Circle plot showing the inferred SPP1 and HH signaling networks between different cell types in EnD.

References

    1. Altmäe S, Koel M, Võsa U. et al.. Meta-signature of human endometrial receptivity: a meta-analysis and validation study of transcriptomic biomarkers. Sci Rep 2017;7:10077. - PMC - PubMed
    1. Athanasiadis EI, Botthof JG, Andres H. et al.. Single-cell RNA-sequencing uncovers transcriptional states and fate decisions in haematopoiesis. Nat Commun 2017;8:2045. - PMC - PubMed
    1. Barker N, van Es JH, Kuipers J. et al.. Identification of stem cells in small intestine and colon by marker gene Lgr5. Nature 2007;449:1003–1007. - PubMed
    1. Benagiano G, Brosens I.. History of adenomyosis. Best Pract Res Clin Obstet Gynaecol 2006;20:449–463. - PubMed
    1. Blache P, van de Wetering M, Duluc I. et al.. SOX9 is an intestine crypt transcription factor, is regulated by the Wnt pathway, and represses the CDX2 and MUC2 genes. J Cell Biol 2004;166:37–47. - PMC - PubMed