. 2024 Mar 12;6(1):lqae027.
doi: 10.1093/nargab/lqae027. eCollection 2024 Mar.

PyF2F: a robust and simplified fluorophore-to-fluorophore distance measurement tool for Protein interactions from Imaging Complexes after Translocation experiments

Affiliations

PyF2F: a robust and simplified fluorophore-to-fluorophore distance measurement tool for Protein interactions from Imaging Complexes after Translocation experiments

Altair C Hernandez et al. NAR Genom Bioinform. .

Abstract

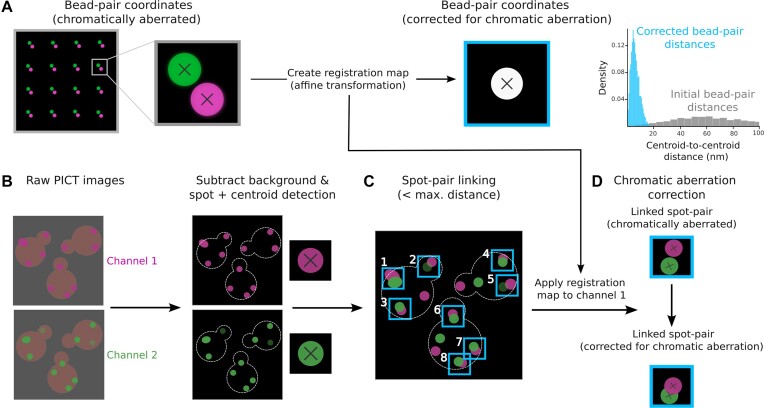
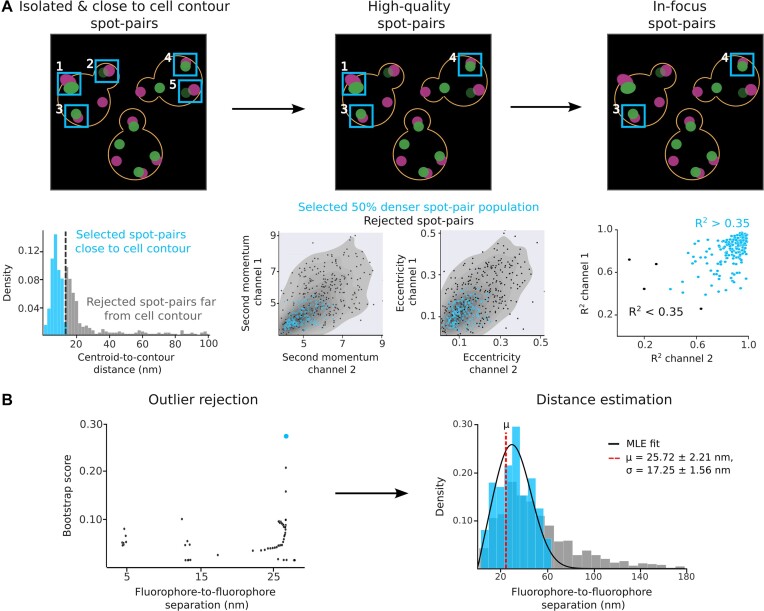
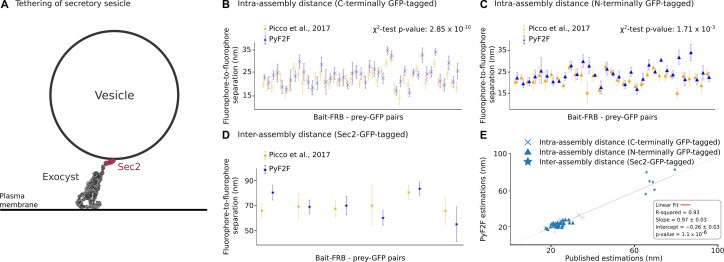
Structural knowledge of protein assemblies in their physiological environment is paramount to understand cellular functions at the molecular level. Protein interactions from Imaging Complexes after Translocation (PICT) is a live-cell imaging technique for the structural characterization of macromolecular assemblies in living cells. PICT relies on the measurement of the separation between labelled molecules using fluorescence microscopy and cell engineering. Unfortunately, the required computational tools to extract molecular distances involve a variety of sophisticated software programs that challenge reproducibility and limit their implementation to highly specialized researchers. Here we introduce PyF2F, a Python-based software that provides a workflow for measuring molecular distances from PICT data, with minimal user programming expertise. We used a published dataset to validate PyF2F's performance.


Figures

Figure 1.
Figure 1.
Scheme of image registration, image pre-processing, spot detection, spot–pair linking and chromatic aberration correction. (A) Image registration: a dataset of two-channel images of TetraSpeck beads (red fluorescence, channel 1-magenta; green fluorescence, channel 2-green) (left). The zoom-in illustrates the centroid coordinates of representative fluorescent beads (black cross) for each channel before (centre) and after (right) being aligned using an affine transformation. This allows creation of the registration map. As a control, the centroid-to-centroid Euclidean distances between two-channel bead coordinates are measured before (grey) and after (light-blue) the chromatic aberration correction (right). (B) Image pre-processing: two-channel images obtained in a PICT experiment are firstly pre-processed to remove the extracellular and cytoplasmic background fluorescence signal (left). Spot detection: the centroid coordinates of the fluorescent spots corresponding to the labelled anchor–RFP–FKBP (magenta) and prey (green) are localized (represented with a black cross in the zoom-in; centre). (C) Spot–pair linking: the most proximal spots detected in channel 1 and channel 2 and that are found within a maximum separation distance defined by the user are linked into ‘spot pairs’ (i.e. pairs of spots with ID 1–8, light-blue). (D) Chromatic aberration correction: finally, the centroid coordinates of detected spots in channel 1 are corrected for chromatic aberration using the registration map computed with the bead images (right).
Figure 2.
Figure 2.
Scheme of spot–pair selection, outlier rejection and distance estimation for the reference dataset. (A) Spot–pair selection: the contour of the cell is approximated using the CNN weights of YeastSpotter (15). Isolated spot pairs are selected according to their separation from the closest neighbouring spot and the distance-to-cell contour (i.e. spot pairs with ID 1–5, light-blue, left). Only spot pairs with similar brightness (second momentum) and roundness (eccentricity) are selected (i.e. spot pairs with ID 1, 3 and 4, light-blue, centre). Lastly, only spot pairs whose intensity distribution in the x- and y-axis fits a Gaussian function are selected (i.e. spot pairs with ID 3 and 4, light-blue, right). (B) Outlier rejection and distance estimation: outliers are rejected using a bootstrap method (left, see Supplementary Notes S1 and S2) to determine the distance distribution without outliers that maximizes the likelihood for the estimated μ and σ (light-blue dot). The distance distribution is modelled by a Rician distribution (4,5) with an MLE to estimate the μ (red dashed line) and σ of the distribution (right). A representative PICT dataset of cells expressing anchor–RFP–FKBP, Exo70–FRB and C-terminally tagged Sec5–GFP was analysed to illustrate the main steps followed by PyF2F. Light-blue indicates selected spot pairs (A) and distance distribution without outliers (B).
Figure 3.
Figure 3.
PyF2F validation. Validation of the PyF2F performance on a PICT reference dataset by comparing published distance estimations (orange, (12)) with the estimations obtained with PyF2F (blue) (see Supplementary Table S2). (A) The scheme illustrates a 2D section of the tethering of a secretory vesicle mediated by the interaction between the exocyst (grey, representation based on PDB 5YFP) (12) and Sec2 (red, cartoon representation using Biorender.com). (B) A total of 45 estimated distances between the anchor–RFP–FKBP and exocyst subunits tagged to GFP at their C-terminus. (C) A total of 33 estimated distances between the anchor–RFP–FKBP and exocyst subunits tagged to GFP at their N-terminus. (B, C) The difference between the set of distance estimations obtained by each approach was evaluated with a χ2 test. (D) Six distances between the anchor–RFP–FKBP and the GFP fused to the Sec2 C-terminus (inter-assembly distances). (E) The correlation between the published and the PyF2F distance estimations was evaluated with a linear fitting (R2 = 0.93; slope = 0.97 ± 0.03; intercept = −0.26 ± 0.03; P-value = 1.1 × 10−6).

References

    1. Mortensen K.I., Sung J., Flyvbjerg H., Spudich J.A. Optimized measurements of separations and angles between intra-molecular fluorescent markers. Nat. Commun. 2015; 6:8621. - PMC - PubMed
    1. Thompson R.E., Larson D.R., Webb W.W. Precise nanometer localization analysis for individual fluorescent probes. Biophys. J. 2002; 82:2775–2783. - PMC - PubMed
    1. Yildiz A., Selvin P.R. Fluorescence imaging with one nanometer accuracy: application to molecular motors. Acc. Chem. Res. 2005; 38:574–582. - PubMed
    1. Churchman L.S., Ökten Z., Rock R.S., Dawson J.F., Spudich J.A. Single molecule high-resolution colocalization of Cy3 and Cy5 attached to macromolecules measures intramolecular distances through time. Proc. Natl Acad. Sci. USA. 2005; 102:1419–1423. - PMC - PubMed
    1. Churchman L.S., Flyvbjerg H., Spudich J.A. A non-Gaussian distribution quantifies distances measured with fluorescence localization techniques. Biophys. J. 2006; 90:668–671. - PMC - PubMed