. 2023 Nov 6:3:e21.
doi: 10.1017/S2633903X23000211. eCollection 2023.

FLUTE: A Python GUI for interactive phasor analysis of FLIM data

Affiliations

FLUTE: A Python GUI for interactive phasor analysis of FLIM data

Dale Gottlieb et al. Biol Imaging. .

Abstract

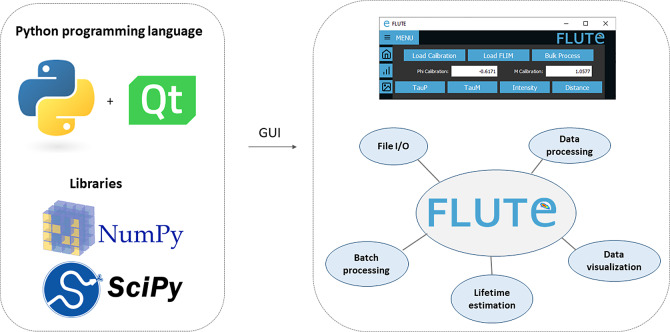
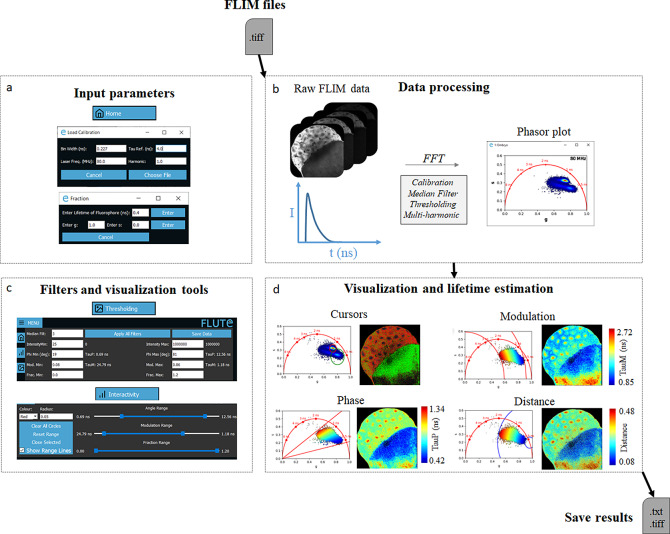
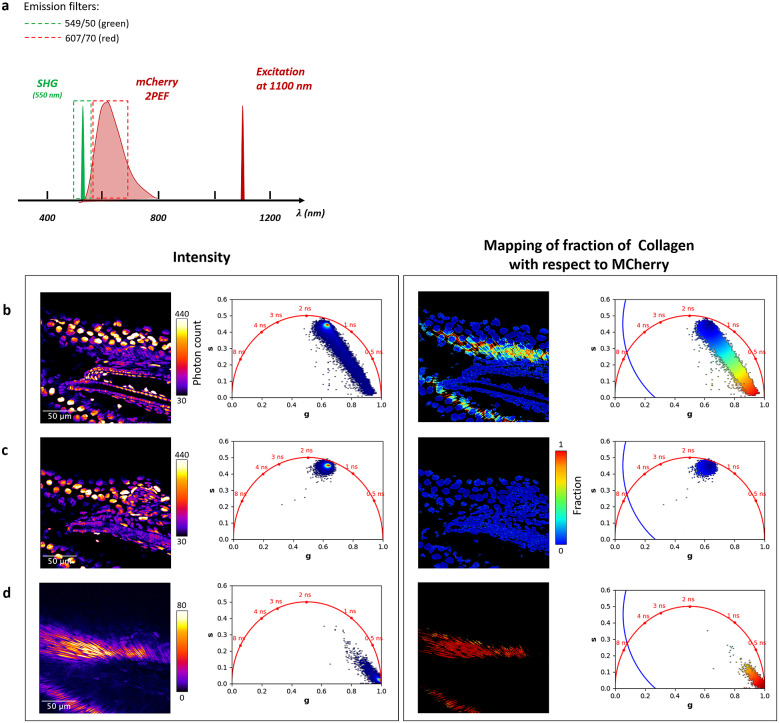
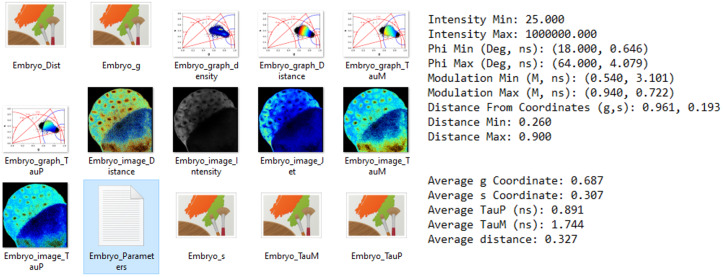
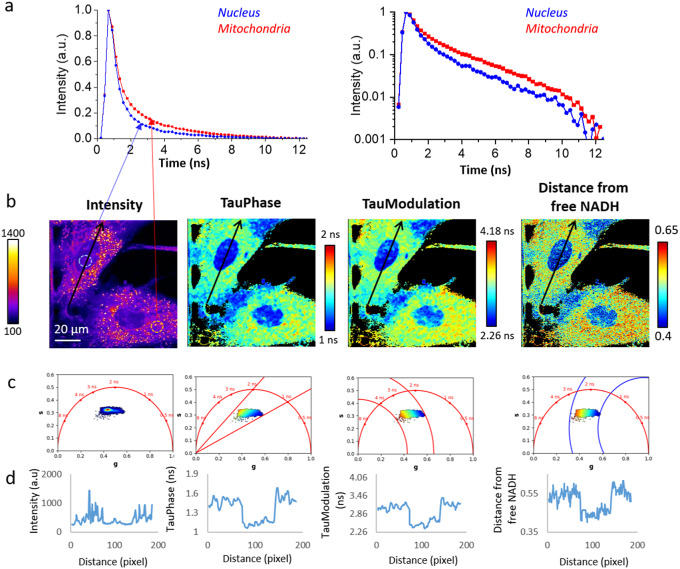
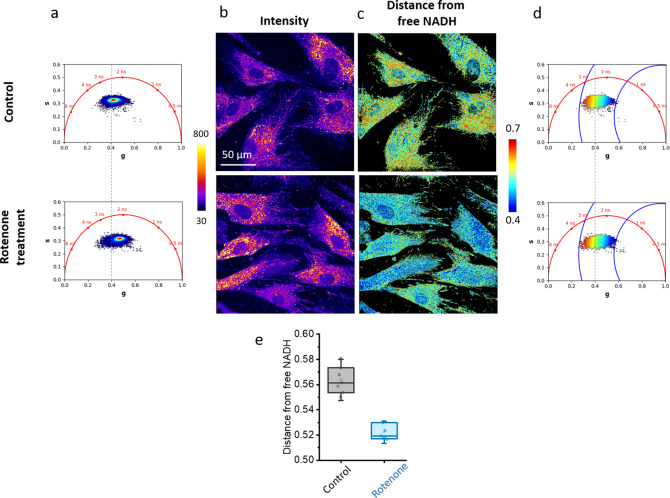
Fluorescence lifetime imaging microscopy (FLIM) is a powerful technique used to probe the local environment of fluorophores. The fit-free phasor approach to FLIM data is increasingly being used due to its ease of interpretation. To date, no open-source graphical user interface (GUI) for phasor analysis of FLIM data is available in Python, thus limiting the widespread use of phasor analysis in biomedical research. Here, we present Fluorescence Lifetime Ultimate Explorer (FLUTE), a Python GUI that is designed to fill this gap. FLUTE simplifies and automates many aspects of the analysis of FLIM data acquired in the time domain, such as calibrating the FLIM data, performing interactive exploration of the phasor plot, displaying phasor plots and FLIM images with different lifetime contrasts simultaneously, and calculating the distance from known molecular species. After applying desired filters and thresholds, the final edited datasets can be exported for further user-specific analysis. FLUTE has been tested using several FLIM datasets including autofluorescence of zebrafish embryos and in vitro cells. In summary, our user-friendly GUI extends the advantages of phasor plotting by making the data visualization and analysis easy and interactive, allows for analysis of large FLIM datasets, and accelerates FLIM analysis for non-specialized labs.

Keywords: Data visualization; FLIM; Python; fluorescence lifetime microscopy; phasor analysis.


Conflict of interest statement

The authors declare no competing interests exist.

Figures

Figure 1.
Figure 1.
Fluorescence Lifetime Ultimate Explorer (FLUTE) architecture. FLUTE is programmed in Python using PyQt5, NumPy, and SciPy libraries. The graphical user interface is designed to be intuitive and to efficiently perform different functionalities, including data import and export, data processing, data visualization, lifetime estimation, and batch processing. All these functionalities are integrated into a single minimalistic software.
Figure 2.
Figure 2.
Fluorescence Lifetime Ultimate Explorer (FLUTE) interface for data processing and visualization. FLUTE architecture is purposefully designed and optimized for user-friendly and efficient fluorescence lifetime imaging microscopy (FLIM) data processing and visualization. (a) Window of FLUTE interface that allows choosing input parameters to calibrate and calculate the distance from known molecular species. (b) Data processing enables the import of raw FLIM data in .tiff format, performs phasor transformation with a fast Fourier transform at different harmonics of the laser repetition frequency, and applies reversible median filter and intensity thresholding. (c,d) FLUTE offers a range of tools for interactive, straightforward, and reproducible data visualization and lifetime estimation such as cluster analysis with cursors of adjustable size and applying various colormaps (distance from molecular species and lifetime contrast TauP and TauM) interactively using range sliders or thresholding entry boxes. These FLIM data were calibrated with fluorescein (4 ns) acquired in solution: Fluorescein_Embryo.tiff.
Figure 3.
Figure 3.
Mapping of distance from mCherry in a 5 days post-fertilization zebrafish embryo tail (H2B-mCherry line). (a) Excitation and emission scheme of the experiment. Two-photon excitation of mCherry and second-harmonic generation (SHG) of collagen is performed at 1,100-nm wavelength. Images are acquired without emission filter to collect both mCherry from the cell nuclei and SHG from collagen (b), with an emission filter of 607/70 nm to collect only mCherry fluorescence (c) and with an emission filter of 549/50 nm to collect only the SHG signal from collagen. (b–d) Intensity images and distance from mCherry with their corresponding phasor plots are displayed for the images with mCherry and collagen (b), mCherry only (c), and collagen only (d). These fluorescence lifetime imaging microscopy images were calibrated with the SHG signal (0 ns) acquired from a starch sample: starch SHG-IRF.tif. The distance formula image from mCherry is calculated with Fluorescence Lifetime Ultimate Explorer using equation (15) from the mCherry phasor location (g = 0.634 and s = 0.45) estimated from the average phasor plot of (c).
Figure 4.
Figure 4.
Fluorescence Lifetime Ultimate Explorer result export. Saved fluorescence lifetime imaging microscopy images and phasor plots (left) and applied filters (right) to create the mask and measurements of the average of g, s, TauP, TauM, and distance (right).
Figure 5.
Figure 5.
Fluorescence lifetime imaging microscopy (FLIM) analysis of NADH reveals intracellular metabolic heterogeneity in mesenchymal stromal cells. (a) Multi-exponential fluorescence intensity decays of the intrinsic biomarker NADH in the nucleus and in the mitochondria of mesenchymal stromal cells. Linear scale (left) and logarithmic scale (right). (b,c) Cellular maps (b) and corresponding phasor plots (c) are displayed with different contrasts: intensity, TauP lifetime, TauM lifetime, and distance from free NADH after applying an intensity threshold of 200 and 3 median filters. This FLIM image was calibrated with fluorescein (4 ns) acquired in solution: Fluorescein_hMSC.tif. (d) Profiles of the respective contrast along the black line drown in (b).
Figure 6.
Figure 6.
Shift in the distance from free NADH in live cells upon metabolic treatment. (a,b) Phasor plot (a) and the corresponding intensity images (b) of hMSCs with different treatments: control and rotenone (respiratory chain inhibitor). (b,c) Images (c) and the corresponding phasor plots (d) are mapped with the distance from free NADH contrast after applying an intensity threshold of 100 and 3 median filters. These fluorescence lifetime imaging microscopy images were calibrated with fluorescein (4 ns) acquired in solution: Fluorescein_hMSC.tif. (e) Measurement of the average value of the distance from free NADH in seven ROIs for each condition. T-test is performed (**P < .01).
Figure 7.
Figure 7.
Phasor plot representation. Single-exponential decays fall on the semicircle (red points), while multi-exponential decays are located within the universal circle of the phasor plot (black point). The phasor coordinates g and s are the real and imaginary parts of the fast Fourier transform.
Figure 8.
Figure 8.
Calibration of the phasor plot using a fluorescent standard of fluorescein of 4 ns. (a) Phase correction. (b) Modulation correction.
Figure 9.
Figure 9.
Graphical calculation of the distance from a molecular species. (a) The distance from molecular species B ( formula image ) is defined as the distance of the experimental point (black point) from molecular species B. The fraction formula image of molecular species A is defined as the distance dB normalized by the distance between points A and B. (b) graphical calculation of the distance formula image from free NADH.

Similar articles

Cited by

References

    1. Esposito A & Wouters FS (2004) Fluorescence lifetime imaging microscopy. Current Protocols in Cell Biology Chapter 4, Unit 4.14. 10.1002/0471143030.cb0414s25. - DOI - PubMed
    1. Wallrabe H & Periasamy A (2005) Imaging protein molecules using FRET and FLIM microscopy. Current Opinion in Biotechnology 16(1), 19–27. - PubMed
    1. Becker W (2012) Fluorescence lifetime imaging – techniques and applications. Journal of Microscopy 247(2), 119–136. - PubMed
    1. Suhling K, Hirvonen LM, Levitt JA, Chung PH, Tregidgo C, le Marois A, Rusakov DA, Zheng K, Ameer-Beg S, Poland S, Coelho S, Henderson R & Krstajic N (2015) Fluorescence lifetime imaging (FLIM): Basic concepts and some recent developments. Medical Photonics 27, 3–40.
    1. Datta R, Heaster TM, Sharick JT, Gillette AA & Skala MC (2020) Fluorescence lifetime imaging microscopy: Fundamentals and advances in instrumentation, analysis, and applications. Journal of Biomedical Optics 25(7), 1–43. - PMC - PubMed

LinkOut - more resources