. 2024 Mar 15;134(6):e173676.
doi: 10.1172/JCI173676.

Mast cell activation disrupts interactions between endothelial cells and pericytes during early life allergic asthma

Affiliations

Mast cell activation disrupts interactions between endothelial cells and pericytes during early life allergic asthma

Régis Joulia et al. J Clin Invest. .

Abstract

Allergic asthma generally starts during early life and is linked to substantial tissue remodeling and lung dysfunction. Although angiogenesis is a feature of the disrupted airway, the impact of allergic asthma on the pulmonary microcirculation during early life is unknown. Here, using quantitative imaging in precision-cut lung slices (PCLSs), we report that exposure of neonatal mice to house dust mite (HDM) extract disrupts endothelial cell/pericyte interactions in adventitial areas. Central to the blood vessel structure, the loss of pericyte coverage was driven by mast cell (MC) proteases, such as tryptase, that can induce pericyte retraction and loss of the critical adhesion molecule N-cadherin. Furthermore, spatial transcriptomics of pediatric asthmatic endobronchial biopsies suggests intense vascular stress and remodeling linked with increased expression of MC activation pathways in regions enriched in blood vessels. These data provide previously unappreciated insights into the pathophysiology of allergic asthma with potential long-term vascular defects.

Keywords: Asthma; Inflammation; Mast cells; Pericytes; Vascular biology.


Conflict of interest statement

Conflict of interest: LJE is now an employee of GSK.

Figures

Figure 1
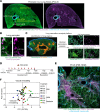
Figure 1. Allergen-induced inflammation leads to vascular remodeling in early life.
(A) 3D rendering of a PCLS section (200 μm thickness) of neonatal lung (P28) stained for CD31 (green, endothelial cells), α-SMA (cyan, SMCs), and PDGFRβ (magenta, pericytes). Yellow box regions indicate adventitial and parenchyma regions analyzed (see Supplemental Video 1). Scale bars: 500 μm. Representative of 4 independent experiments. (B) Zoomed in image of pericytes (PDGFRβ+) extending protrusions around endothelial cells. Scale bars: 7 μm. Representative of 4 independent experiments. (C) Image analysis pipeline showing the results of cell segmentation and volume analysis. Scale bars: 500 μm (left); 30 μm (right). (D) BALB/c mice aged 7 days were exposed to intermittent intranasal PBS or HDM for 3 weeks (red arrows). Lungs were collected at P21, P28, P35, and P42. (E) PCLS section of HDM-exposed neonates (P28) showing the vasculature in an adventitial region. Scale bar: 200 μm (representative of 4 independent experiments). (F) PCA analysis of lung vascular functions (see Supplemental Figure 2, n = 44 mice from 4 independent experiments).
Figure 2
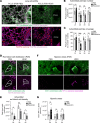
Figure 2. Repeated HDM exposure leads to loss of pericyte protrusions, reduced red blood cells, and hypoxic areas.
Neonate mice were exposed with PBS or HDM as indicated in Figure 1D. (A) 3D rendering of a PCLS section in PBS- and HDM-exposed mice 3 weeks after first inhalation showing CD31 (green, endothelial cells) and PDGFRβ (magenta, pericytes). Lower panels show pericyte cell body (red dots) and protrusion (magenta surface) analyses (see Supplemental Video 2). Scale bars: 30 μm (representative of 4 independent experiments). (B and C) PDGFRβ+ pericyte number per mm3 (B) and coverage (C, normalized to the total volume of CD31+ blood vessel) in the lung adventitia. n = 3–8 mice per group from 4 independent experiments. (D) Representative PCLS showing reduced red blood cell (Ter119+, purple) density in the microcirculation (CD31, green). Scale bars: 50 μm. Representative of 3 independent experiments. (E) Adventitial red blood cell density normalized to the total volume of the image. n = 3–4 mice per group from 3 independent experiments. (F) PCLS of HDM-exposed mice for 3 weeks exhibiting increased HIF-1α (purple) associated to the vasculature (CD31, green). Scale bars: 30 μm. Representative of 4 independent experiments. (G) Number of HIF-1α spots in adventitial region in PBS- and HDM-exposed mice (n = 4 mice per group). Data are represented as means ± SEM. *P < 0.05; **P < 0.01;***P < 0.001, 2-way ANOVA followed by Šidák’s post hoc test.
Figure 3
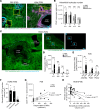
Figure 3. Early life allergen exposure leads to immune-cell recruitment and MC activation in the lung adventitia.
(A) 3D rendering of a PCLS in the lung adventitia in PBS- and HDM-exposed mice at P28 showing CD31 (green, endothelial cells), α-SMA (blue, SMCs), and CD45 (magenta, leukocytes). Scale bars: 200 μm. Representative of 4 independent experiments. (B) CD45+ cell number. n = 3–8 mice per group from 4 independent experiments. (C) Representative 3D image of lung adventitia showing the distribution of CTMCs (avidin, blue) around a large airway and associated vasculature (CD31, green) and images showing degranulated MCs adjacent to large airways and blood vessels (see Supplemental Video 3). Scale bars: 150 μm (left); 50 μm (right). Representative of 4 independent experiments. (D) Number of degranulated MCs. n = 3–6 mice per group. (E and F) Number of extracellular CTMC granules per mm3 (E) and volume (F). n = 3–6 mice per group from 3 independent experiments. (G) Correlation between vascular-associated HIF-1α+ and number of degranulated CTMC granules. n = 23 images from 4 PBS- and 4 HDM-treated mice. (H) Correlation between pericyte coverage and volume of extracellular CTMC granules. n = 39 images from 4 PBS- and 4 HDM-treated mice. Data are represented as means ± SEM. *P < 0.05; **P < 0.01;***P < 0.001, 2-way ANOVA followed by Šidák’s post hoc test (B, D, and E); Spearman’s rank correlation test (G and H).
Figure 4
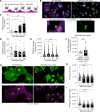
Figure 4. MC granules induce pericyte retraction and cleavage of surface N-cadherin.
MCs were sensitized overnight with anti-DNP IgE then placed on a layer of pericytes (stained with CMTMR) and stimulated with increasing concentrations of DNP-BSA for 24 hours. (A) Schematic depicting the coculture experiment between primary mouse lung MCs and pericytes. (B) Images of unstimulated or stimulated (100 ng/ml DNP-BSA) pericyte/MC cocultures stained for DAPI (yellow), CMTMR (purple), PDGFRβ (blue), and avidin (green, MC granules). White boxes indicate the areas zoomed in showing examples of resting or degranulated MCs. Scale bars: 15 μm. Representative of 3 independent experiments. (C) Frequency of degranulated MCs. n = 6–8 images from 3 independent experiments. (D) Number of pericytes per field of view. n = 15 images from 3 independent experiments. (E) Pericyte volume determined using the cell tracer CMTMR. n = 253–299 pericytes from 3 independent experiments. (F) Avidin signal on small pericytes (<17,000 μm3) and large pericytes (>45,000 μm3) showing that small pericytes exhibit more MC granule staining on their surfaces. n = 18–46 from 3 independent experiments. (G) Representative images of F-actin (green) and N-cadherin (magenta) pericyte expression in the presence of degranulated MCs or control. Scale bars: 50 μm. Representative of 3 independent experiments. (HI) F-actin (H, n = 98–144) and surface N-cadherin (I, n = 98–144) MFI on pericytes. Three independent experiments. Data are represented as means ± SEM. *P < 0.05; **P < 0.01; ***P < 0.001, 1-way ANOVA followed by Tukey’s post hoc test (C, D, E, H, and I); 2-tailed Student’s t test (F).
Figure 5
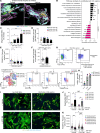
Figure 5. MC-derived proteases induce pericyte retraction and N-cadherin cleavage.
(A and B) Neonate mice were exposed to HDM for 3 weeks. (A) 3D rendering of a PCLS section in the lung adventitia in HDM-exposed mice showing DAPI (blue), m-MCP6 (mouse tryptase, magenta), and MCs (avidin, green); lower panels show zoomed-in images of the white box region and the m-MCP6 signal in extracellular MC granules. Scale bars: 30 μm (upper panel); 10 μm (lower panels). (B) Colocalization analyses between intracellular and extracellular MC granules (avidin+) and m-MCP6 showing frequency of m-MCP6+ granules. Each dot represents an image from 3 independent mice. (CF) MCs were sensitized overnight with anti-DNP IgE, then placed on a layer of pericytes (stained with CMTMR) and stimulated with increasing concentrations of DNP-BSA for 24 hours in the presence of a protease inhibitor cocktail or vehicle control (DMSO). (C) Images of unstimulated or stimulated (100 ng/ml DNP-BSA) pericyte/MC cocultures stained for DAPI (yellow), F-actin (green), and MC granules (avidin, magenta). Scale bars: 50 μm. Representative of 3 independent experiments. (D) Number of degranulated MCs normalized to the total number of MCs. Each dot represents an image from 3 independent experiments. (E) Pericyte volume and (F) cell-surface N-cadherin MFI on pericytes. Each dot represents an individual pericyte from 3 independent experiments. (G) Lung pericyte volume 24 hours following recombinant m-MCP6 exposure. Each dot represents an individual pericyte from 3 independent donors. Data are represented as means ± SEM. *P < 0.05; **P < 0.01; ***P < 0.001, 2-tailed Student’s t test (B); 1-way ANOVA followed by Tukey’s post hoc test (D, E, F, and G).
Figure 6
Figure 6. Transcriptional signature of children with asthma suggests vascular stress, and human MCs induce tryptase-dependent pericyte retraction.
(A) Immunofluorescence images of endobronchial biopsies stained for DNA (Syto83, green), vimentin (purple), CD45 (blue), and α-SMA (yellow) showing the selected ROIs (boxed regions). Scale bars: 100 μm. (B) Pathway enrichment analysis in endothelial cell–rich regions of children with asthma and controls. n = 4–9 ROIs per group from 2 controls and 2 with asthma. P values in Supplemental Table 4. (CF and IK) Human MCs were sensitized overnight with anti-DNP IgE, then placed on pericytes and stimulated with an increasing concentration of DNP-BSA for 24 hours; (IK) APC366 (tryptase inhibitor) or vehicle control was added at the time of stimulation. (C) Degranulated MC number normalized to the total number of MCs. n = 3 MC donors from 3 independent experiments. (D) Pericyte number. n = 3 pericyte donors from 3 independent experiments. (E) Pericyte volume. n = 3 pericyte donors from 3 independent experiments. (F) Avidin signal on small pericytes (<500 μm3) and large pericytes (>9,000 μm3). n = 3 pericyte donors from 3 independent experiments. (G) Flow cytometry profiles of degranulated MCs and unsupervised analysis of extracellular MC granules. t-SNE analysis performed on 3 pooled donors. Representative of 2 independent experiments. (H) Frequency of avidin+ granules positive for indicated markers. n = 3 MC donors from 2 independent experiments. (I) Images of pericyte/MC coculture stained for DAPI (yellow), F-actin (green), and MC granules (avidin, blue). Scale bars: 50 μm. Representative of 3 independent experiments. (J) Degranulated MC numbers normalized to the total number of MCs. n = 5 MC donors from 3 independent experiments. (K) Pericyte volume. n = 6 pericyte donors from 3 independent experiments. Data are represented as means ± SEM. *P < 0.05; **P < 0.01;***P < 0.001, 2-tailed Mann-Whitney test (B); 1-way ANOVA followed by Tukey’s post hoc test (CE); 2-tailed Student’s t test (F); 2-way ANOVA followed by Šidák’s post hoc test (J and K).
Figure 7
Figure 7. Model for the impact of MC activation on lung vasculature.
MC degranulation during early life AAD leads to pericyte damage and associated vascular remodeling in the lung adventitia.

References

    1. Dharmage SC, et al. Epidemiology of asthma in children and adults. Front Pediatr. 2019;7:246. doi: 10.3389/fped.2019.00246. - DOI - PMC - PubMed
    1. Mukherjee M, et al. The epidemiology, healthcare and societal burden and costs of asthma in the UK and its member nations: analyses of standalone and linked national databases. BMC Med. 2016;14(1):113. doi: 10.1186/s12916-016-0657-8. - DOI - PMC - PubMed
    1. Hammad H, Lambrecht BN. The basic immunology of asthma. Cell. 2021;184(9):2521–2522. doi: 10.1016/j.cell.2021.04.019. - DOI - PubMed
    1. Lloyd CM, Saglani S. Opening the window of immune opportunity: treating childhood asthma. Trends Immunol. 2019;40(9):786–798. doi: 10.1016/j.it.2019.07.004. - DOI - PubMed
    1. Augusto LS, et al. Vascular function in asthmatic children and adolescents. Respir Res. 2017;18(1):17. doi: 10.1186/s12931-016-0488-3. - DOI - PMC - PubMed