. 2024 Jan 23;134(6):e165140.
doi: 10.1172/JCI165140.

Disassembly of the TRIM56-ATR complex promotes cytoDNA/cGAS/STING axis-dependent intervertebral disc inflammatory degeneration

Affiliations

Disassembly of the TRIM56-ATR complex promotes cytoDNA/cGAS/STING axis-dependent intervertebral disc inflammatory degeneration

Weifeng Zhang et al. J Clin Invest. .

Abstract

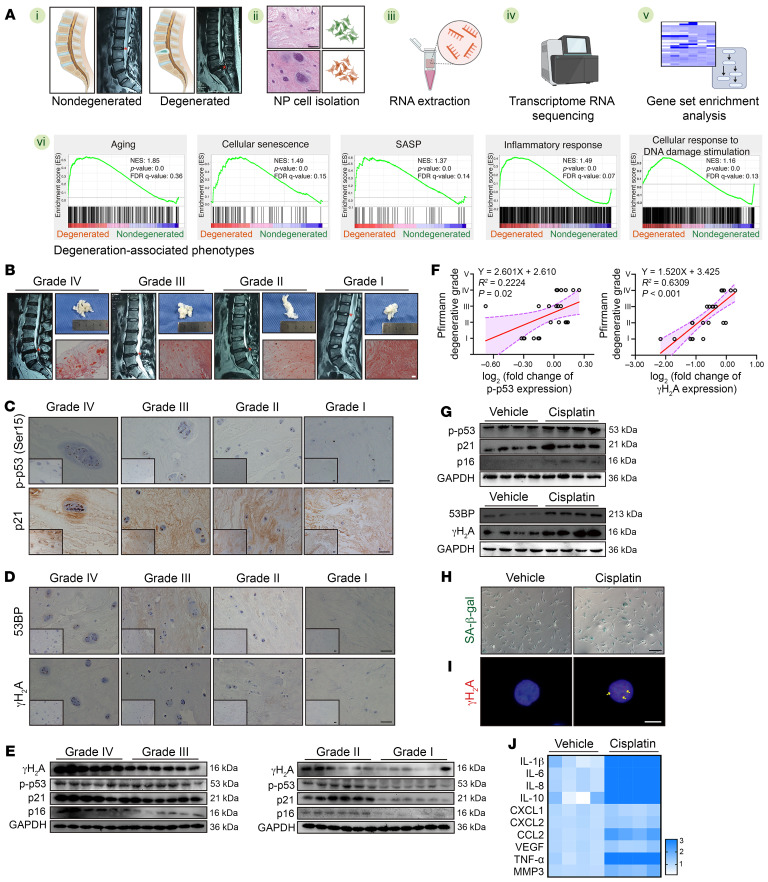
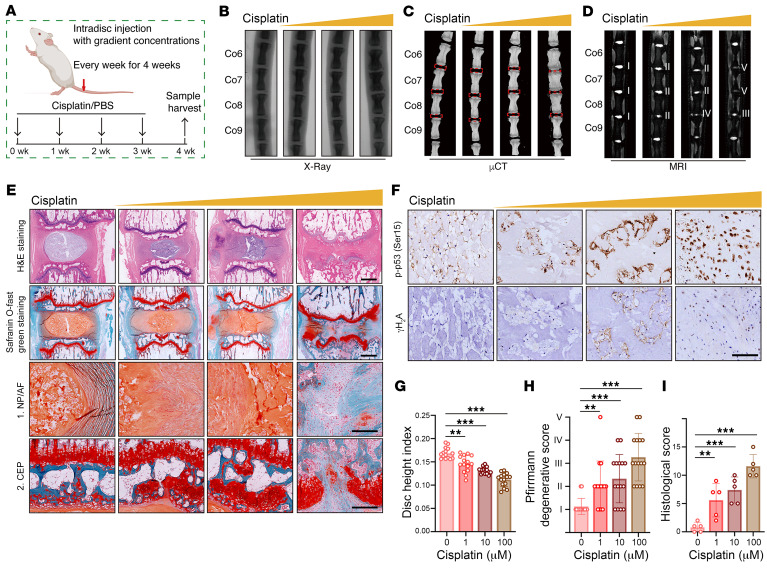
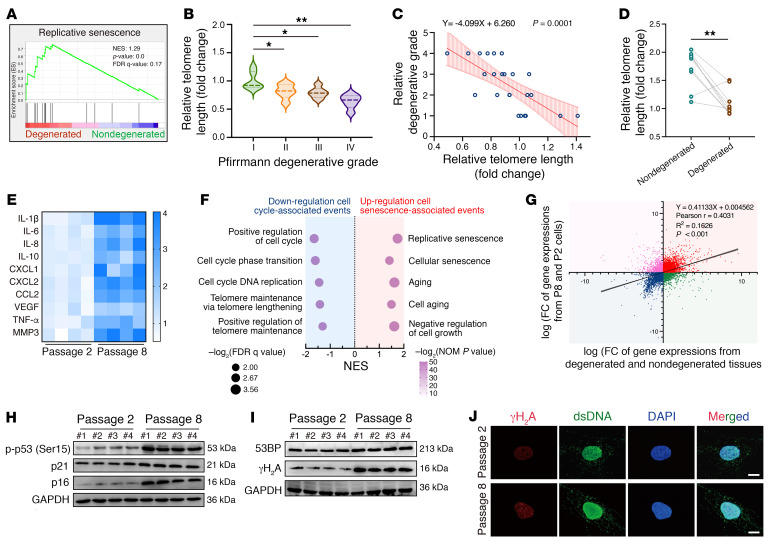
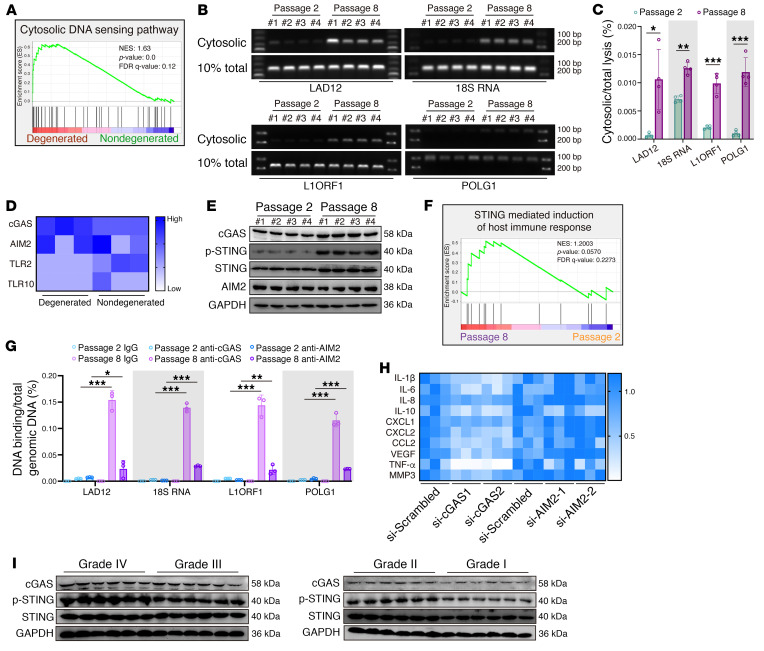
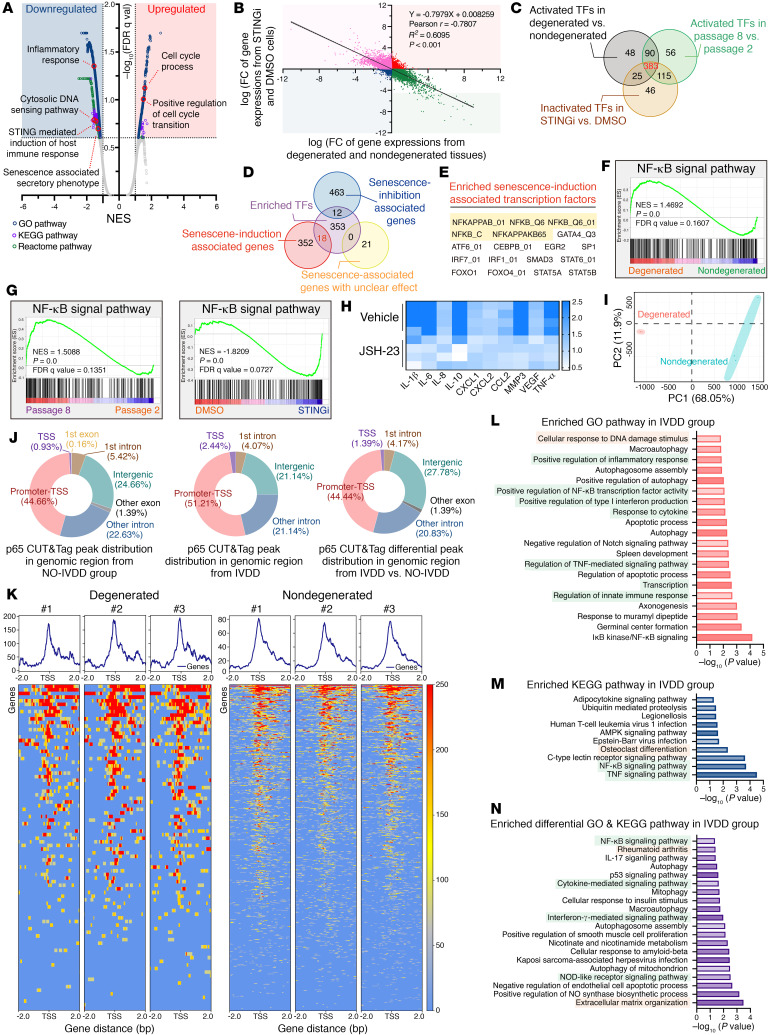
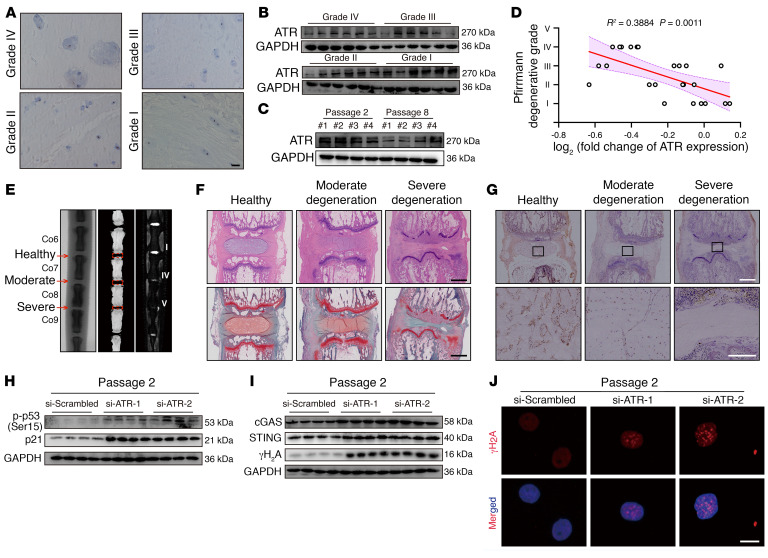
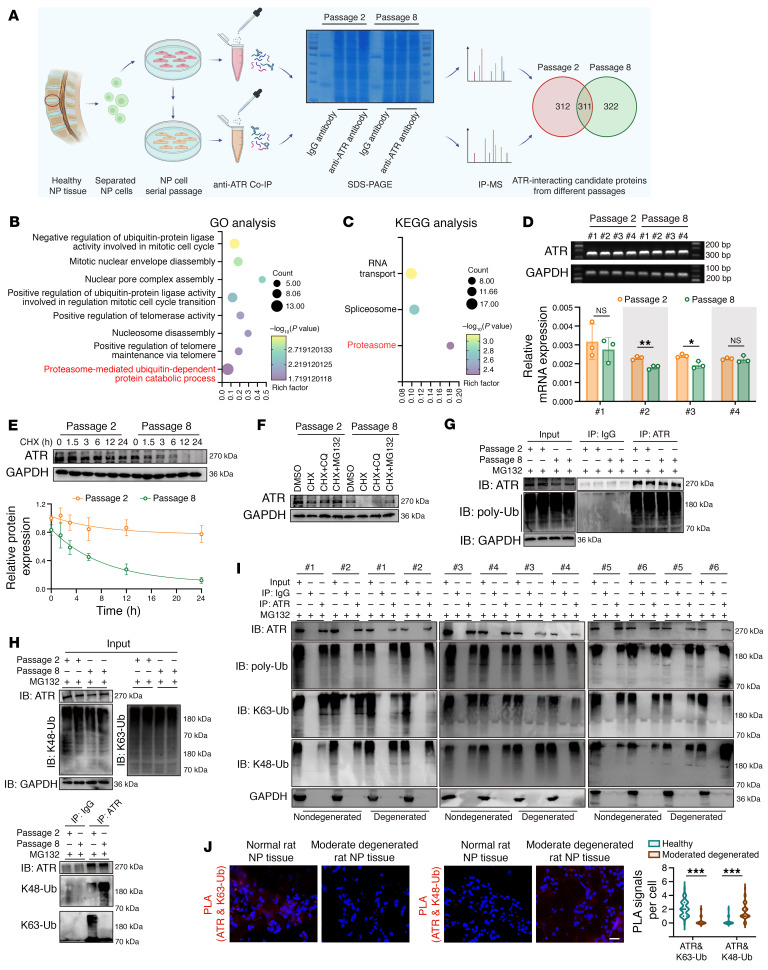
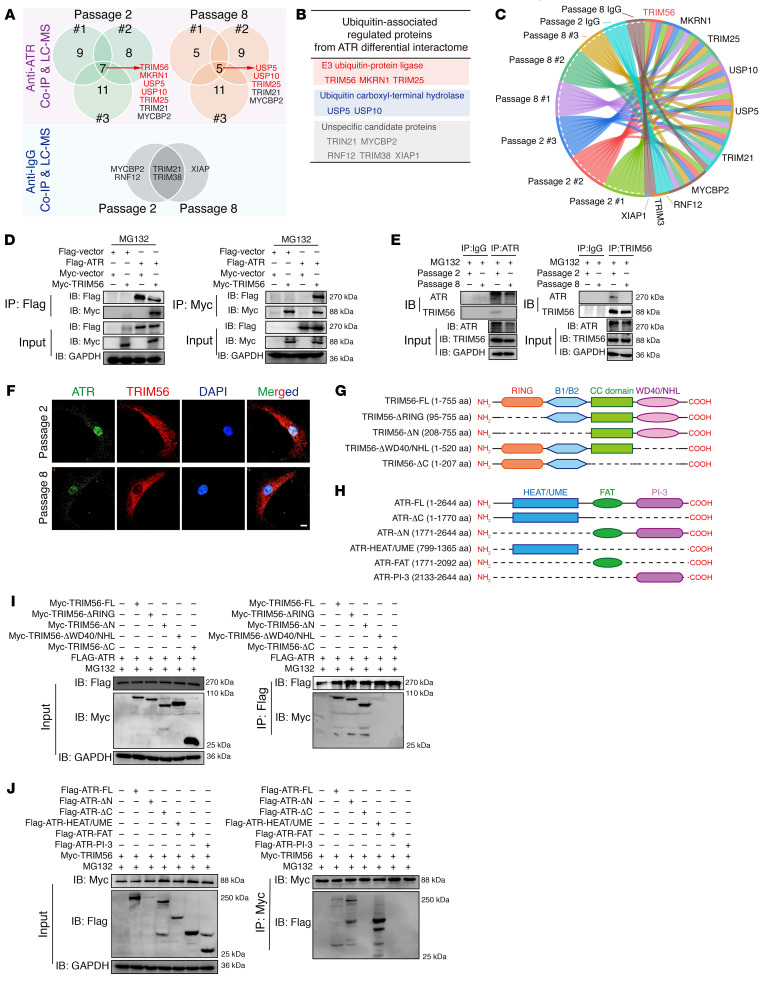
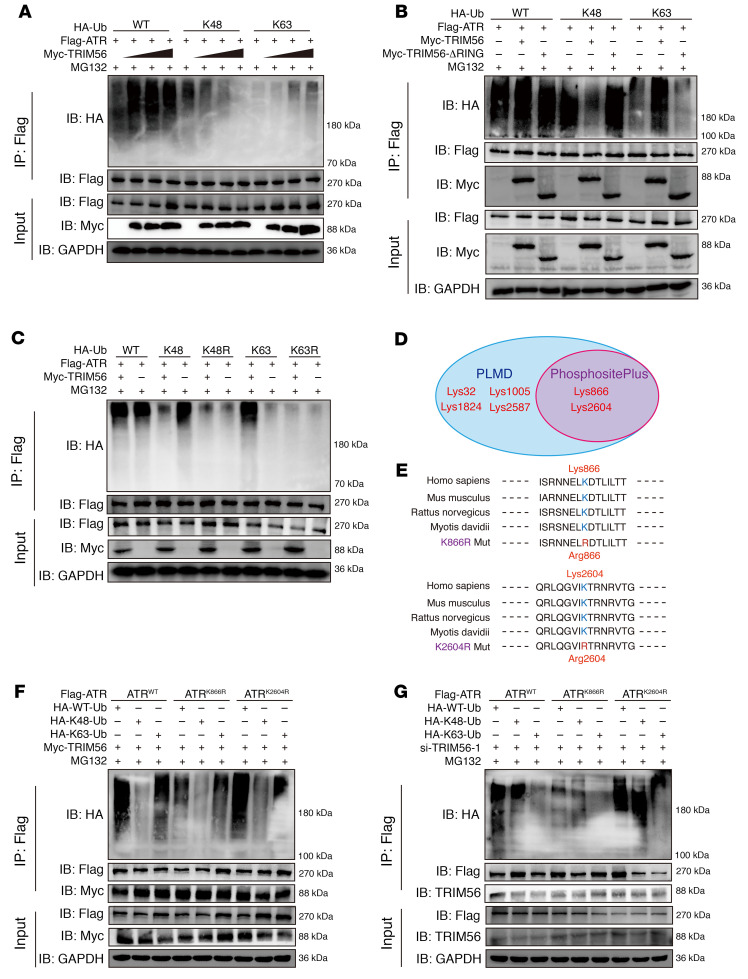
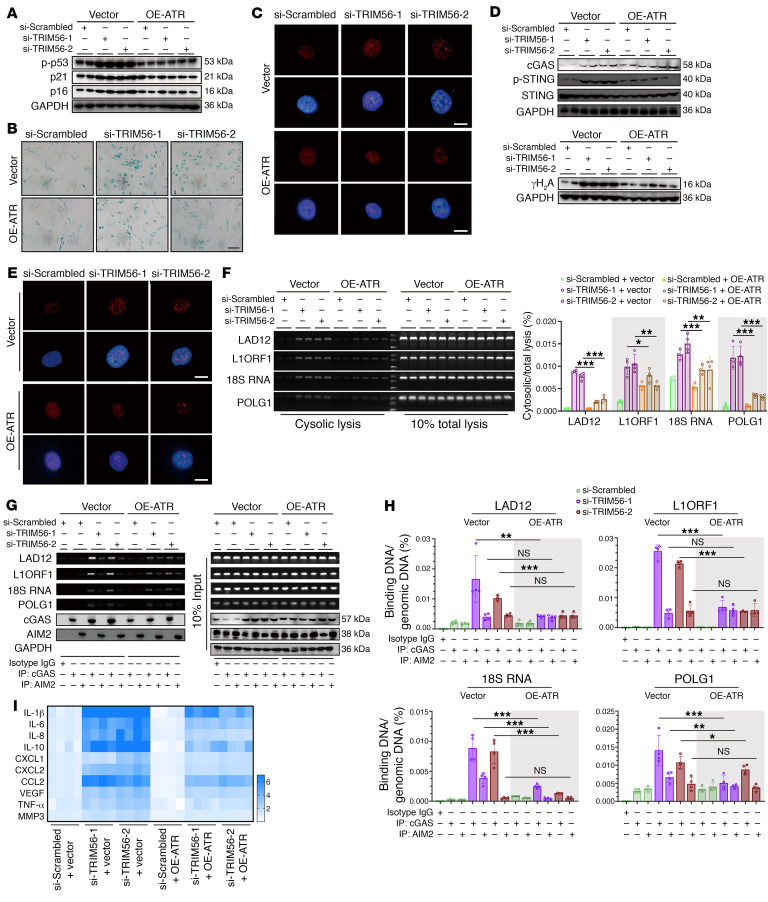
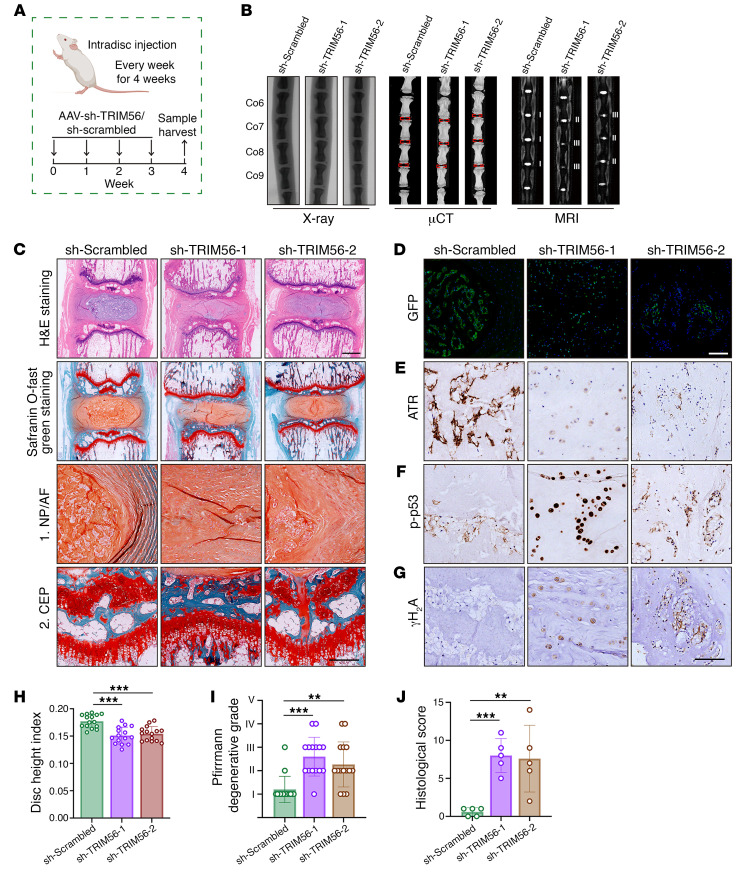
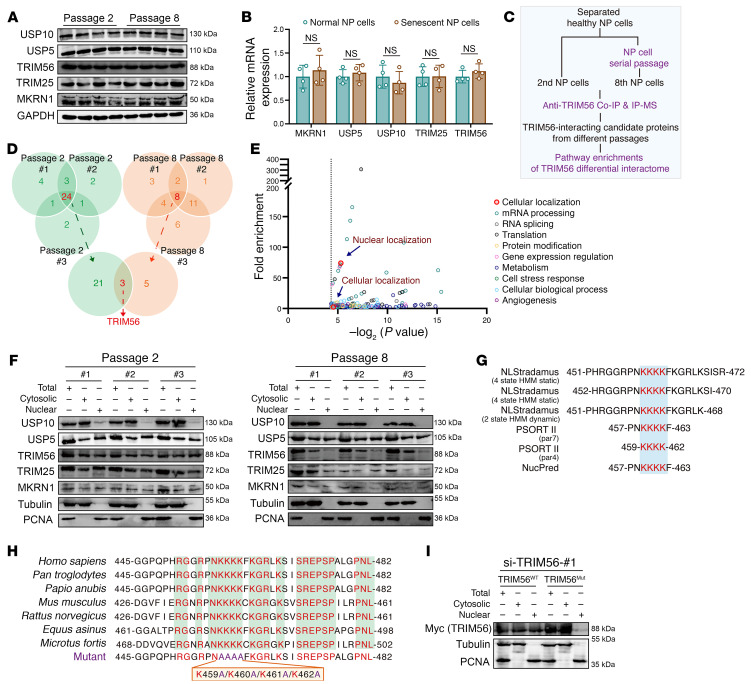
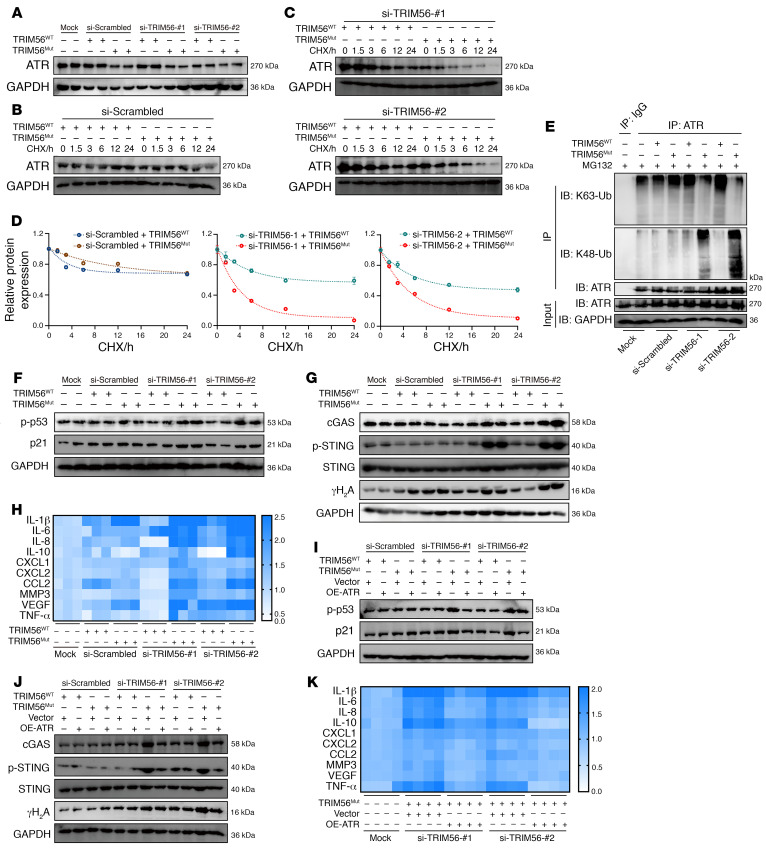
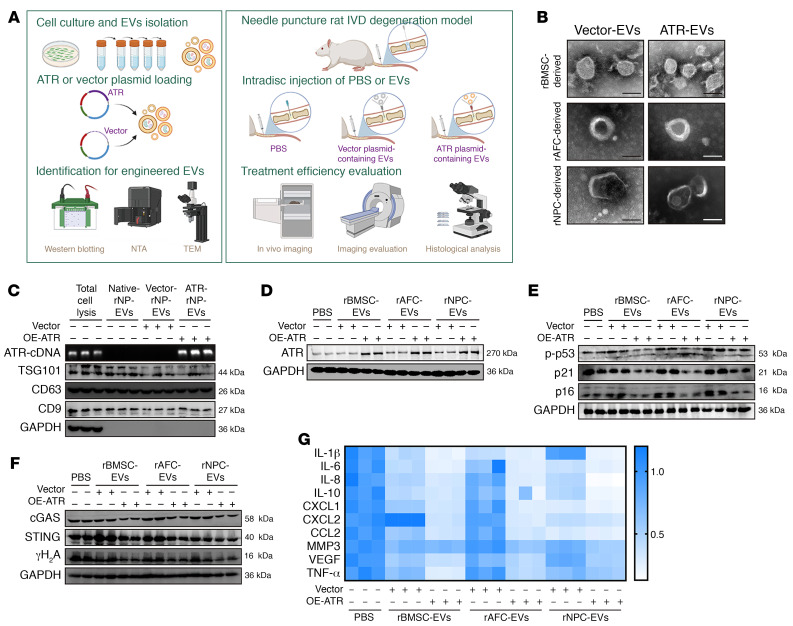
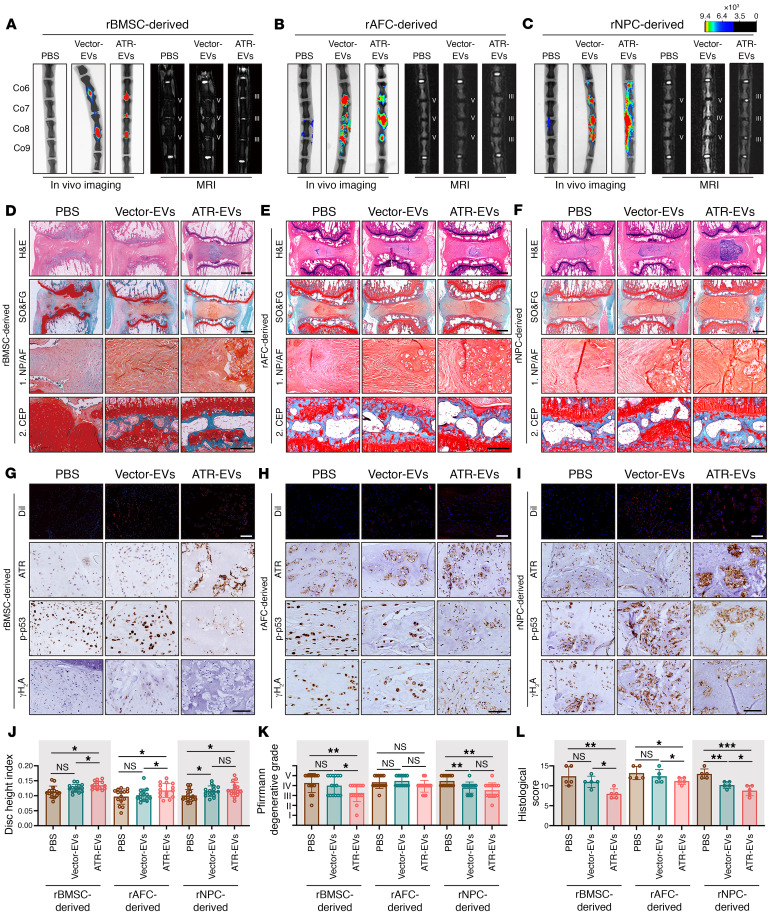
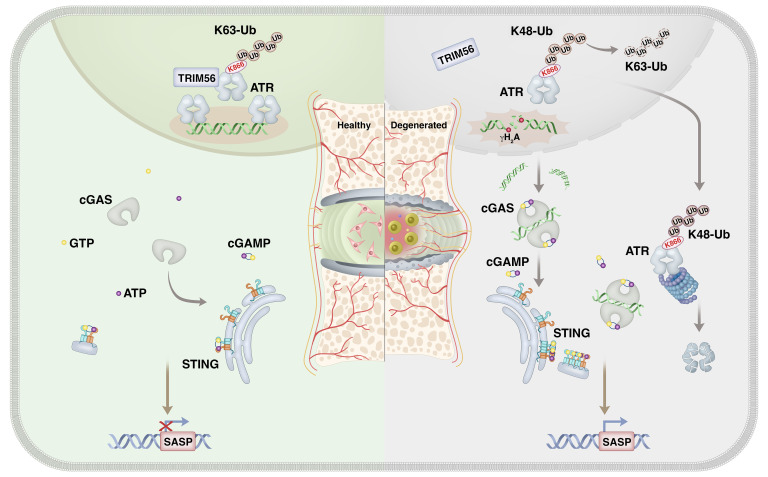
As the leading cause of disability worldwide, low back pain (LBP) is recognized as a pivotal socioeconomic challenge to the aging population and is largely attributed to intervertebral disc degeneration (IVDD). Elastic nucleus pulposus (NP) tissue is essential for the maintenance of IVD structural and functional integrity. The accumulation of senescent NP cells with an inflammatory hypersecretory phenotype due to aging and other damaging factors is a distinctive hallmark of IVDD initiation and progression. In this study, we reveal a mechanism of IVDD progression in which aberrant genomic DNA damage promoted NP cell inflammatory senescence via activation of the cyclic GMP-AMP synthase/stimulator of IFN genes (cGAS/STING) axis but not of absent in melanoma 2 (AIM2) inflammasome assembly. Ataxia-telangiectasia-mutated and Rad3-related protein (ATR) deficiency destroyed genomic integrity and led to cytosolic mislocalization of genomic DNA, which acted as a powerful driver of cGAS/STING axis-dependent inflammatory phenotype acquisition during NP cell senescence. Mechanistically, disassembly of the ATR-tripartite motif-containing 56 (ATR-TRIM56) complex with the enzymatic liberation of ubiquitin-specific peptidase 5 (USP5) and TRIM25 drove changes in ATR ubiquitination, with ATR switching from K63- to K48-linked modification, c thereby promoting ubiquitin-proteasome-dependent dynamic instability of ATR protein during NP cell senescence progression. Importantly, an engineered extracellular vesicle-based strategy for delivering ATR-overexpressing plasmid cargo efficiently diminished DNA damage-associated NP cell senescence and substantially mitigated IVDD progression, indicating promising targets and effective approaches to ameliorate the chronic pain and disabling effects of IVDD.

Keywords: Bone biology; Bone disease; Orthopedics.


Figures

Figure 1
Figure 1. Aberrant genomic DNA damage promotes NP cell senescence during IVDD.
(A) Schematic workflow showing RNA-Seq and GSEA from human NP tissues (n = 6). (B) Representative MRIs, general views, and SO&FG staining of human NP tissues. Scale bar: 100 μm. (C) IHC staining of p-p53 and p21 in human NP tissues. Scale bars: 100 μm. (D) IHC staining of γH2A and 53BP in human NP tissues. Scale bars: 100 μm. (E) Representative Western blots showing expression of p-p53, p21, p16, and γH2A in human NP tissues (n = 24). (F) Correlation analysis between p-p53/γH2A and Pfirrmann degenerative grades (n = 24). (G) Representative Western blots showing expression of p-p53, p21, p16, γH2A, and 53BP in human NP cells treated with 50 μM cisplatin for 24 hours (n = 4 biological replicates). (H) Representative images of SA–β-gal staining of human NP cells. Scale bar: 100 μm. (I) IF staining of γH2A foci in human NP cells. Scale bar: 10 μm. (J) Heatmap of reverse transcription quantitative PCR (RT-qPCR) analysis showing the SASP in human NP cells (n = 4 biological replicates). At least 3 independent experiments were performed. Data are presented as the mean ± SEM. Simple linear regression analysis was performed in F.
Figure 2
Figure 2. Genomic DNA damage–induced NP cell senescence promotes the degeneration of IVDs in vivo.
(A) Schematic illustration of the experimental design. (BD) Representative x-ray images (B), μCT images (C), and MRI (D) of rat coccygeal IVDs treated with intradisc injection of cisplatin at different concentrations (n = 5). (E) H&E staining and SO&FG staining of rat coccygeal IVDs. Scale bar: 1 mm. (F) IHC staining of p-p53 and γH2A in rat coccygeal IVDs. Scale bar: 250 μm. (GI) Disc height index (G) (n = 15 biological replicates), Pfirrmann degenerative grades (H) (n = 15 biological replicates) and histological score (I) (n = 5 biological replicates) of rat coccygeal IVDs. Data are presented as the mean ± SEM. At least 3 independent experiments were performed. **P < 0.01 and ***P < 0.001, by 2-way ANOVA (GI).
Figure 3
Figure 3. Replicative senescence triggers the inflammatory senescence phenotype acquisition of NP cells during IVDD progression.
(A) GSEA showing enrichment of “replicative senescence” in degenerated NP tissues. (B) Relative telomere lengths of isolated NP cells from human NP tissues with different Pfirrmann degenerative grades (n = 24). (C) Correlation analysis between relative telomere length and Pfirrmann degenerative grades (n = 24). (D) Relative telomere lengths from age- and sex-matched case pairs of NP tissues (n = 20). (E) Differential heatmap of the SASP in NP cells (n = 4 biological replicates). (F) Change pathways of transcriptional profiles enriched in P8 NP cells compared with P2 NP cells (n = 3 biological replicates). (G) Correlation analysis of differential transcriptional profiles in cultured NP cells (y axis) compared with those in isolated NP cells from human NP tissues (x axis). (H) Representative Western blots of p-p53, p21, and p16 levels in NP cells (n = 4 biological replicates). (I) Representative Western blots of γH2A, and 53BP levels in NP cells (n = 4 biological replicates). (J) IF staining of γH2A foci in NP cells. Scale bars: 10 μm. Data are presented as the median ± IQR or the mean ± SEM. At least 3 independent experiments were performed. *P < 0.05, **P < 0.01, by permutation test (A), rank-sum test (B), paired Student’s t test (D), and simple linear regression (C and G).
Figure 4
Figure 4. CytoDNA acts as the NP cell inflammatory senescence trigger via cGAS/STING axis sensing, not AIM2 inflammasome activation.
(A) GSEA showing enrichment of the “cytosolic DNA sensing pathway” in degenerated NP tissues. (B and C) Representative DNA electrophoresis images and the ratio of cytosolic genomic DNA to total genomic DNA in NP cells (n = 4 biological replicates). (D) Differential expression heatmap showing cytosolic DNA sensors from RNA-Seq of human NP tissues (n = 6). (E) Representative Western blots showing cGAS, STING, p-STING, and AIM2 levels in NP cells (n = 4 biological replicates). (F) GSEA showing enrichment of “STING-mediated induction of the host immune response” in senescent P8 NP cells. (G) DNA IP and the quantitative ratio of genomic DNA binding with cGAS or AIM2 to total genomic DNA in NP cells (n = 3 biological replicates). (H) Differential heatmap showing the SASP in senescent P8 NP cells after treatment with si-cGAS and si-AIM2 (n = 3 biological replicates). (I) Representative Western blots showing cGAS and STING levels in human NP samples (n = 24). Data are presented as the mean ± SEM. *P < 0.05, **P < 0.01, and ***P < 0.001, by permutation test (A and F), paired Student’s t test (C), and 2 way ANOVA (G).
Figure 5
Figure 5. cGAS/STING axis activation drives inflammatory phenotype acquisition of senescent NP cells via p65-mediated transcriptional modulation.
(A) Volcano plot showing enriched differential pathways of transcriptional profiles in senescent NP cells after treatment with H-151 (1 μM for 24 h) (n = 3 biological replicates). (B) Correlation analysis of differential transcriptional profiles in senescent NP cells treated with H-151 or DMSO (y axis) compared with those in isolated NP cells from human NP tissues (x axis). Simple linear regression was performed to determine significance. (C) Venn diagram showing overlapping TFs involved in the degenerative and senescent processes. (D and E) Venn diagram (D) and table (E) showing overlapping senescence induction–associated TFs based on the integrated analysis of enriched TFs and senescence-associated genes from the CellAge database. (F) GSEA-enriched “NF-κB signal” pathways in degenerated NP tissues. (G) GSEA-enriched “NF-κB signal pathways” in senescent NP cells and STING inhibitor–pretreated senescent NP cells. (H) Differential heatmap of the SASP in senescent P8 NP cells after treatment with the NF-κB inhibitor JSH-23 (10 μM for 24 h) (n = 4 biological replicates). (I) PCA plot showing clustering of p65-bound peaks in human NP tissues via CUT&Tag-Seq analysis (n = 6). (J) Distribution of p65-bound genomic regions. (K) Heatmap showing p65-binding peaks in human NP tissues (n = 6). (L) GO analysis of p65-bound peak annotations. (M) KEGG analysis of p65-bound peak annotations. (N) Differentially enriched GO and KEGG pathways upregulated in degenerated NP tissues.
Figure 6
Figure 6. ATR deficiency promotes genomic instability and cGAS/STING axis–dependent inflammatory senescence of NP cells during IVDD progression.
(A) IHC staining of ATR in human NP tissues. Scale bars: 100 μm. (B) Representative Western blots of ATR expression in human NP tissues (n = 24). (C) Representative Western blots of ATR expression in NP cells (n = 3 biological replicates). (D) Correlation analysis between ATR expression and Pfirrmann degenerative grades (n = 24). (E) Representative x-ray images, μCT images, and MRIs of rat coccygeal IVDs. (F) H&E staining and SO&FG staining of rat coccygeal IVDs. Scale bars: 1 mm. (G) IHC staining of ATR in rat coccygeal IVDs. Scale bars: 250 μm. (H) Representative Western blots showing p-p53 and p21 levels in P2 NP cells transfected with si-ATR (n = 4 biological replicates). (I) Representative Western blots showing cGAS, STING, and γH2A levels in P2 NP cells (n = 4 biological replicates). (J) IF staining of γH2A foci in P2 NP cells. Scale bar: 10 μm.
Figure 7
Figure 7. Ubiquitylation shift from K63-linked to K48-linked modification and ubiquitylation proteolysis–mediated ATR dynamic instability contribute to ATR deficiency in senescent NP cells.
(A) Schematic workflow showing IP-MS performed to identify ATR-interacting proteins in NP cells (n = 3 biological replicates). (B and C) KEGG (B) and GO (C) analysis showing the differential ATR interactome enriched in senescent NP cells. (D) Relative mRNA levels of ATR in NP cells (n = 3 biological replicates). (E) Half-life analysis of endogenous ATR protein in NP cells treated with 100 μg/mL cycloheximide (CHX) at different time points (n = 3 biological replicates). (F) Representative Western blots showing ATR expression in NP cells treated with 100 μg/mL CHX and 10 μM MG132 or 50 μM CQ for 12 hours (n = 3 biological replicates). (G) Endogenous ubiquitination of ATR in NP cells after treatment with 10 μM MG132 for 6 hours (n = 2 biological replicates). (H) Endogenous K48-linked and K63-linked ubiquitination of ATR in NP cells after treatment with 10 μM MG132 for 6 hours (n = 2 biological replicates). (I) K48-linked and K63-linked ubiquitination of ATR in human sample pairs (n = 12). (J) Representative PLA images and quantitative analysis of rat coccygeal IVDs (n = 50 cells per condition). Scale bar: 20 μm. Data are presented as the mean ± SEM or the median ± IQR. At least 3 independent experiments were performed. *P < 0.05, **P < 0.01, and ***P < 0.001, by unpaired Student’s t test (D) and rank-sum test (J). IB, immunoblot.
Figure 8
Figure 8. ATR interactomic analysis identifies TRIM56 as an important E3 ligase in the regulation of ATR ubiquitination.
(A and B) Venn diagrams (A) and table (B) of the ATR interactome showing the intersection of E3 ligases and USPs from NP cells (n = 3 biological replicates). (C) Chordal graph showing the differential abundance of ATR-interacting E3 ligases and USPs in NP cells. (D) Exogenous interaction analysis of ATR and TRIM56 in HEK293T cells. (E) Endogenous co-IP analysis showing the difference in ATR and TRIM56 interaction in normal and senescent NP cells. F) IF analysis of endogenous colocalization of ATR and TRIM56 in NP cells. Scale bar: 10 μm. (G and H) Schematic illustration showing TRIM56 (G) and ATR (H) with mutations in different domains. (I) Exogenous co-IP analysis of the interaction domain of TRIM56 binding with ATR. (J) Exogenous co-IP analysis of the interaction domain of ATR binding with TRIM56. At least 3 independent experiments were performed.
Figure 9
Figure 9. Loss of interaction with TRIM56 drives the ATR ubiquitination shift from K63-linked to K48-linked modification.
(A) Exogenous K48-and K63-linked ubiquitination (Ub) of ATR in HEK293T cells cotransfected with Myc-tagged TRIM56 at different doses. (B) Exogenous K48-linked and K63-linked ubiquitination of ATR in HEK293T cells cotransfected with Myc-tagged TRIM56 or the RING domain–deleting mutant (TRIM56-ΔRING). (C) Exogenous K48- and K63-linked ubiquitination of ATR in HEK293T cells cotransfected with specific HA-tagged ubiquitin K-only or K-mutated constructs. (D) Venn diagram of the predicted ubiquitinated modification of lysine residues in ATR from the PhosphoSitePlus database and PLMD. (E) Sequence conservation analysis of predicted lysine residues in multiple species. (F and G) Exogenous K48-linked and K63-linked ubiquitination of WT ATR, ATRK866R, or ATRK2604R mutants in HEK293T cells in the presence (F) or absence (G) of TRIM56. At least 3 independent experiments were performed.
Figure 10
Figure 10. Loss of TRIM56 promotes ATR/cytoDNA/cGAS/STING axis–dependent NP cell senescence.
(A) Representative Western blots showing p-p53, p21, and p16 in TRIM56-silenced NP cells with or without ATR overexpression (n = 2 biological replicates). (B) Representative SA–β-gal staining in P2 NP cells with the indicated treatments. Scale bar: 100 μm. (C) Representative images of SAHFs in P2 NP cells with the indicated treatments. Scale bars: 10 μm. (D) Representative Western blots showing cGAS, STING, p-STING, and γH2A expression in P2 NP cells with the indicated treatments (n = 2 biological replicates). (E) IF staining of γH2A foci in P2 NP cells with the indicated treatments. Scale bars: 10 μm. (F) Ratio of cytosolic genomic DNA to total genomic DNA in P2 NP cells with the indicated treatments (n = 4 biological replicates). (G and H) DNA IP and ratio of genomic DNA binding with cGAS or AIM2 to total genomic DNA in P2 NP cells with the indicated treatments (n = 4 biological replicates). (I) Heatmap of differential SASP in P2 NP cells with the indicated treatments (n = 4 biological replicates). Data are presented as the mean ± SEM. At least 3 independent experiments were performed. *P < 0.05, **P < 0.01, and ***P < 0.001, by 2-way ANOVA (F and H).
Figure 11
Figure 11. TRIM56 deficiency decreases ATR expression and promotes senescence-associated degeneration of rat coccygeal IVDs.
(A) Schematic illustration of the experimental design (n = 5). (B) Representative x-ray images, μCT images, and MRIs of rat coccygeal IVDs treated with an intradisc injection of AAV–sh-scrambled or AAV–sh-TRIM56. (C) H&E staining and SO&FG staining of rat coccygeal IVDs. Scale bars: 1 mm. (D) IF staining of GFP in rat coccygeal IVDs. Scale bars: 20 μm. (EG) IHC staining of ATR (E), p-p53 (F), and γH2A (G) in rat coccygeal IVDs. Scale bars: 250 μm. (HJ) Disc height index (H) (n = 15 biological replicates), Pfirrmann degenerative grades (I) (n = 15 biological replicates), and histological score (J) (n = 5 biological replicates) for rat coccygeal IVDs. Data are presented as the mean ± SEM. At least 3 independent experiments were performed. **P < 0.01 and ***P < 0.001, by 2-way ANOVA (HJ).
Figure 12
Figure 12. Mislocalization of TRIM56 from the cellular nucleus to the cytoplasm is a unique molecular event occurring in senescent NP cells.
(A) Representative Western blots of USP10, USP5, TRIM56, TRIM25, and MKRN1 expression in NP cells (n = 4 biological replicates). (B) Relative mRNA expression of USP10, USP5, TRIM56, TRIM25, and MKRN1 in NP cells (n = 4 biological replicates). (C) Schematic workflow showing the IP-MS assay to identify TRIM56-interacting proteins (n = 3 biological replicates). (D) Venn diagrams showing differential ATR interactome in normal (n = 3) and senescent (n = 3) NP cells. (E) GO analysis of TRIM56 interactome showing differential pathways enriched in normal NP cells. (F) Representative Western blots showing total, cytosolic, and nuclear TRIM56 in NP cells (n = 3 biological replicates). (G) Protein sequence diagram showing the predicted NLS in TRIM56 from the NLStradamus database and PSORT. (H) Sequence conservation analysis of predicted lysine residues in multiple species. (I) Representative Western blots showing total, cytosolic, and nuclear amounts of TRIM56WT and TRIM56Mut in siRNA-induced, TRIM56-deficient P2 NP cells after transfection with Myc-tagged plasmids. Data are presented as the mean ± SEM. At least 3 independent experiments were performed. NS, not significant; unpaired Student’s t test (B).
Figure 13
Figure 13. Cytosolic escape of TRIM56 triggers an ATR dynamic imbalance and promotes NP cell inflammatory senescence via activation of the cGAS/STING axis.
(A) Representative Western blots of ATR in P2 NP cells with the indicated treatments (n = 2 biological replicates). (BD) Half-life analysis showing endogenous ATR protein levels in siRNA-induced TRIM56-deficient P2 NP cells after transfection with TRIM56WT or TRIM56Mut plasmids and treatment with 100 μg/mL CHX at different time points (n = 3 biological replicates). (E) Endogenous K48-linked and K63-linked ubiquitination of ATR in P2 NP cells with the indicated treatments. (F) Representative Western blots of p-p53 and p21 in P2 NP cells with the indicated treatments (n = 2 biological replicates). (G) Representative Western blots of cGAS, STING, p-STING, and γH2A in P2 NP cells with the indicated treatments (n = 2 biological replicates). (H) Differential heatmap of SASP in P2 NP cells with the indicated treatments (n = 3 biological replicates). (I) Representative Western blots of p-p53 and p21 in P2 NP cells with the indicated treatments (n = 2 biological replicates). (J) Representative Western blots of cGAS, STING, p-STING, and γH2A in siRNA-induced TRIM56-deficient P2 NP cells after cotransfection with TRIM56WT or TRIM56Mut and vector or OE-ATR plasmids (n = 2 biological replicates). (K) Differential heatmap of SASP in P2 NP cells with the indicated treatments (n = 4 biological replicates). Data are presented as the mean ± SEM. At least 3 independent experiments were performed.
Figure 14
Figure 14. EV-based ATR-overexpressing plasmid cargo alleviates NP cell inflammatory senescence.
(A) Schematic illustration showing the experimental design. (B) Representative TEM images of EVs loaded with ATR-overexpressing (ATR-EVs) or vector plasmid (vector-EVs). Scale bars: 100 nm. (C) Western blots of EV markers and cDNA electrophoresis to determine the efficiency of an ATR-overexpressing plasmid loaded into rNPC-derived EVs (n = 3 biological replicates). (D) Representative Western blots of ATR levels in P8 rat NP cells after culturing with ATR-EVs or vector-EVs for 72 hours (n = 2 biological replicates). (E) Representative Western blots of p-p53 (Ser15) and p21 levels in P8 rat NP cells with the indicated treatments (n = 2 biological replicates). (F) Representative Western blots of cGAS, STING, and γH2A levels in P8 rat NP cells with the indicated treatments (n = 2 biological replicates). (G) Differential heatmap of SASP in P8 rat NP cells with the indicated treatments (n = 3 biological replicates).
Figure 15
Figure 15. EV-based ATR-overexpressing plasmid cargo exhibits efficient therapeutic effects in ameliorating the severity of IVDD.
(AC) Representative in vivo images of coccygeal IVDs in rats immediately after treatment with the intradisc injection of ATR-EVs or vector-EVs and representative MRIs of rat coccygeal IVDs treated with an intradisc injection of ATR-EVs or vector-EVs for 4 weeks (n = 5). (DF) H&E staining and SO&FG staining of rat coccygeal IVDs. Scale bar: 1 mm. (GI) IF staining of DiI-labeled EVs in rat coccygeal IVDs (scale bars: 50 μm) and IHC staining of ATR, p-p53, and γH2A expression in rat coccygeal IVDs (scale bars: 250 μm). (JL) Disc height index (J) (n = 15 biological replicates), Pfirrmann degenerative grades (K) (n = 15 biological replicates), and histological score (L) (n = 5 biological replicates) for rat coccygeal IVDs. Data are presented as the mean ± SEM. At least 3 independent experiments were performed. *P < 0.05, **P < 0.01, and ***P < 0.001, by 2-way ANOVA (JL).
Figure 16
Figure 16. Disassembly of the TRIM56-ATR complex promotes cytoDNA/cGAS/STING axis–dependent intervertebral disc inflammatory degeneration.
Schematic illustration showing a mechanism linking ubiquitination of ATR and cytoDNA sensing of the cGAS/STING axis in genomic DNA damage–associated NP cell senescence and IVDD progression.

References

    1. Knezevic NN, et al. Low back pain. Lancet. 2021;398(10294):78–92. doi: 10.1016/S0140-6736(21)00733-9. - DOI - PubMed
    1. Binch ALA, et al. Cell-based strategies for IVD repair: clinical progress and translational obstacles. Nat Rev Rheumatol. 2021;17(3):158–175. doi: 10.1038/s41584-020-00568-w. - DOI - PubMed
    1. Cheung KM, et al. Prevalence and pattern of lumbar magnetic resonance imaging changes in a population study of one thousand forty-three individuals. Spine (Phila Pa 1976) 2009;34(9):934–940. doi: 10.1097/BRS.0b013e3181a01b3f. - DOI - PubMed
    1. Lyu FJ, et al. Painful intervertebral disc degeneration and inflammation: from laboratory evidence to clinical interventions. Bone Res. 2021;9(1):7. doi: 10.1038/s41413-020-00125-x. - DOI - PMC - PubMed
    1. Lyu FJ, et al. IVD progenitor cells: a new horizon for understanding disc homeostasis and repair. Nat Rev Rheumatol. 2019;15(2):102–112. doi: 10.1038/s41584-018-0154-x. - DOI - PubMed

MeSH terms

Substances