. 2024 May;11(20):e2305581.
doi: 10.1002/advs.202305581. Epub 2024 Mar 15.

Manipulation of Glutamatergic Neuronal Activity in the Primary Motor Cortex Regulates Cardiac Function in Normal and Myocardial Infarction Mice

Affiliations

Manipulation of Glutamatergic Neuronal Activity in the Primary Motor Cortex Regulates Cardiac Function in Normal and Myocardial Infarction Mice

Wenyan Bo et al. Adv Sci (Weinh). 2024 May.

Abstract

Cardiac function is under neural regulation; however, brain regions in the cerebral cortex responsible for regulating cardiac function remain elusive. In this study, retrograde trans-synaptic viral tracing is used from the heart to identify a specific population of the excitatory neurons in the primary motor cortex (M1) that influences cardiac function in mice. Optogenetic activation of M1 glutamatergic neurons increases heart rate, ejection fraction, and blood pressure. By contrast, inhibition of M1 glutamatergic neurons decreased cardiac function and blood pressure as well as tyrosine hydroxylase (TH) expression in the heart. Using viral tracing and optogenetics, the median raphe nucleus (MnR) is identified as one of the key relay brain regions in the circuit from M1 that affect cardiac function. Then, a mouse model of cardiac injury is established caused by myocardial infarction (MI), in which optogenetic activation of M1 glutamatergic neurons impaired cardiac function in MI mice. Moreover, ablation of M1 neurons decreased the levels of norepinephrine and cardiac TH expression, and enhanced cardiac function in MI mice. These findings establish that the M1 neurons involved in the regulation of cardiac function and blood pressure. They also help the understanding of the neural mechanisms underlying cardiovascular regulation.

Keywords: cardiac function; median raphe nuclei; myocardial infarction; primary motor cortex.


Conflict of interest statement

The authors declare no conflict of interest.

Figures
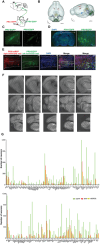
Figure 1
Figure 1
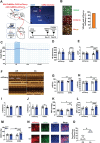
A perspective on whole‐brain imaging through cardiac‐derived pseudorabies virus tracing. A) PRV‐EGFP or PRV‐mRFP was respectively injected into the left or right ventricular wall. B) Sagittal (left) and horizontal (right) views of PRV‐positive neurons in the whole brain of mouse, including red (cortex), blue (hypothalamus), yellow (superior colliculus), violet (midbrain), and green (pons, medulla, spinal cord). C) Representative 3D reconstruction of PRV‐EGFP labeled cortical neurons. D) Representative images showing EGFP‐positive neurons (green) in the cortex. Scale bar, 500 µm (left) and 100 µm (right). E) Representative coronal brain sections showing co‐labeling of mRFP and EGFP‐positive neurons in M1 and S1 from the same mouse 5.5 days after receiving PRV‐EGFP injection into the left ventricular wall and PRV‐mRFP injection into the right ventricular wall 5.5 days previously. Scale bar, 88.52 µm. F) Images are representative of positively labeled neurons in the brain. Scale bar, 500 µm. G) The number of positive neurons in the brain. Abbreviations are: 10N, dorsal motor nucleus of vagus;7N, facial nucleus; alv, alveus of the hippocampus; AcbC, accumbent nucleus core; AcbSh, accumbent nucleus shell; ADP, anterodorsal preoptic nucleus; AHA, anterior hypothalamic area, anterior part; AHP, anterior hypothalamic area, posterior part; AL, nucleus of the ansa lenticularis; Amb, ambiguous nucleus; Apir, amygdalopiriform transition area; ARC, arcuate hypothalamic nucleus; BLA, basolateral amygdaloid nucleus anterior part; BLP, basolateral amygdaloid nucleus posterior part; BMP, basomedial amygdaloid nucleus posterior part; BSTLP, bed nucleus of the stria terminalis, lateral division posterior part; BSTLV, bed nucleus of the stria terminalis, lateral division ventral part; BSTMA, bed nucleus of the stria terminalis, medial division anterior part; BSTMPI, bed nucleus of the stria terminalis, medial division posterolateral part; BSTMPL, bed nucleus of the stria terminalis, medial division, posterolateral part; BSTMV, bed nucleus of the stria terminalis, medial division ventral part; CeC, central amygdaloid nucleus, capsular part; CA3, field CA3 of hippocampus; CeM, central amygdaloid nucleus, medial division; CnF, cuneiform nucleus; DG, dentate gyrus; DLPAG, dorsolateral periaqueductal gray; DM, dorsomedial hypothalamic nucleus; DMC, dorsomedial hypothalamic nucleus compact part; DMD, dorsomedial hypothalamic nucleus dorsal part; DMPAG, dorsomedial periaqueductal gray; DMTg, dorsomedial tegmental area; DMV, dorsomedial hypothalamic nucleus ventral part; DpMe, deep mesencephalic nucleus; DpWh, deep white layer of the superior colliculus; DRVL, dorsal raphe nucleus, ventrolateral part; DPGi, dorsal paragigantocellular nucleus; ECu, external cuneate nucleus; f, fornix; Gi, gigantocellular reticular nucleus; GiA, gigantocellular reticular nucleus alpha part; GiV, gigantocellular reticular nucleus, ventral part; IPACL, interstitial nucleus of the posterior limb of the anterior commissure, later part; IPACM, interstitial nnucleus of the posterior limb of the anterior commissure, medial part; IRt, intermediate reticular nucleus; LDTg, laterodorsal tegmental nucleus; LDTgV, laterodorsal tegmental nucleus ventral part; LH, lateral hypothalamic area; LPAG, lateral periaueductal gray; LPB, lateral parabrachial nucleus; LPGi, lateral paragigantocellular nucleus; LPO, lateral preoptic area; LRt, lateral reticular nucleus; LSI, lateral septal nucleus, intermediate part; LSV, lateral septal nucleus, ventral part; M1, primary motor cortex; M2, secondary motor cortex; MDM, mediodorsal thalamic nucleus, medial part; ml, medial lemniscus; m5, motor root of the trigeminal nerve; Me5, mesencephalic trigeminal nucleus; MnPO, median preoptic nucleus; MnR, median raphe nucleus; MPA, medial preoptic area; MVeMC, medial vestibular nucleus, magnocellular part; MePD, medial amygdaloid nucleus, posterodorsal part; MPOM, medial preoptic nucleus, medial part; MvePC, medial vestibular nucleus, parvicellular part; PrC, precommissural nucleus; PAG, periaqueductal gray; PCRt, parvicellular reticular nucleus; PCRtA, parvicellular reticular nucleus, alpha part; PH, posterior hypothalamic area; PL, paralemniscal nucleus; PnC, pontine reticular nucleus, caudal part; PnO, pontine reticular nucleus, oral part; PnV, pontine reticular nucleus, ventral part; PPTg, pedunculopontine tegmental nucleus; Prl, prelimbic cortex; PSTh, parasubthalamic nucleus; PVN, paraventricular hypothalamic nucleus; Rli, rostral linear nucleus of the raphe; RMg, raphe magnus nucleus; Rob, raphe of obscurus nucleus; RR, retrorubral nucleus; RtTg, reticulotegmental nucleus of the pons; S1, primary somatosensory cortex; S2, secondary somatosensory cortex; SI, substantia innominate; So1DL, solitary tract, dorsolateral part; So1lM, nucleus of the solitary tract, intermediate part; SolC, nucleus of the solitary tract, commissural part; SolG, nucleus of the solitary tract, gelatinous part; SolM, nucleus of the solitary tract, medial part; SolV, solitary tract, ventral part; SolVL, nucleus of the solitary tract, ventrolateral part; Sp5l, spinal trigeminal tract, interpolar part; Sp5, spinal trigeminal tract; Su5, supratrigeminal nucleus; SubCD, subcoeruleus dorsal nucleus; SubCV, subcoeruleus nucleus, ventral part; SuVe, superior vestibular nucleus; TeA, temporal association cortex; VDB, nucleus of the vertical limb of the diagonal band; VLGPC, ventral lateral geniculate nucleus, parvicellular part; VLL, ventral nucleus of the lateral lemniscus; VLPAG, ventrolateral periaqueductal gray; VM, ventromedial thalamic nucleus; VMH, ventromedial hypothalamic nucleus; VMHDM, ventromedial hypothalamic nucleus, dorsomedial part; VMPO, ventromedial preoptic nucleus; VP, ventral pallidum; ZI, zona incerta; ZID, zona incerta, dorsal part.
Figure 2
Figure 2
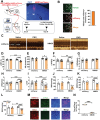
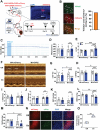
Activating M1 glutamatergic neurons affected heart function and blood pressure. A) Schematic drawing showing viral injection strategy (left), a representative image showing ChR2‐mCherry expression (right top) and the experimental timeline (right bottom), respectively. Scale bar, 500 µm. B) Images showing the overlap between ChR2‐mCherry (red) and vesicular glutamate transporter 2 (VGlut2) (green) in the M1 (left), and the percentage of ChR2 cells expressing VGlut2 (right, n = 4). Scale bar, 50 µm. C) Representative curve graph of HR over time. D, E) Quantification of HR (Two‐way repeated‐measures ANOVA‐Interaction: F (1, 18) = 25.560, P < 0.001; mCherry off versus on, P = 1.000; ChR2 off versus on, P < 0.001; off mCherry versus ChR2, P = 0.444; on mCherry versus ChR2, P = 0.707; mCherry = 10, ChR2 = 10), LF/HF power ratio (Two‐way repeated‐measures ANOVA‐Interaction: F (1, 21) = 48.314, P < 0.001; mCherry off versus on, P = 0.406; ChR2 off versus on, P < 0.001; off mCherry versus ChR2, P = 0.201; on mCherry versus ChR2, P < 0.001;mCherry = 11, ChR2 = 12) in anesthetized mice. F) Examples of echocardiographic images in anesthetized mice. G, H, I, J, K, L, M) Quantification of LVEF (Two‐way repeated‐measures ANOVA‐Interaction: F (1, 18) = 68.023, P < 0.001; mCherry off versus on, P = 0.980; ChR2 off versus on, P < 0.001; off mCherry versus ChR2, P = 0.933; on mCherry versus ChR2, P < 0.01; mCherry = 10, ChR2 = 10), LVFS (Two‐way repeated‐measures ANOVA‐Interaction: F (1, 18) = 16.221, P < 0.01; mCherry off versus on, P = 0.477; ChR2 off versus on, P < 0.01; off mCherry versus ChR2, P = 0.984; on mCherry versus ChR2, P < 0.01; mCherry = 10, ChR2 = 10), LVIDd (Two‐way repeated‐measures ANOVA‐Interaction: F (1, 18) = 0.137, P = 0.715; mCherry off versus on, P = 0.897; ChR2 off versus on, P = 0.699; off mCherry versus ChR2, P = 0.547; on mCherry versus ChR2, P = 0.682; mCherry = 10, ChR2 = 10), LVIDs (Two‐way repeated‐measures ANOVA‐Interaction: F (1, 18) = 9.309, P < 0.01; mCherry off versus on, P = 0.823; ChR2 off versus on, P < 0.001; off mCherry versus ChR2, P = 0.929; on mCherry versus ChR2, P = 0.101; mCherry = 10, ChR2 = 10), SBP (Two‐way repeated‐measures ANOVA‐Interaction: F (1, 18) = 6.232, P < 0.05; mCherry off versus on, P = 0.830; ChR2 off versus on, P < 0.01; off mCherry versus ChR2, P = 0.699; on mCherry versus ChR2, P < 0.05; mCherry = 10, ChR2 = 10), DBP (Two‐way repeated‐measures ANOVA‐Interaction: F (1, 18) = 22.638, P < 0.001; mCherry off versus on, P = 0.816; ChR2 off versus on, P < 0.001; off mCherry versus ChR2, P = 0.699; on mCherry versus ChR2, P < 0.05; mCherry = 10, ChR2 = 10) and MAP (Two‐way repeated‐measures ANOVA‐Interaction: F (1, 18) = 20.249, P < 0.001; mCherry off versus on, P = 0.943; ChR2 off versus on, P < 0.001; off mCherry versus ChR2, P = 0.521; on mCherry versus ChR2, P < 0.01; mCherry = 10, ChR2 = 10) in anesthetized mice. N) Immunohistochemical images showing overlap of ChR2‐mCherry (red) and c‐Fos (green)‐positive neurons in the M1. Scale bar, 100 µm. O) Quantification of c‐Fos‐positive cells in the M1 (Independent t test. t (4) = −4.311, P< 0.05). Data are mean ± SEM. *P < 0.05; **P < 0.01, ***P < 0.001.
Figure 3
Figure 3
Chemogenetic inhibition of M1 glutamatergic neurons suppressed heart function and blood pressure. A) Experimental schematics (left), a representative image showing hM4Di–mCherry expression in the M1 (right top) and the image of experimental timeline (right bottom), respectively. Scale bar, 500 µm. B) Images showing the overlap between VGlut2 (green) and hM4Di‐mCherry (red) in the M1 (left), and the percentage of hM4Di cells expressing VGlut2 (right, n = 4). Scale bar, 25 µm. C) Examples of echocardiographic images in anesthetized mice. D, E, F, G, H, I) Quantification of LVEF (Two‐way repeated‐measures ANOVA‐Interaction: F (1, 22) = 52.169, P < 0.001; mCherry Saline versus CNO, P = 0.876; hM4Di Saline versus CNO, P < 0.001; Saline mCherry versus hM4Di, P = 0.161; CNO mCherry versus hM4Di, P < 0.001, mCherry = 12, hM4Di = 12), HR (Two‐way repeated‐measures ANOVA‐Interaction: F (1, 22) = 5.931, P < 0.05; mCherry Saline versus CNO, P = 0.267; hM4Di Saline versus CNO, P < 0.05; Saline mCherry versus hM4Di, P = 0.286; CNO mCherry versus hM4Di, P = 0.740; mCherry = 12, hM4Di = 12), LVFS (Two‐way repeated‐measures ANOVA‐Interaction: F (1, 22) = 8.603, P < 0.01; mCherry Saline versus CNO, P = 0.452; hM4Di Saline versus CNO, P < 0.01; Saline mCherry versus hM4Di, P = 0.341; CNO mCherry versus hM4Di, P < 0.01; mCherry = 12, hM4Di = 12), LVIDd (Two‐way repeated‐measures ANOVA‐Interaction: F (1, 22) = 2.420, P = 0.134; mCherry Saline versus CNO, P = 0.819; hM4Di Saline versus CNO, P = 0.062; Saline mCherry versus hM4Di, P = 0.245; CNO mCherry versus hM4Di, P< 0.05; mCherry = 12, hM4Di = 12), LVIDs (Two‐way repeated‐measures ANOVA‐Interaction: F (1, 22) = 13.221, P < 0.01; mCherry Saline versus CNO, P = 0.552; hM4Di Saline versus CNO, P < 0.001; Saline mCherry versus hM4Di, P = 0.155; CNO mCherry versus hM4Di, P< 0.001; mCherry = 12, hM4Di = 12) and LF/HF (Two‐way repeated‐measures ANOVA‐Interaction: F (1, 25) = 95.277, P < 0.001; mCherry Saline versus CNO, P = 0.392; hM4Di Saline versus CNO, P < 0.001; Saline mCherry versus hM4Di, P = 0.691; CNO mCherry versus hM4Di, P < 0.001, mCherry = 13, hM4Di = 14) in anesthetized mice. J, K, L) Quantification of SBP (Two‐way repeated‐measures ANOVA‐Interaction: mCherry Saline versus CNO, P = 0.528; hM4Di Saline versus CNO, P < 0.05; Wilcoxon rank sum test; Saline mCherry versus hM4Di, P = 0.366; CNO mCherry versus hM4Di, P < 0.01; two‐sided Mann–Whitney test. mCherry = 6, hM4Di = 7), DBP (Two‐way repeated‐measures ANOVA‐Interaction: F (1, 11) = 7.796, P < 0.01; mCherry Saline versus CNO, P = 0.578; hM4Di Saline versus CNO, P < 0.001; Saline mCherry versus hM4Di, P = 0.174; CNO mCherry versus hM4Di, P < 0.05, mCherry = 6, hM4Di = 7) and MAP (Two‐way repeated‐measures ANOVA‐Interaction: F (1, 11) = 11.536, P < 0.01; mCherry Saline versus CNO, P = 0.764; hM4Di Saline versus CNO, P < 0.001; Saline mCherry versus hM4Di, P = 0.261; CNO mCherry versus hM4Di, P < 0.01, mCherry = 6, hM4Di = 7) in conscious mice. M) Immunohistochemical images showing overlap of hM4Di (red) and c‐Fos (green) neurons in the M1 expressing mCherry or hM4Di mice. Scale bar, 100 µm. N) Quantification of c‐Fos‐positive cells in the M1 (Independent t test. t (4) = 24.356, P < 0.001). Data are mean ± SEM. *P < 0.05; **P < 0.01, ***P < 0.001.
Figure 4
Figure 4
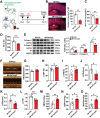
M1 glutamatergic neuronal ablation impaired heart function and reduced blood pressure. A) Experimental schematics (left) and timeline (right). B) Representative images showing NeuN‐positive neurons (red) in M1(left) and the number of neurons+ in M1 (t (4) = 6.884, P < 0.01 by independent t‐tests; Control = 3, taCasp3 = 3) (right), respectively. Scale bar, 500 µm. C) Ablating M1 glutamatergic neurons increased the ratio of heart/body weight (t (9) = −3.921, P < 0.01 by independent t‐tests; Control = 5, taCasp3 = 6). D) Effect of ablating M1 glutamatergic neurons on TH protein levels of left ventricular tissues (t (8) = 2.787, P < 0.05 by independent t‐tests; Control = 5, taCasp3 = 5). E) The NE content of left ventricular myocardium (t (14) = 5.013, P<0.001 by independent t‐tests; Control = 8, taCasp3 = 8). F) Examples of echocardiographic images in anesthetized mice. G, H, I, J, K, L) Quantification of LVEF (t (18) = 7.131, P<0.001 by independent t‐tests; Control = 10, taCasp3 = 10), HR (t (18) = −0.182, P = 0.428 by independent t‐tests; Control = 10, taCasp3 = 10), LVFS (t (18) = 27.854, P<0.001 by independent t‐tests; Control = 10, taCasp3 = 10), LVIDd (t (18) = 0.629, P = 0.537 by independent t‐tests; Control = 10, taCasp3 = 10); LVIDs (t(18) = −3.543, P<0.01 by independent t‐tests; Control = 10, taCasp3 = 10) and LF/HF radio(t (18) = 6.416, P < 0.001 by independent t‐tests; Control = 10, taCasp3 = 10) in anesthetized mice. M, N, O) Quantification of SBP (t (17) = 4.662, P < 0.001 by independent t‐tests; Control = 8, taCasp3 = 11), DBP (t (17) = 5.281, P< 0.001 by independent t‐tests; Control = 8, taCasp3 = 11) and MAP (t (17) = 5.476, P< 0.001 by independent t‐tests; Control = 8, taCasp3 = 11) in conscious mice. Data are mean ± SEM.*P < 0.05; **P < 0.01, ***P < 0.001.
Figure 5
Figure 5
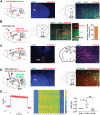
M1 neurons input to MnR. A) Experimental design (left), representative images of mCherry‐labeled M1 neurons (middle) and their fibers in the MnR (right), respectively. Scale bar, 500 µm (middle), 100 µm (right). B) Schematic illustration of hSyn‐CRE virus injection in the M1 and DIO‐ChR2‐mCherry virus injection in the MnR (left), images showing the overlap between ChR2‐mCherry (red) and TPH2 (green) in the M1(middle), and the ratio of TPH2‐positive neurons (right), respectively. Scale bar, 200 µm. C) Experimental design (left), and retrogradely labeled neurons in the M1 (right) by injection of CTB555 into the MnR (middle). Scale bar, 500 µm (middle); 200 µm (right). D) Strategy of viral injection, optogenetic and photometric recording (left); representative images of ChR2‐mCherry‐labeled M1 neurons (middle) and representative images of GCaMP6s+ neurons and ChR2+ fibers in MnR (right), respectively. Scale bar, 500 µm (middle), 100 µm (right). E) A representative trace of calcium signals recorded in MnR (left), heatmap showing fluorescence signals (middle) and quantification of calcium signals (right) (One‐way ANOVA. baseline versus signal, P < 0.05; signal versus poststimulation, P < 0.01; baseline versus poststimulation, P = 0. 508; n = 5), respectively. Data are mean ± SEM. *P < 0.05; **P < 0.01.
Figure 6
Figure 6
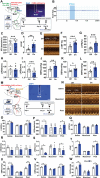
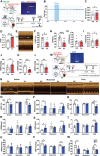
Optogenetic activation of MnR‐projecting neurons of the M1 affected cardiac function. A) Experimental designs (left panel), a representative image showing ChR2‐mCherry expression in MnR and optic fiber implantation above the MnR (right top), and the experimental timeline of the image (right bottom). Scale bar, 500 µm. B) Representative curve graph of heart rate over time. C, D) Quantification of HR (t (8) = −5.109, P < 0.001 by paired t test; n = 9) and LF/HF (t (8) = −4.032, P < 0.01 by paired t test; n = 9). E) Examples of echocardiographic images in anesthetized mice. F, G, H, I, J, K, L) Quantification of LVEF (t (8) = −11.854, P < 0.001 by paired t test; n = 9), LVFS (t(8) = −8.042, P < 0.001 by paired t test; n = 9), LVIDd (t (8) = 0.164, P = 0.873 by paired t test; n = 9), LVIDs (t (8) = 6.424, P < 0.001 by paired t test; n = 9), SBP (t (7) = −4.494, P < 0.01 by paired t test; n = 8), DBP (t (7) = −2.855, P < 0.05 by paired t test; n = 8) and MAP (t(7) = −4.131, P < 0.01 by paired t test; n = 8) in anesthetized mice. M) Schematic of combined optogenetic and pharmacology (left), a representative image showing the location of injector and fiber tip in the MnR (right top) and the image of experimental timeline (right bottom). Scale bar, 1 mm. N) Examples of echocardiographic images in anesthetized mice. O, P, Q, R, S, T, U, V, W) Quantification of LVEF (Saline: t (2) = −6.363, P< 0.05 by paired t test; muscimol: t (2) = 1.936, P = 0.192 by paired t test; Post: t (2) = −5.765, P < 0.05 by paired t test; n = 3), HR (Saline: t (2) = −4.631, P < 0.05 by paired t test; muscimol: t (2) = −1, P = 0.423 by paired t test; Post: t (2) = −8.598, P < 0.05 by paired t test; n = 3), LVFS (Saline: t (2) = −2.666, P = 0.117 by paired t test; muscimol: t (2) = 0.736, P = 0.0.539 by paired t test; Post: Saline: t (2) = −2.238, P = 0.155 by paired t test; n = 3), LVIDd (Saline: t (2) = 3.250, P = 0.083 by paired t test; muscimol: t (2) = 0.780, P = 0.517 by paired t test; Post: t (2) = 2.5, P = 0.130 by paired t test; n = 3), LVIDs (Saline: t (2) = 0.660, P < 0.05 by paired t test; muscimol: t (2) = 0.661, P = 0.576 by paired t test; Post: t (2) = 5, P < 0.05 by paired t test; n = 3) and LF/HF (Saline: t (2) = −4.289, P < 0.05 by paired t test; muscimol: t (2) = −0.301, P = 0.792 by paired t test; Post: t (2) = −6.830, P < 0.05 by paired t test; n = 3), SBP (Saline: t (2) = −7.221, P < 0.05 by paired t test; muscimol: t (2) = −2, P = 0.184 by paired t test; Post: t (2) = −31, P < 0.01 by paired t test; n = 3), DBP (Saline: t (2) = −10.961, P < 0.01 by paired t test; muscimol: t (2) = −4, P = 0.057 by paired t test; Post: t (2) = −4.359, P < 0.05 by paired t test; n = 3), MAP (Saline: t (2) = −10.961, P < 0.05 by paired t test; muscimol: t (2) = −4, P = 0.057 by paired t test; Post: t (2) = −6.982, P < 0.05 by paired t test; n = 3) in anesthetized mice before, during, and after muscimol infusion into the MnR. Data are mean ± SEM. *P < 0.05; **P < 0.01, ***P < 0.001.
Figure 7
Figure 7
Optogenetic activating the M1 excitatory neurons weakened heart function in MI mice. A) Experimental operation diagram (left), a representative image showing ChR2–mCherry expression (right top), and image of experimental timeline (right bottom). Scale bar, 500 µm. B) Colocalization of ChR2‐mCherry expression (red) and VGlut2 staining (green) (left) and the percentage of ChR2 cells expressing VGlut2 (right, n = 4). Scale bar, 50 µm. C) Representative curve graph of HR over time. D, E) Quantification of HR (Two‐way repeated‐measures ANOVA‐Interaction: F (1, 14) = 11.503, P< 0.01; mCherry off versus on, P = 0.693; ChR2 off versus on, P< 0.001; off mCherry versus ChR2, P = 0.929; on mCherry versus ChR2, P = 0.649; mCherry = 8, ChR2 = 8), LF/HF (Two‐way repeated‐measures ANOVA‐Interaction: F (1, 14) = 30.469, P<0.05, mCherry off versus on, P = 0.685; ChR2 off versus on, P < 0.001; off mCherry versus ChR2, P = 0.621; on mCherry versus ChR2, P < 0.001; mCherry = 8, ChR2 = 8). F) Examples of echocardiographic images in anesthetized mice. G, H, I, J, K, L, M,) Quantification of LVEF (Two‐way repeated‐measures ANOVA‐Interaction: F (1, 14) = 71.675, P < 0.01; mCherry off versus on, P = 0.943; ChR2 off versus on, P < 0.001; off mCherry versus ChR2, P = 0.576; on mCherry versus ChR2, P < 0.05; mCherry = 8, ChR2 = 8), LVFS (Two‐way repeated‐measures ANOVA‐Interaction: F (1, 14) = 37.954, P < 0.001; mCherry off versus on, P = 0.496; ChR2 off versus on, P < 0.001; off mCherry versus ChR2, P = 0.664; on mCherry versus ChR2, P < 0.05; mCherry = 8, ChR2 = 8), LVIDd (Two‐way repeated‐measures ANOVA‐Interaction: F (1, 14) = 0.533; mCherry off versus on, P = 1; ChR2 off versus on, P = 0.319; off mCherry versus ChR2, P = 0.447; on mCherry versus ChR2, P = 0.376; mCherry = 8, ChR2 = 8), LVIDs (Two‐way repeated‐measures ANOVA‐Interaction: F (1, 14) = 5.316, P < 0.05; mCherry off versus on, P = 0.898; ChR2 off versus on, P < 0.01; off mCherry versus ChR2, P = 0.565; on mCherry versus ChR2, P = 0.261; mCherry = 8, ChR2 = 8), SBP (Two‐way repeated‐measures ANOVA‐Interaction: F (1, 14) = 15.154, P < 0.01; mCherry off versus on, P = 0.239; ChR2 off versus on, P < 0.001; off mCherry versus ChR2, P = 0.052; on mCherry versus ChR2, P = 0.213; mCherry = 8, ChR2 = 8), DBP (Two‐way repeated‐measures ANOVA‐Interaction: F (1, 14) = 39.035, P < 0.01; mCherry off versus on, P = 0.581; ChR2 off versus on, P < 0.001; off mCherry versus ChR2, P = 0.595; on mCherry versus ChR2, P<0.01; mCherry = 8, ChR2 = 8), MAP (Two‐way repeated‐measures ANOVA‐Interaction: F (1, 14) = 19.982, P < 0.01; mCherry off versus on, P = 0.066; ChR2 off versus on, P < 0.001; off mCherry versus ChR2, P = 0.591; on mCherry versus ChR2, P<0.05; mCherry = 8, ChR2 = 8) in anesthetized mice. N). Immunohistochemical images showing overlap of ChR2‐mCherry (red) and c‐Fos (green)‐positive neurons in the M1. Scale bar, 100 µm. O) Quantification of c‐Fos‐positive cells in the M1 (Independent t test. t (4) = −9.282, P< 0.01). Data are mean ± SEM. *P < 0.05; **P < 0.01, ***P < 0.001.
Figure 8
Figure 8
Ablating M1 excitatory neurons improved cardiac function in MI mice. A) Experimental schematics and timeline. B) Image showing a NeuN signals (red) in M1. Scale bar, 500 µm (left), and the number of neurons in M1 (right panel; t (4) = 16.102, P< 0.001 by independent t‐tests; MI+Dio = 3, MI+taCasp3 = 3). Scale bar = 200 µm. C) The content of serum NE t (10) = 2.812, P < 0.01 by independent t‐tests; MI+Dio = 6, MI+taCasp3 = 6. D) The NE content of left ventricular myocardium (t (10) = 4.381, P < 0.01 by independent t‐tests; MI+Dio = 6, MI+taCasp3 = 6). E) Expression of cardiac protein in the marginal zone of left ventricular infarction (Collagen‐1 protein levels of heart: t (4) = 3.421, P< 0.05 by independent t‐tests; MI+Dio = 3, MI+taCasp3 = 3. Collagen‐3 protein levels of heart: t (4) = 7.021, P< 0.01 by independent t‐tests; MI+Dio = 3, MI+taCasp3 = 3. TH protein levels of heart: t (4) = 3.403, P< 0.05 by independent t‐tests; MI+Dio = 3, MI+taCasp3 = 3). F) Examples of echocardiographic images in anesthetized mice. G, H, I, J, K, L) Quantification of HR (t (12) = −1.385, P = 0.196 by independent t‐tests; MI+Dio = 6, MI+taCasp3 = 6), LVEF (t(10) = −2.737, P< 0.05 by independent t‐tests; MI+Dio = 6, MI+taCasp3 = 6), LVFS (t(10) = −2.264, P< 0.05 by independent t‐tests; MI+Dio = 6, MI+taCasp3 = 6), LVIDd (t(10) = 3.03, P<0.05 by independent t‐tests; MI+Dio = 6, MI+taCasp3 = 6), LVIDs (t(10) = 3.126, P< 0.05 by independent t‐tests; MI+Dio = 6, MI+taCasp3 = 6), LF/HF (t (10) = 5.116, P< 0.001 by independent t‐tests; MI+Dio = 6, MI+taCasp3 = 6) in anesthetized mice. M, N, O) SBP (t (10) = −3.372, P< 0.01 by independent t‐tests; MI+Dio = 6, MI+taCasp3 = 6), DBP (t (10) = −2.330, P< 0.05 by independent t‐tests; MI+Dio = 6, MI+taCasp3 = 6) and MAP (t (10) = −2.731, P< 0.05 by independent t‐tests; MI+Dio = 6, MI+taCasp3 = 6) in conscious mice. Data are mean ± SEM. *P < 0.05; **P < 0.01, ***P < 0.001.
Figure 9
Figure 9
MnR neurons were downstream of the M1 to affect cardiac function in MI mice. A) Experimental schematics (left), a representative image shows ChR2‐mCherry expression in the MnR and optic fiber implantation above the MnR (right top) and image of experimental timeline (right bottom). Scale bar, 100 µm. B) Representative curve graph of HR over time. C, D) Quantification of HR (t (6) = −3.622, P< 0.05 by paired t test; n = 7), LF/HF (t (6) = −7.310, P< 0.001 by paired t test; n = 7). E) Examples of echocardiographic images in anesthetized mice. F, G, H, I, J, K, L) Quantification of LVEF (t (6) = 3.078, P< 0.05 by paired t test; n = 7), LVFS (t (6) = 4.335, P< 0.001 by paired t test; n = 7), LVIDd(t (6) = 0.460, P = 0.662 by paired t test; n = 7), LVIDs (t (6) = −0.735, P = 0.480 by paired t test; n = 7), SBP (t (6) = −2.806, P< 0.05 by paired t test; n = 7), DBP (t (6) = 5.499, P< 0.01 by paired t test; n = 7), MAP (t (6) = 5.029, P< 0.01 by paired t test; n = 7) in anesthetized mice with MI. M) Schematic of experimental and combined optogenetic and pharmacology (left), a representative image showing the location of injector and fiber tip in the MnR (right top), and image of experimental timeline (right bottom). Scale bar, 100 µm. N) Examples of echocardiographic images in anesthetized mice with MI. O, P, Q, R, S, T, V, U, W) Quantification of LVEF (Saline: t (3) = 3.871, P < 0.05 by paired t test; muscimol: t (3) = −0.421, P = 0.702 by paired t test; Post: t(3) = 3.997, P< 0.05 by paired t test; n = 4), HR (Saline: t (3) = −3.402, P< 0.05 by paired t test; muscimol: t (3) = 0, P = 1 by paired t test; Post: t (3) = −3.623, P< 0.05 by paired t test; n = 4), LVFS (Saline: t (3) = 6.249, P < 0.01 by paired t test; muscimol: t (3) = 0.419, P = 0.703 by paired t test; Post: t (3) = 4.733, P< 0.05 by paired t test; n = 4), LVIDd (Saline: t (3) = −0.243, P = 0.824 by paired t test; muscimol: t (3) = 0.906, P = 0.432 by paired t test; Post: t (2) = −0.562, P = 0.613 by paired t test; n = 4); LVIDs (Paired t test. Saline: t (3) = −3.873, P < 0.05 by paired t test; muscimol: t (2) = 0.951, P = 0.412 by paired t test; Post: t (3) = −3.400, P< 0.05 by paired t test; n = 4), LF/HF (Saline: t (3) = −7.996, P < 0.01 by paired t test; muscimol: t (3) = −1.580, P = 0.212 by paired t test; Post: t (3) = −13.670, P< 0.01 by paired t test; n = 4), SBP (Saline: t (3) = −0.266, P = 0.808 by paired t test; muscimol: t (3) = 0, P = 1 by paired t test; Post: t (3) = −0.658, P = 0.557 by paired t test; n = 4), DBP (Saline: t (3) = 3.747, P < 0.05 by paired t test; muscimol: t (3) = 1.567, P = 0.215 by paired t test; Post: t (3) = 7.833, P< 0.01 by paired t test; n = 4), MAP (Saline: t (3) = 6.548, P < 0.01 by paired t test; muscimol: t (3) = 0.775, P = 0.495 by paired t test; Post: t (3) = 5.960, P< 0.01 by paired t test; n = 4) in anesthetized MI mice before, during, and after muscimol infusion into the MnR. Data are mean ± SEM. *P < 0.05; **P < 0.01, ***P < 0.001.

References

    1. a) Tahsili‐Fahadan P., Geocadin R. G., Circ. Res. 2017, 120, 559; - PubMed
    2. b) Shivkumar K., Ajijola O. A., Anand I., Armour J. A., Chen P. S., Esler M., De Ferrari G. M., Fishbein M. C., Goldberger J. J., Harper R. M., Joyner M. J., Khalsa S. S., Kumar R., Lane R., Mahajan A., Po S., Schwartz P. J., Somers V. K., Valderrabano M., Vaseghi M., Zipes D. P., J. Physiol. 2016, 594, 3911; - PMC - PubMed
    3. c) Kataoka N., Shima Y., Nakajima K., Nakamura K., Science 2020, 367, 1105; - PubMed
    4. d) Sanchez‐Larsen A., Principe A., Ley M., Navarro‐Cuartero J., Rocamora R., Ann. Neurol. 2021, 89, 1172; - PubMed
    1. a) Mohanta S. K., Yin C., Weber C., Godinho‐Silva C., Veiga‐Fernandes H., Xu Q. J., Chang R. B., Habenicht A. J. R., Circ. Res. 2023, 132, 1546; - PMC - PubMed
    2. b) Rajendran P. S., Hadaya J., Khalsa S. S., Yu C., Chang R., Shivkumar K., Semin. Cell Dev. Biol. 2024, 156, 190; - PMC - PubMed
    1. Ter Horst G. J., Postema F., Am. J. Physiol. 1997, 273, H2926,. - PubMed
    1. a) Oppenheimer S. M., Cechetto D. F., Brain Res. 1990, 533, 66; - PubMed
    2. b) Nieuwenhuys R., Prog. Brain Res. 2012, 195, 123. - PubMed
    1. Hsueh B., Chen R., Jo Y., Tang D., Raffiee M., Kim Y. S., Inoue M., Randles S., Ramakrishnan C., Patel S., Kim D. K., Liu T. X., Kim S. H., Tan L., Mortazavi L., Cordero A., Shi J., Zhao M., Ho T. T., Crow A., Yoo A. W., Raja C., Evans K., Bernstein D., Zeineh M., Goubran M., Deisseroth K., Nature 2023, 615, 292. - PMC - PubMed

LinkOut - more resources