. 2024 Mar;30(3):e14675.
doi: 10.1111/cns.14675.

Prelimbic cortical pyramidal neurons to ventral tegmental area projections promotes arousal from sevoflurane anesthesia

Affiliations

Prelimbic cortical pyramidal neurons to ventral tegmental area projections promotes arousal from sevoflurane anesthesia

Fuyang Cao et al. CNS Neurosci Ther. 2024 Mar.

Abstract

Aims: General anesthesia has been used in surgical procedures for approximately 180 years, yet the precise mechanism of anesthetic drugs remains elusive. There is significant anatomical connectivity between the ventral tegmental area (VTA) and the prelimbic cortex (PrL). Projections from VTA dopaminergic neurons (VTADA ) to the PrL play a role in the transition from sevoflurane anesthesia to arousal. It is still uncertain whether the prelimbic cortex pyramidal neuron (PrLPyr ) and its projections to VTA (PrLPyr -VTA) are involved in anesthesia-arousal regulation.

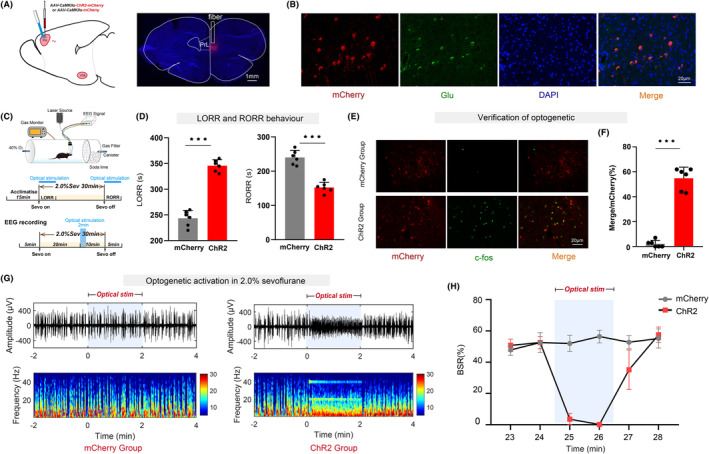
Methods: We employed chemogenetics and optogenetics to selectively manipulate neuronal activity in the PrLPyr -VTA pathway. Electroencephalography spectra and burst-suppression ratios (BSR) were used to assess the depth of anesthesia. Furthermore, the loss or recovery of the righting reflex was monitored to indicate the induction or emergence time of general anesthesia. To elucidate the receptor mechanisms in the PrLPyr -VTA projection's impact on anesthesia and arousal, we microinjected NMDA receptor antagonists (MK-801) or AMPA receptor antagonists (NBQX) into the VTA.

Results: Our findings show that chemogenetic or optogenetic activation of PrLPyr neurons prolonged anesthesia induction and promoted emergence. Additionally, chemogenetic activation of the PrLPyr -VTA neural pathway delayed anesthesia induction and promoted anesthesia emergence. Likewise, optogenetic activation of the PrLPyr -VTA projections extended the induction time and facilitated emergence from sevoflurane anesthesia. Moreover, antagonizing NMDA receptors in the VTA attenuates the delayed anesthesia induction and promotes emergence caused by activating the PrLPyr -VTA projections.

Conclusion: This study demonstrates that PrLPyr neurons and their projections to the VTA are involved in facilitating emergence from sevoflurane anesthesia, with the PrLPyr -VTA pathway exerting its effects through the activation of NMDA receptors within the VTA.

Keywords: general anesthesia; prelimbic cortex; pyramidal neuron; sevoflurane; ventral tegmental area.


Conflict of interest statement

The authors state that there are no conflicts of interest to disclose.

Figures

FIGURE 1
FIGURE 1
Chemogenetic activation of PrLPyr neurons prolongs anesthesia induction and promotes anesthesia emergence. (A) An illustration of a virus injection and a coronal brain section demonstrating virus expression in the PrL. (B) The PrL was co‐labeled with mCherry red fluorescence, Glu green immunofluorescence, and DAPI. (C) The process of detecting righting reflexes in anesthesia barrels and recording the EEG signal. (D) Representative immunofluorescent images of double staining of mCherry and c‐fos in the mCherry group and the hM3Dq group. (E) The percentage of c‐fos positive cells was significantly higher in the hM3Dq group (62 ± 11.12%) compared to the mCherry group (4.83 ± 3.656%, p < 0.001, t = 11.96, n = 6) (unpaired t‐test). (F) Compared with the mCherry group, the hM3Dq group exhibited a longer mean anesthesia induction time (p < 0.001, t = 9.15) and a shorter mean anesthesia emergence time (p < 0.001, t = 10.68, n = 6) (unpaired t‐test). (G) Two typical EEG spectra for groups of mCherry and hM3Dq. (H) Activation of PrLPyr neurons significantly decreased the BSR during anesthesia maintenance [F (10,390) = 27.47, p < 0.001, n = 6]. (I) Left, during the process of LORR, the activation of hM3Dq by CNO leads to a reduction in the proportion of power in the δ frequency range (hM3Dq vs. mCherry: 33.39 ± 3.449% vs. 42.31 ± 2.693%, p < 0.001, t = 4.99, n = 6) while increasing it in the α (hM3Dq vs. mCherry: 10.06 ± 1.084% vs. 7.40 ± 0.617%, p < 0.001, t = 5.24, n = 6) and β (hM3Dq vs. mCherry: 14.87 ± 2.575% vs. 10.47 + 1.130%, p = 0.0033, t ratio = 3.84, n = 6) frequency ranges; Right, during the process of RORR, the activation of hM3Dq by CNO leads to a reduction in the proportion of power in the δ frequency range (hM3Dq vs. mCherry: 27.04 ± 3.189% vs. 40.34 ± 5.818%, p < 0.001, t ratio = 4.91, n = 6) while increasing it in the α (hM3Dq vs. mCherry: 13.27 ± 2.149% vs. 8.51 ± 1.691%, p = 0.0016, t ratio = 4.27, n = 6) and β (hM3Dq vs. mCherry: 17.72 ± 1.248% vs. 11.55 ± 2.424% p < 0.001, t ratio = 5.54, n = 6) frequency ranges (Multiple t‐test). Data are the mean ± SD (*p < 0.05, **p < 0.01, and ***p < 0.001).
FIGURE 2
FIGURE 2
Optogenetic activation of PrLPyr neurons delays anesthesia induction and promotes anesthesia emergence. (A) Illustration of virus injection and a coronal brain section illustrating virus expression in the PrL. (B) The PrL was co‐labeled with mCherry red fluorescence, Glu green immunofluorescence, and DAPI. (C) The process of detecting righting reflexes in anesthesia barrels and recording the EEG signal. (D) Compared with the mCherry group, the ChR2 group exhibited a longer mean anesthesia induction time (p < 0.001, t = 13.04) and a shorter mean anesthesia emergence time (p < 0.001, t = 8.29, n = 6) (unpaired t‐test). (E) Representative immunofluorescent images of double staining of mCherry and c‐fos in the mCherry group and the ChR2 group. (F) The percentage of c‐fos positive cells was significantly increased in the ChR2 group (54.83 ± 8.909%), compared to the mCherry group (2.17 ± 2.787%, p < 0.001, t = 13.82, n = 6) (unpaired t‐test). (G) Two typical EEG spectra for groups of mCherry and ChR2. (H) Activation of PrLPyr neurons by optogenetic technique (continuous photo stimulation for 2 min) significantly decreased the BSR during anesthesia maintenance in the 25th minute (ChR2 vs. mCherry: 2.62 ± 1.521% vs. 52.01 ± 5.102%) and in the 26th minute (ChR2 vs. mCherry: 0.22 ± 0.415% vs. 56.42 ± 4.106%) ((F5,60) = 101.5, p < 0.001, n = 6). Data are the mean ± SD; (*p < 0.05, **p < 0.01, and ***p < 0.001).
FIGURE 3
FIGURE 3
Chemogenetic activation of the PrLPyr‐VTA neural pathway delays anesthesia induction and promotes anesthesia emergence. (A) Illustration of virus injection and a coronal brain section illustrating virus expression in the PrL. (B) The process of detecting righting reflexes in anesthesia barrels and recording the EEG signal. (C) The PrL was co‐labeled with mCherry red fluorescence, Glu green immunofluorescence, and DAPI. (D) Representative immunofluorescent images of double staining of mCherry and c‐fos in the mCherry group and hM3Dq group. (E) The percentage of c‐fos‐positive cells was significantly increased in the hM3Dq group (65.58 ± 7.902%), compared to the mCherry group (3.00 ± 4.00%, p < 0.001, t = 17.31, n = 6) (unpaired t‐test). (F) Compared with the mCherry group, the hM3Dq group exhibited a longer mean anesthesia induction time (p < 0.001, t = 5.32) and a shorter mean anesthesia emergence time (p = 0.0012, t = 4.48 n = 6) (unpaired t‐test). (G) Two typical EEG spectra for the mCherry and hM3Dq groups. (H) Activation of PrLPyr‐VTA neurons significantly decreased the BSR during anesthesia maintenance [F (10,390) = 35.47, p < 0.001, n = 6]. (I) Left, during the process of LORR, the activation of hM3Dq by CNO leads to a reduction in the proportion of power in the δ frequency range (hM3Dq vs. mCherry: 31.35 ± 2.185% vs. 38.57 ± 2.455%, p < 0.001, t ratio = 5.38, n = 6) while increasing it in the α (hM3Dq vs. mCherry: 10.55 ± 1.242% vs. 7.57 ± 0.687%, p < 0.001, t ratio = 5.13, n = 6) and β (hM3Dq vs. mCherry: 15.20 ± 1.963 vs. 11.21 ± 1.038%, p = 0.0013, t ratio = 4.40, n = 6) frequency ranges; Right, during the process of RORR, the activation of hM3Dq by CNO leads to a reduction in the proportion of power in the δ frequency range (hM3Dq vs. mCherry: 30.37 ± 2.408% vs. 38.51 ± 2.090%, p < 0.001, t ratio = 6.25 n = 6) while increasing it in the β (hM3Dq vs. mCherry: 15.41 ± 1.693% vs. 12.16 + 0.713%, p = 0.0015, t ratio = 4.33, n = 6) frequency ranges (Multiple t‐test). Data are the mean ± SD; (*p < 0.05, **p < 0.01, and ***p < 0.001).
FIGURE 4
FIGURE 4
Optogenetic activation of the PrLPyr‐VTA neural pathway delays anesthesia induction and promotes anesthesia emergence. (A) The schematic depicts the injection of a virus into the PrL region while an optical fiber is implanted in the VTA area. (B) The process of detecting righting reflexes in anesthesia barrels and recording the EEG signal. (C) Representative brain slice with VTA optical fiber implantation. (D) Compared with the mCherry group, the ChR2 group exhibited a longer mean anesthesia induction time (p = 0.0096, t = 3.19) and a shorter mean anesthesia emergence time (p = 0.0043, t = 3.68, n = 6) (unpaired t‐test). (E) Representative immunofluorescent images of double staining of TH and c‐fos in the mCherry and ChR2 groups. (F) The percentage of c‐fos‐positive cells was significantly increased in the ChR2 group (33.0 ± 3.367%), compared to the mCherry group (0.83 ± 1.329%, p < 0.001, t = 9.43, n = 6) (unpaired t‐test). (G) Two typical EEG spectra for the mCherry and ChR2 groups. (H) Activation of PrLPyr‐VTA neuronal pathway by optogenetic technique (continuous photo stimulation for 2 min) significantly decreased the BSR during anesthesia maintenance in the 25th minute (ChR2 vs. mCherry:7.61 ± 4.313% vs. 50.80 ± 5.513%) and in the 26th minute (ChR2 vs. mCherry: 6.02 ± 3.214% vs. 51.0 ± 6.243%) ((F5, 60) = 30.22, p < 0.001, n = 6). Data are the mean ± SD (*p < 0.05, **p < 0.01, and ***p < 0.001).
FIGURE 5
FIGURE 5
Chemogenetic inhibition of the PrLPyr‐VTA neural pathway promotes anesthesia induction and delays anesthesia emergence. (A) Illustration of virus injection and a coronal brain section illustrating virus expression in the PrL. (B) The process of detecting righting reflexes in anesthesia barrels and recording the EEG signal. (C) Compared to the mCherry group, the hM4Di group exhibited a shorter mean anesthesia induction time (p < 0.001, t = 6.43) and a longer mean anesthesia emergence time (p = 0.0018, t = 4.199, n = 6) (unpaired t‐test). (D) Two typical EEG spectra for the mCherry and hM4Di groups. (E) Inhibition of PrLPyr‐VTA neurons significantly increased the BSR during anesthesia maintenance [F (10,390) = 2.372, p < 0.001, n = 6]. (F) Left, During the process of LORR, inhibition of hM4Di by CNO led to an increase in the proportion of power in the δ frequency range (hM4Di vs. mCherry: 48.47 ± 3.217% vs. 39.65 ± 4.502%, p = 0.0029, t ratio = 3.90, n = 6) while decreasing it in the β (hM4Di vs. mCherry: 9.57 ± 1.265% vs. 12.91 ± 2.611%, p = 0.0182, t ratio = 2.818, n = 6) and γ (hM4Di vs. mCherry: 8.66 ± 2.229 vs. 14.39 ± 1.720%, p < 0.001, t ratio = 4.99, n = 6) frequency ranges; Right, During the process of RORR, inhibition of hM4Di by CNO led to an increase in the proportion of power in the δ frequency range (hM4Di vs. mCherry: 45.54 ± 2.304% vs. 36.88 ± 3.298%, p < 0.001, t ratio = 5.27 n = 6) while decreasing it in the β (hM4Di vs. mCherry: 9.91 ± 1.834% vs. 13.03 ± 1.337%, p = 0.0072, t ratio = 3.37, n = 6) and γ frequency ranges (hM4Di vs. mCherry: 9.82 ± 1.676% vs. 12.72 ± 1.554%, p = 0.0111, t ratio = 3.11, n = 6) (Multiple t‐test). Data are the mean ± SD (*p < 0.05, **p < 0.01, and ***p < 0.001).
FIGURE 6
FIGURE 6
The PrLPyr‐VTA neural pathway exerts its effect mainly through NMDA receptors in VTA. (A) Schematic illustration of virus injection in the PrL and VTA regions, where the microinjection cannulas were implanted in the VTA region. (B) Left, righting reflex detection; right, the process of detecting anesthesia induction and emergence times through chemogenomic activation of the PrLPyr‐VTA neurons and blocking of NMDA/AMPA receptors in 2.0% sevoflurane anesthesia. (C) Representative brain slice with VTA microinjection cannula implantation. (D) Left, the mean anesthesia induction time is longer in the hM3Dq + DMSO group compared to mCherry+DMSO group (p < 0.001, n = 8), and the induction time is shorter in the hM3Dq + MK‐801 group compared to the hM3Dq + DMSO group (p = 0.012, n = 8) (F (3, 28) = 14.66); Right, the emergence time is shorter in the hM3Dq + DMSO group compared to the mCherry + DMSO group (p < 0.001, n = 8), and the emergence time is longer in the hM3Dq + MK‐801 group compared to the hM3Dq + DMSO group (p = 0.014, n = 8) (F (3, 20) = 8.373). Data are the mean ± SD; (*p < 0.05, **p < 0.01, and ### p < 0.001).

References

    1. Brown EN, Purdon PL, Van Dort CJ. General anesthesia and altered states of arousal: a systems neuroscience analysis. Annu Rev Neurosci. 2011;34:601‐628. doi:10.1146/annurev-neuro-060909-153200 - DOI - PMC - PubMed
    1. Mashour GA, Hudetz AG. Neural correlates of unconsciousness in large‐scale brain networks. Trends Neurosci. 2018;41(3):150‐160. doi:10.1016/j.tins.2018.01.003 - DOI - PMC - PubMed
    1. Pal D, Dean JG, Liu T, et al. Differential role of prefrontal and parietal cortices in controlling level of consciousness. Curr Biol. 2018;28(13):2145‐2152. doi:10.1016/j.cub.2018.05.025 - DOI - PMC - PubMed
    1. Franks NP. General anaesthesia: from molecular targets to neuronal pathways of sleep and arousal. Nat Rev Neurosci. 2008;9(5):370‐386. doi:10.1038/nrn2372 - DOI - PubMed
    1. Gili T, Saxena N, Diukova A, Murphy K, Hall JE, Wise RG. The thalamus and brainstem act as key hubs in alterations of human brain network connectivity induced by mild propofol sedation. J Neurosci. 2013;33(9):4024‐4031. doi:10.1523/JNEUROSCI.3480-12.2013 - DOI - PMC - PubMed

Publication types

MeSH terms

Substances

LinkOut - more resources