. 2024 Mar;14(3):e1623.
doi: 10.1002/ctm2.1623.

Tau induces inflammasome activation and microgliosis through acetylating NLRP3

Affiliations

Tau induces inflammasome activation and microgliosis through acetylating NLRP3

Lun Zhang et al. Clin Transl Med. 2024 Mar.

Abstract

Background: Alzheimer's disease (AD) and related Tauopathies are characterised by the pathologically hyperphosphorylated and aggregated microtubule-associated protein Tau, which is accompanied by neuroinflammation mediated by activated microglia. However, the role of Tau pathology in microglia activation or their causal relationship remains largely elusive.

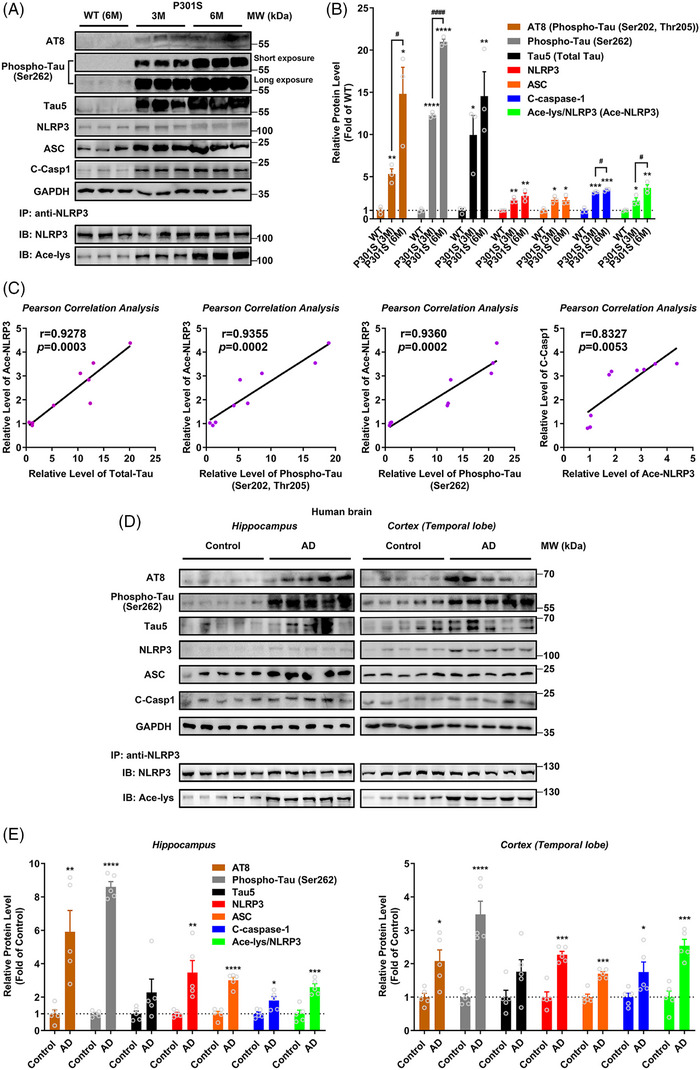
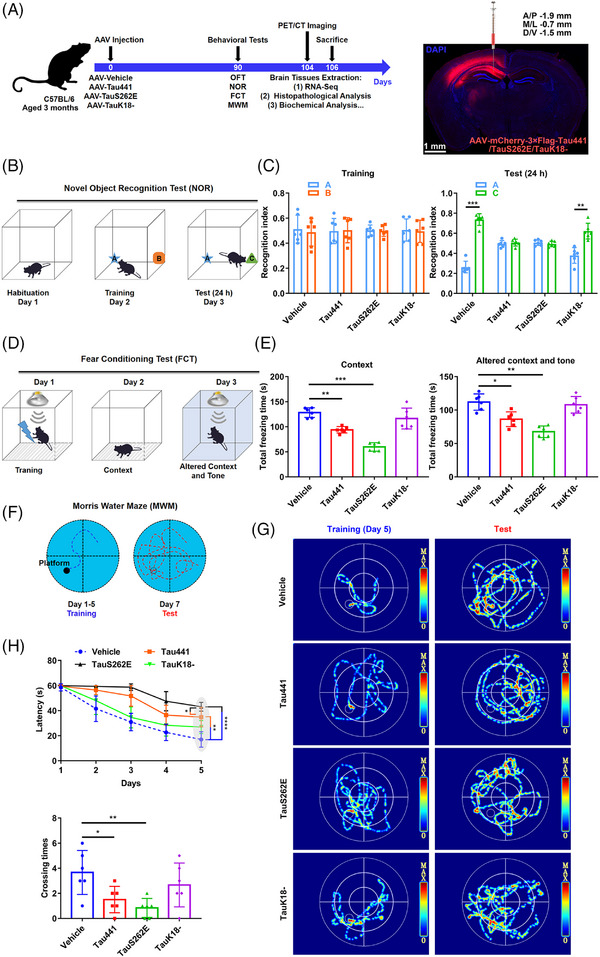
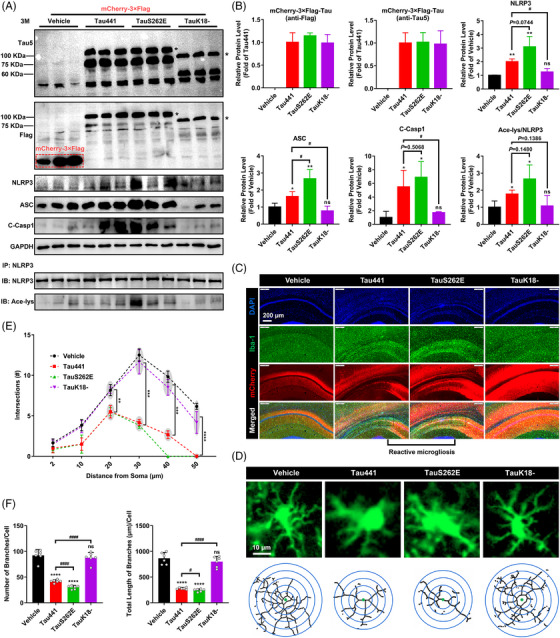
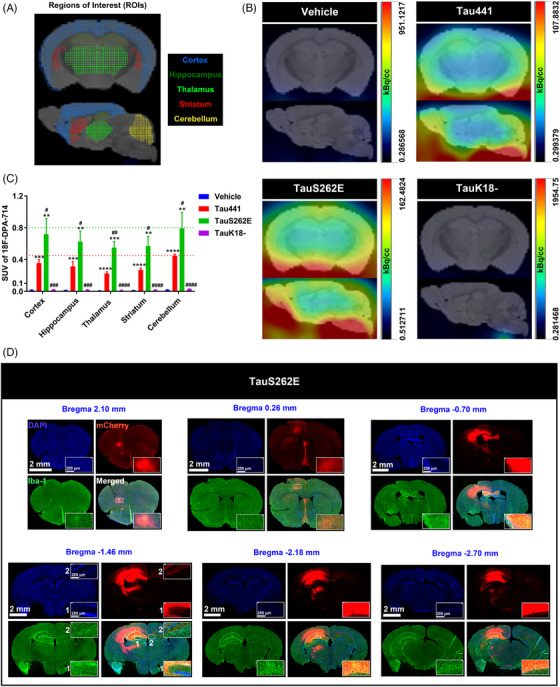
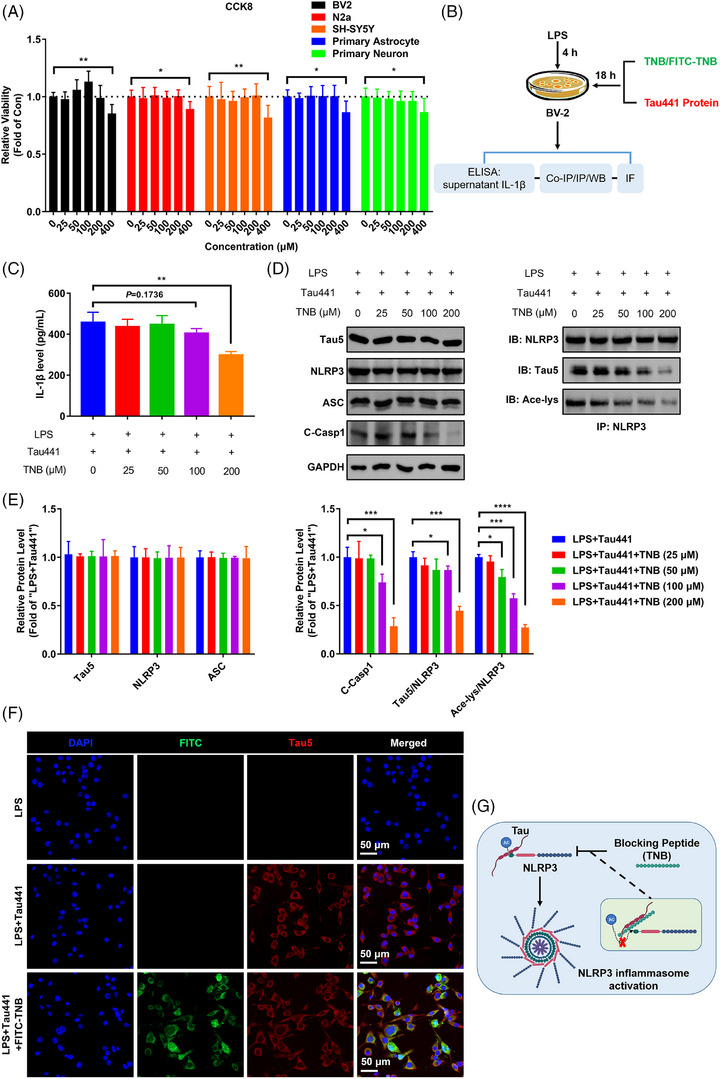
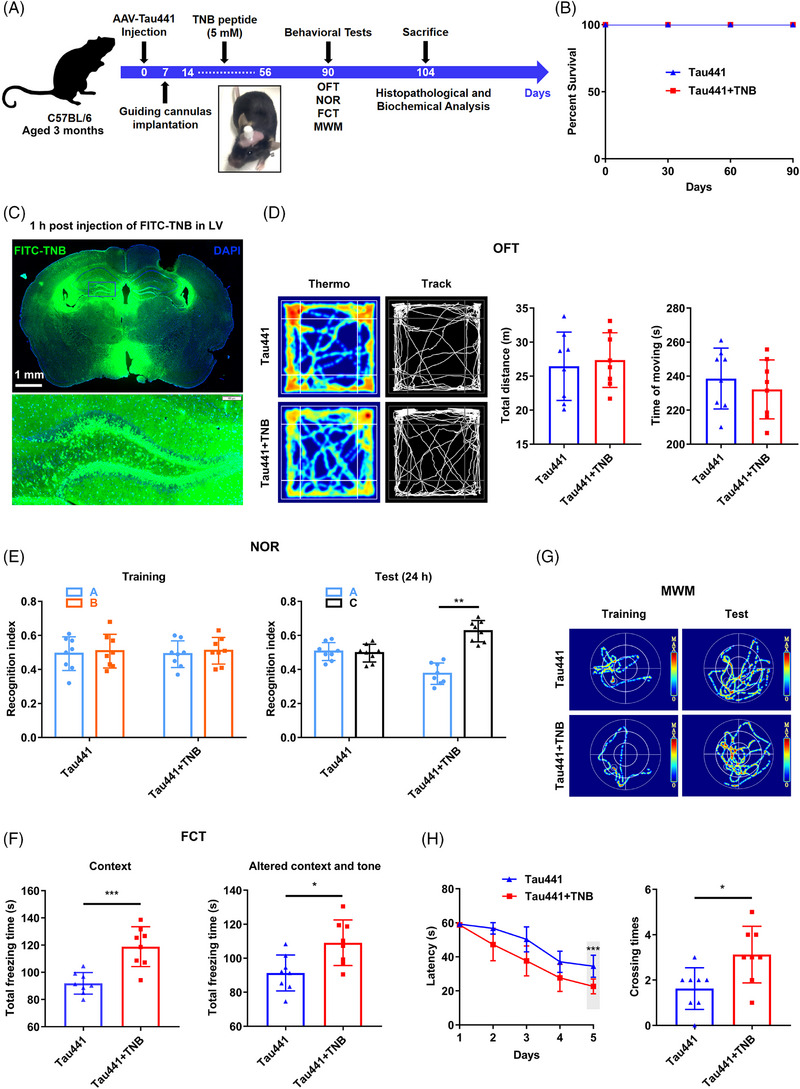
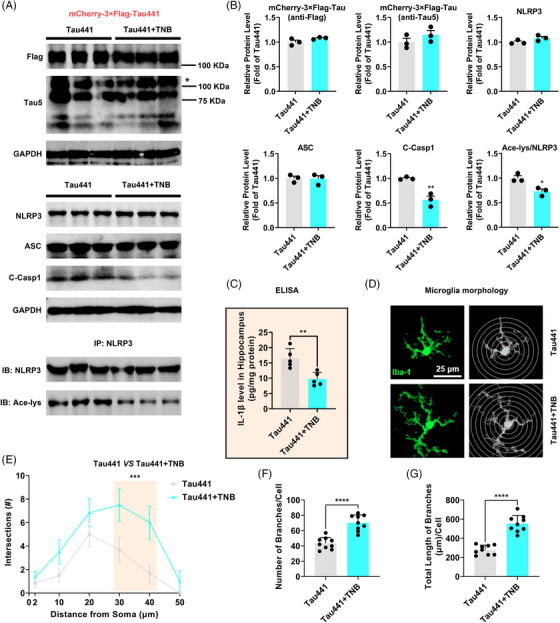
Methods: The levels of nucleotide-binding oligomerisation domain (NOD)-like receptor pyrin domain containing 3 (NLRP3) acetylation and inflammasome activation in multiple cell models with Tau proteins treatment, transgenic mice with Tauopathy, and AD patients were measured by Western blotting and enzyme-linked immunosorbent assay. In addition, the acetyltransferase activity of Tau and NLRP3 acetylation sites were confirmed using the test-tube acetylation assay, co-immunoprecipitation, immunofluorescence (IF) staining, mass spectrometry and molecular docking. The Tau-overexpressing mouse model was established by overexpression of human Tau proteins in mouse hippocampal CA1 neurons through the adeno-associated virus injection. The cognitive functions of Tau-overexpressing mice were assessed in various behavioural tests, and microglia activation was analysed by Iba-1 IF staining and [18F]-DPA-714 positron emission tomography/computed tomography imaging. A peptide that blocks the interaction between Tau and NLRP3 was synthesised to determine the in vitro and in vivo effects of Tau-NLRP3 interaction blockade on NLRP3 acetylation, inflammasome activation, microglia activation and cognitive function.

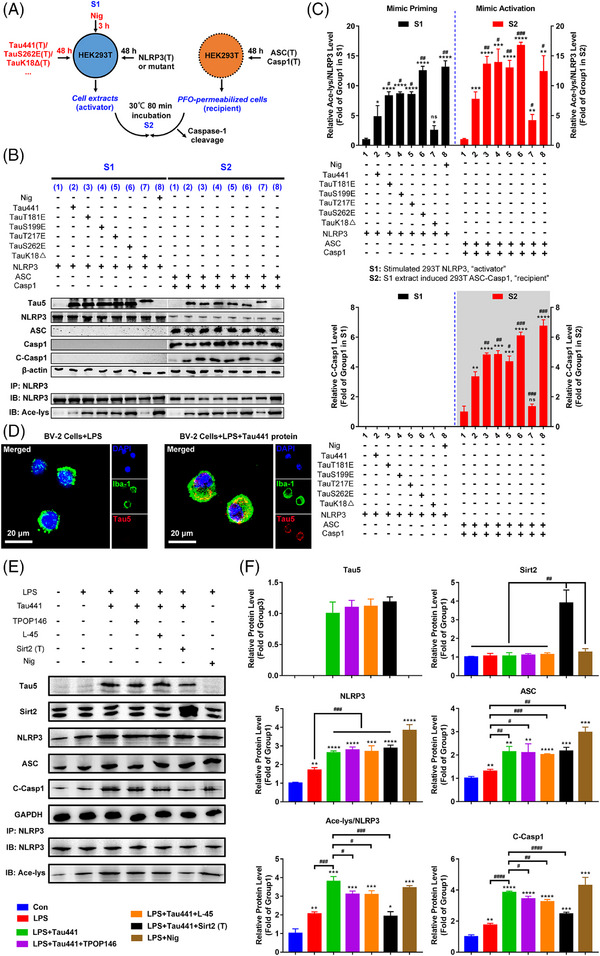
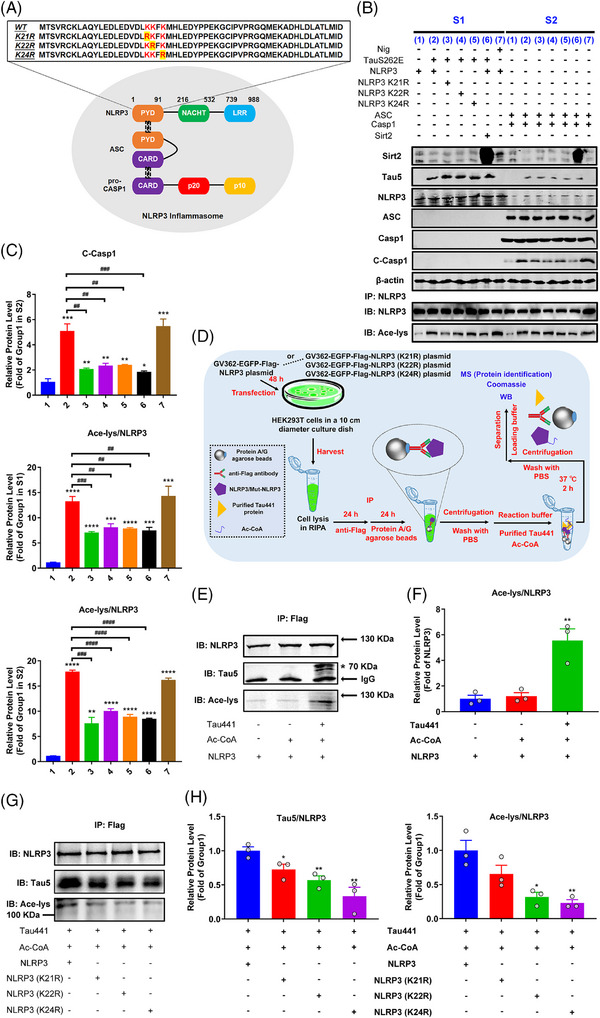
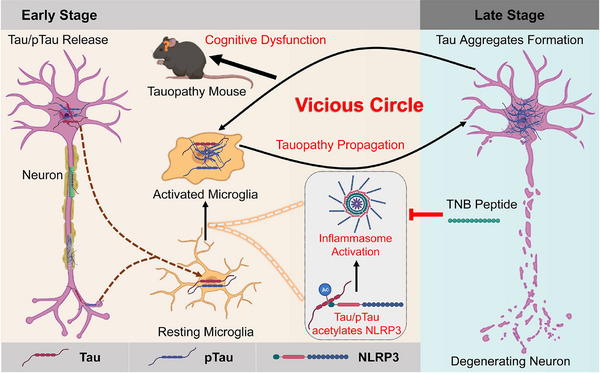
Results: Excessively elevated NLRP3 acetylation and inflammasome activation were observed in 3xTg-AD mice, microtubule-associated protein Tau P301S (PS19) mice and AD patients. It was further confirmed that mimics of 'early' phosphorylated-Tau proteins which increase at the initial stage of diseases with Tauopathy, including TauT181E, TauS199E, TauT217E and TauS262E, significantly promoted Tau-K18 domain acetyltransferase activity-dependent NLRP3 acetylation and inflammasome activation in HEK293T and BV-2 microglial cells. In addition, Tau protein could directly acetylate NLRP3 at the K21, K22 and K24 sites at its PYD domain and thereby induce inflammasome activation in vitro. Overexpression of human Tau proteins in mouse hippocampal CA1 neurons resulted in impaired cognitive function, Tau transmission to microglia and microgliosis with NLRP3 acetylation and inflammasome activation. As a targeted intervention, competitive binding of a designed Tau-NLRP3-binding blocking (TNB) peptide to block the interaction of Tau protein with NLRP3 inhibited the NLRP3 acetylation and downstream inflammasome activation in microglia, thereby alleviating microglia activation and cognitive impairment in mice.

Conclusions: In conclusion, our findings provide evidence for a novel role of Tau in the regulation of microglia activation through acetylating NLRP3, which has potential implications for early intervention and personalised treatment of AD and related Tauopathies.

Keywords: Alzheimer's disease; NLRP3 inflammasome; Tauopathies; acetylation; microglia.


Conflict of interest statement

The authors declare they have no conflicts of interest.

Figures

FIGURE 1
FIGURE 1
Nucleotide‐binding oligomerisation domain (NOD)‐like receptor pyrin domain containing 3 (NLRP3) inflammasome is activated with increased NLRP3 acetylation in Tauopathy transgenic mice and Alzheimer's disease (AD) patients. (A) Immunoblot of phosphorylated Tau (AT8 and Phospho‐Tau at Ser262), total Tau (Tau5), NLRP3, ASC, cleaved Caspase‐1 (C‐Casp1) and GAPDH as well as acetylated NLRP3 (Ace‐NLRP3, IB: Ace‐lys/IB: NLRP3) in the hippocampus of wild‐type (WT) mice at 6 months of age and P301S mice at 3 and 6 months of age. (B) Quantification of immunoblots in (A). n = 3 mice per group. * p < .05, ** p < .01, *** p <.001, **** p < .0001 versus WT group, # p < .05, #### p < .0001. (C) Correlation analysis between total Tau and Ace‐NLRP3 (r = .9278, p = .0003), between phosphorylated Tau AT8 (Phospho‐Tau (Ser202, Thr205)) and Ace‐NLRP3 (r = .9355, p = .0002), between phosphorylated Tau (Phospho‐Tau (Ser262)) and Ace‐NLRP3 (r = .9360, p = .0002), and between Ace‐NLRP3 and C‐Casp1 (r = .8327, p = .0053) in WT/P301S mice based on the data from (A) and (B). (D) Immunoblots of the proteins same as in (A) in the hippocampus and cortex of AD patients (AD) and controls (control). (E) Quantification of immunoblots in (D). n = 5 for Control and AD group. * p < .05, ** p < .01, *** p < .001, **** p < .0001 versus control group.
FIGURE 2
FIGURE 2
Tau promotes nucleotide‐binding oligomerisation domain (NOD)‐like receptor pyrin domain containing 3 (NLRP3) acetylation and inflammasome activation, which requires K18 acetyltransferase activity‐harbouring domain. (A) Diagram of in vitro assay of NLRP3 inflammasome activation upon different Tau isoform treatment: HEK‐293T donor cells transiently expressing NLRP3 were co‐transfected with different Tau proteins (Tau441, TauT181E, TauS199E, TauT217E, TauS262E and TauK18–) for 48 h or stimulated with nigericin (Nig, 20 µM, positive control) for 3 h (S1). Cell extracts were collected and mixed with perfringolysin O (PFO)‐permeabilised HEK‐293T cells transiently expressing ASC and Caspase‐1 (recipient cells) at 30°C for 80 min. After incubation, the reaction mixture was analysed by immunoblotting for Caspase‐1 cleavage (S2). (B) Representative immunoblot of transfected Tau (Tau5), NLRP3, ASC, Caspase‐1 (Casp1), cleaved Caspase‐1 (C‐Casp1), β‐actin and acetylated NLRP3 (Ace‐NLRP3) in S1 and S2. Group 1: NLRP3 (S1)/ASC + Casp1 (S2); group 2: Tau441 + NLRP3 (S1)/ASC + Casp1 (S2); group 3: TauT181E + NLRP3 (S1)/ASC + Casp1 (S2); group 4: TauS199E + NLRP3 (S1)/ASC + Casp1 (S2); group 5: TauT217E + NLRP3 (S1)/ASC + Casp1 (S2); group 6: TauS262E + NLRP3 (S1)/ASC + Casp1 (S2); group 7: TauK18Δ + NLRP3 (S1)/ASC + Casp1 (S2); group 8: Nig + NLRP3 (S1)/ASC + Casp1 (S2). (C) Quantification of C‐Casp1 and Ace‐NLRP3 in (C). n = 3, ns represents no significant difference, * p < .05, ** p < .01, *** p < .001, **** p < .0001 versus group 1, # p < .05, ## p < .01, ### p < .001 versus group 2. (D) BV‐2 cells pretreated with 1 µg/mL LPS for 4 h (priming) were incubated with or without purified Tau441 protein (5 µM) for 18 h, representative immunofluorescence confocal images showing uptake of exogenous purified Tau441 protein into BV‐2 microglial cells. Scale bar = 20 µm. (E) BV‐2 cells pretreated with 1 µg/mL LPS for 4 h (priming) were incubated with purified Tau441 protein (5 µM) for 18 h or Nig for 3 h as positive control, and NLRP3 acetylation and inflammasome activation were detected. For confirming the key effect of Tau‐induced acetylation in NLRP3 inflammasome activation, cells were simultaneously treated with lysine acetyltransferase inhibitor TPOP146 (134 nM) or L‐45 (126 nM), or overexpressed Sirt2 to reduce the acetylation levels. Representative immunoblot of internalised Tau441 protein (Tau5), Sirt2, NLRP3, ASC, C‐Casp1, GAPDH and Ace‐NLRP3. (F) Quantification of the protein levels in (E). n = 3, * p < .05, ** p < .01, *** p < .001, **** p < .0001 versus Con group, # p < .05, ## p < .01, ### p < .001, #### p < .0001 as indicated.
FIGURE 3
FIGURE 3
K21, K22 and K24 at nucleotide‐binding oligomerisation domain (NOD)‐like receptor pyrin domain containing 3 (NLRP3)‐PYD domain are key sites for Tau‐induced NLRP3 acetylation and inflammasome activation. (A) Schematic representation of NLRP3 inflammasome and NLRP3–PYD domain including wild type (WT) and mutants (K21R, K22R and K24R). (B) HEK‐293T cells were co‐transfected with WT or mutant NLRP3 (NLRP3 K21R, NLRP3 K22R or NLRP3 K24R) and TauS262E for 48 h, with or without simultaneous overexpression of NLRP3 deacetylase Sirt2, or stimulated with nigericin (Nig, 20 µM, positive control) for 3 h (S1). Cell extracts were collected and mixed with perfringolysin O (PFO)‐permeabilised HEK‐293T cells transiently expressing ASC and Caspase‐1 at 30°C for 80 min. After incubation, the reaction mixture was analysed by immunoblotting for Caspase‐1 cleavage (S2) for evaluation of NLRP3 inflammasome activation. Representative immunoblots of Sirt2, transfected Tau (Tau5), NLRP3, ASC, Caspase‐1 (Casp1), cleaved Caspase‐1 (C‐Casp1), β‐actin and acetylated NLRP3 (Ace‐NLRP3) in S1 and S2. Group 1: NLRP3 (S1)/ASC + Casp1 (S2); group 2: TauS262E + NLRP3 (S1)/ASC + Casp1 (S2); group 3: TauS262E + NLRP3 K21R (S1)/ASC + Casp1 (S2); group 4: TauS262E + NLRP3 K22R (S1)/ASC + Casp1 (S2); group 5: TauS262E + NLRP3 K24R (S1)/ASC + Casp1 (S2); group 6: TauS262E + NLRP3 + Sirt2 (S1)/ASC + Casp1 (S2); group 7: Nig + NLRP3 (S1)/ASC + Casp1 (S2). (C) Quantification of C‐Casp1 in S2 and Ace‐NLRP3 in S1 and S2. n = 3, * p < .05, ** p < .01, *** p < .001, **** p < .0001 versus group 1, ## p < .01, ### p < .001, #### p < .0001 versus group 2. (D) Schematic diagram of detection of NLRP3 acetylation induced by purified Tau441 protein. HEK‐293T cells were transfected with GV362‐EGFP‐Flag‐NLRP3 or K21R, K22R, K24R mutant NLRP3 plasmid for 48 h, then NLRP3 was immunoprecipitated by anti‐Flag antibody, and incubated with purified Tau441 protein and acetyl coenzyme A (Ac‐CoA) in test‐tube containing reaction buffer at 37°C for 2 h. (E) The acetylation of NLRP3 and its binding with Tau441 protein were detected by immunoblotting using anti‐NLRP3, anti‐acetylated‐lysine (Ace‐lys) and anti‐Tau5 antibody. The target band is marked with ‘*’. (F) Quantification of the Ace‐NLRP3 level using the ratio of Ace‐lys to NLRP3. n = 3, ** p < .01 versus NLRP3 group. (G) The ability of Tau441 protein binding with different NLRP3 proteins (WT, K21R, K22R and K24R) and its effect on different NLRP3 acetylation were measured by immunoblotting using anti‐NLRP3, anti‐Ace‐lys and anti‐Tau5 antibody. (H) Quantification of the data from (G). The ratio of Tau5 to NLRP3 reflects the binding ability. n = 3, * p < .05, ** p < .01 versus group ‘Tau441 + Ac‐CoA + NLRP3’.
FIGURE 4
FIGURE 4
Tau overexpression in hippocampus induces cognitive impairment in C57BL/6 mice. (A) Left, animal grouping and experimental procedure. pAAV9‐hSyn‐Tau441‐mCherry‐3FLAG (Tau441 group), AAV9‐hSyn‐TauS262E‐mCherry‐3FLAG (TauS262E group), AAV9‐hSyn‐TauK18△‐mCherry‐3FLAG (TauK18– group) and control AAV (vehicle group) were injected into the left hippocampal CA1 region of 3‐month‐old C57BL/6 mice. The behaviours of the mice were evaluated by open field test (OFT), novel object recognition test (NOR), fear conditioning test (FCT) and Morris water maze test (MWM) 3 months later. Before sacrifice for brain tissue extraction, the inflammation and glucose metabolism of the brain in mice were detected via positron emission tomography/computed tomography (PET/CT) imaging. Right, the efficiency of virus infection was confirmed by fluorescence imaging. Scale bar = 1 mm. (B) The experimental design of NOR. (C) Left, recognition index for objects A and B in the acquisition trial on day 2. Right, object B was replaced by a new object C, and the recognition index for objects A and C was detected on day 3. n = 6 mice per group, ** p < .01, *** p < .001. (D) The experimental design of FCT. (E) The total freezing time (s) of the mice in the context test (left) and in the altered context and tone test (right). n = 6 mice per group, * p < .05, ** p < .01, *** p < .001. (F) The experimental design of MWM. (G) Representative searching trace of the training on day 5 and the probe trial at 48 h after training in MWM. (H) The latency of the mice to find the hidden platform during training on day 1 to day 5 (upper), and the times of the mice to cross the platform on day 7 (lower). n = 6 mice per group, * p < .05, ** p < .01, **** p < .0001 as indicated.
FIGURE 5
FIGURE 5
Tau overexpression promotes nucleotide‐binding oligomerisation domain (NOD)‐like receptor pyrin domain containing 3 (NLRP3) acetylation and inflammasome activation, and reactive microgliosis in mouse hippocampus. (A) Representative immunoblots of Tau5, Flag, GAPDH, NLRP3, ASC, cleaved Caspase‐1 (C‐Casp1) and acetylated NLRP3 (Ace‐NLRP3, IB: Ace‐lys/IB: NLRP3) in the hippocampi of the mice from the four groups. The target band is marked with ‘*’. (B) Quantification of the blots in (A). n = 3 mice per group, ns represents no significant difference, * p < .05, ** p < .01 versus vehicle group, # p < .05. (C) Representative images of Iba‐1 immunofluorescence (green, a marker of microglia) in hippocampal region with the nuclei and overexpressed Tau proteins labelled by DAPI (blue) and mCherry (red), respectively, showing the apparent reactive microgliosis. Scale bar = 200 µm. (D) Representative fluorescence and skeleton images of single microglial cell in the four groups. Scale bar = 10 µm. (E) Sholl analysis of the microglia. Data are expressed as average number of intersections at each distance from cell bodies of all analysed cells. Two cells per animal, n = 3 mice per group, ** p < .01, *** p < .001, **** p < .0001. (F) Quantification of the branch number and total branch length of microglia in the hippocampus. Each data point is an average value of each individual animal, three cells per animal, n = 6 mice per group, ns represents no significant difference, **** p < .0001 versus vehicle group, # p < .05, #### p < .0001.
FIGURE 6
FIGURE 6
Spatial characteristics of Tauopathy and its association with activation of microglia in TauS262E overexpression model. (A) Schematic diagram of mouse brain regions of interest (coronal and sagittal section: cortex, hippocampus, thalamus, striatum and cerebellum) in positron emission tomography/computed tomography (PET/CT) imaging. (B) Representative coronal and sagittal 18F‐DPA‐714 (a ligand of the 18–kDa translocator protein [TSPO] to trace the active microglia) PET/CT images of the mice from four groups (vehicle, Tau441, TauS262E and TauK18–). (C) In vivo 18F‐DPA‐714 uptake in different brain regions of the mice in four groups is presented as standard uptake values (SUVs). n = 3 mice per group, ** p < .01, *** p < .001, **** p < .0001 versus vehicle group, # p < .05, ## p < .01, ### p < .001, #### p < .0001 versus Tau441 group. (D) Representative images of Iba‐1 immunofluorescence (green, a marker of microglia) in different coronal sections of TauS262E overexpressed brain with the nuclei and overexpressed TauS262E protein labelled by DAPI (blue) and mCherry (red), respectively, displaying the spatial distribution relationship between activated microglia and TauS262E protein. Scale bar = 2 mm or 200 µm.
FIGURE 7
FIGURE 7
Tau–NLRP3‐binding blocking (TNB) peptide blocks the binding of Tau to nucleotide‐binding oligomerisation domain (NOD)‐like receptor pyrin domain containing 3 (NLRP3), prevents NLRP3 acetylation and inflammasome activation in BV‐2 cells. (A) CCK8 detection for the viability of different cells (BV‐2, N2a, SH‐SY5Y, primary astrocyte and primary neuron) after TNB peptide treatment at different dosages (0, 25, 50, 100, 200 and 400 µM) for 48 h. n = 6, * p < .05, ** p < .01 as indicated. (B) Schematic diagram of in vitro experiments for testing TNB blocking function and downstream effect. (C) Enzyme‐linked immunosorbent assay (ELISA) for detecting interleukin‐1β (IL‐1β) production of LPS and Tau441 protein challenged BV‐2 microglia with or without TNB peptide treatment at different dosages (0, 25, 50, 100 and 200 µM). n = 3, ** p < .01 as indicated. (D) The ability of TNB peptide of blocking Tau–NLRP3 binding and its effects on Tau‐induced NLRP3 acetylation and inflammasome activation were measured by immunoprecipitation and immunoblotting using anti‐Tau5, anti‐NLRP3, anti‐ASC, anti‐cleaved Caspase‐1 (C‐Casp1), anti‐GAPDH and anti‐acetylated‐lysine (Ace‐lys) antibody. (E) Quantification of the blots in (D). The ratio of Tau5 to NLRP3 stands for the Tau–NLRP3‐binding ability (immunoprecipitated Tau by anti‐NLRP3/NLRP3). The ratio of Ace‐lys to NLRP3 stands for the level of NLRP3 acetylation. n = 3, * p < .05, *** p < .001, **** p < .0001 as indicated. (F) Representative images of exogenous human Tau441 protein immunofluorescence (anti‐Tau5, red) with the nuclei and TNB peptide labelled by DAPI (blue) and FITC (green) respectively, showing the co‐localisation of TNB peptide and Tau441 protein in BV‐2 cells. Scale bar = 50 µm. (G) Mechanism diagram showing TNB peptide intercepts the binding of Tau to NLRP3, thereby inhibiting NLRP3 acetylation and preventing inflammasome activation.
FIGURE 8
FIGURE 8
Blocking Tau‐induced nucleotide‐binding oligomerisation domain (NOD)‐like receptor pyrin domain containing 3 (NLRP3) acetylation by Tau–NLRP3‐binding blocking (TNB) peptide rescues cognitive impairment in Tau‐overexpressing mice. (A) Experimental procedure: pAAV9‐hSyn‐Tau441‐mCherry‐3FLAG was injected into the left hippocampal CA1 region of 3‐month‐old C57BL/6 mice. Two weeks later, the mice were repeatedly administered with the TNB peptide (5 mM) via left lateral ventricle‐implanted guiding cannulas once every 3 days for 6 weeks. The behaviours of the mice were evaluated by open field test (OFT), novel object recognition test (NOR), fear conditioning test (FCT) and Morris water maze test (MWM) 3 months later. Then, the mice were sacrificed for brain tissue extraction and subsequent histological and biochemical analysis. (B) Survival rate of the mice, n = 8 mice per group. (C) Representative images of FITC–TNB distribution in brain 1 h post‐injection of FITC–TNB in left lateral ventricle. Scale bar = 1 mm and 100 µm. (D) Representative searching trace and the total distance (m) and total time (s) of moving in OFT of the mice in two groups. n = 8 mice per group. (E) Left, recognition index for objects A and B in the acquisition trial in NOR. Right, object B was replaced by a new object C, and the recognition index for objects A and C was calculated 24 h later. n = 8 mice per group, ** p < .01. (F) The total freezing time (s) of the mice in the context test (left) and in the altered context and tone test (right) in FCT. n = 8 mice per group, * p < .05, *** p < .001. (G) Representative searching trace in the training on day 5 and the probe trial at 48 h after training in MWM. (H) The latency of the mice to find the hidden platform during training from day 1 to day 5 (upper), and the times of the mice to cross the platform on day 7 (lower). n = 8 mice per group, * p < .05, *** p < .001.
FIGURE 9
FIGURE 9
Tau–NLRP3‐binding blocking (TNB) peptide inhibits Tau‐induced nucleotide‐binding oligomerisation domain (NOD)‐like receptor pyrin domain containing 3 (NLRP3) acetylation, inflammasome activation and microglia activation in vivo. (A) Representative immunoblots of Flag, Tau5, GAPDH, NLRP3, ASC, cleaved Caspase‐1 (C‐Casp1) and acetylated NLRP3 (Ace‐NLRP3, IB: Ace‐lys/IB: NLRP3) in the hippocampi of the mice from the two groups: Tau441 and Tau441 + TNB (Tau441 overexpression for 3 months). The target band is marked with ‘*’. (B) Quantification of the blots (A). n = 3 mice per group, * p < .05, ** p < .01 versus Tau441 group. (C) Enzyme‐linked immunosorbent assay (ELISA) detection of IL‐1β level in hippocampal tissue lysates, n = 5 (hippocampal tissue of five mice in each group), ** p < .01. (D) Representative Iba‐1 staining immunofluorescence graphs of single microglia in the hippocampus region and their corresponding skeleton images. Scale Bar = 25 µm. (E) Sholl analysis of the microglia. Data are expressed as average number of intersections at each distance from cell bodies of all analysed cells. n = 6 (three mice in each group, with two brain slices per mouse, and one representative microglia selected from each slice), *** p < .001. (F and G) Quantification of the branch number and total branch length of single microglia, n = 9 (three mice in each group, with three brain slices per mouse, and one representative microglia selected from each slice), **** < .0001.
FIGURE 10
FIGURE 10
Schematic diagram of this study. At early stage of Alzheimer's disease (AD) and related Tauopathies, Tau and initial phosphorylated‐Tau (pTau) release from neurons and are sensed by microglia. Tau/pTau directly acetylates nucleotide‐binding oligomerisation domain (NOD)‐like receptor pyrin domain containing 3 (NLRP3) and induces NLRP3 inflammasome assembly and activation in microglia, thereby causing microgliosis, neuroinflammation and aggravating cognitive dysfunction. Activated microglia continuously mediating the transmission of Tauopathy to the uninfected neurons pushes the disease towards late stage. Tau aggregates formed in the late stage as damage‐associated molecular patterns (DAMPs) further enhance the activation of microglia, which forms a vicious circle. Tau–NLRP3‐binding blocking (TNB) peptide can competitively bind with Tau and effectively inhibit NLRP3 acetylation caused by Tau, thereby preventing inflammasome activation and rescuing cognitive impairment in Tauopathy mice.

References

    1. Wang Y, Mandelkow E. Tau in physiology and pathology. Nat Rev Neurosci. 2016;17:22‐35. - PubMed
    1. Lee VM, Goedert M, Trojanowski JQ. Neurodegenerative tauopathies. Annu Rev Neurosci. 2001;24:1121‐1159. - PubMed
    1. Alonso AC, Zaidi T, Grundke‐Iqbal I, Iqbal K. Role of abnormally phosphorylated tau in the breakdown of microtubules in Alzheimer disease. Proc Natl Acad Sci U S A. 1994;91:5562‐5566. - PMC - PubMed
    1. Hoover BR, Reed MN, Su J, et al. Tau mislocalization to dendritic spines mediates synaptic dysfunction independently of neurodegeneration. Neuron. 2010;68:1067‐1081. - PMC - PubMed
    1. Brundin P, Melki R, Kopito R. Prion‐like transmission of protein aggregates in neurodegenerative diseases. Nat Rev Mol Cell Biol. 2010;11:301‐307. - PMC - PubMed

Publication types