

Association of DNA methylation/demethylation with the functional outcome of stroke in a hyperinflammatory state
- PMID: 38488557
- PMCID: PMC11034580
- DOI: 10.4103/1673-5374.392890
Association of DNA methylation/demethylation with the functional outcome of stroke in a hyperinflammatory state
Abstract
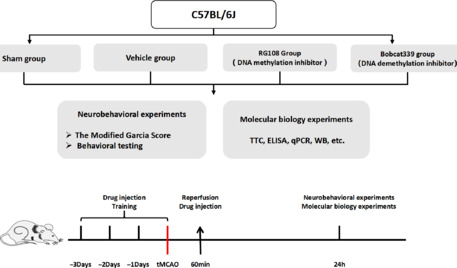
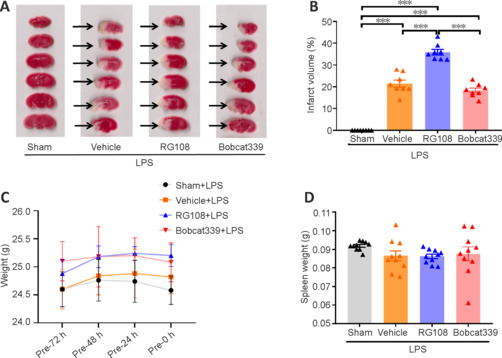
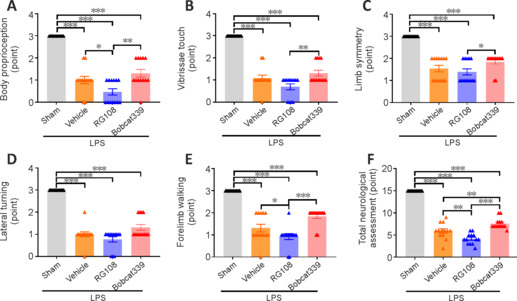
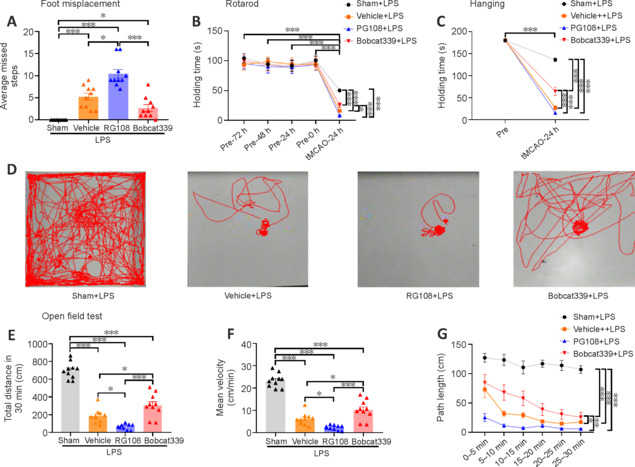
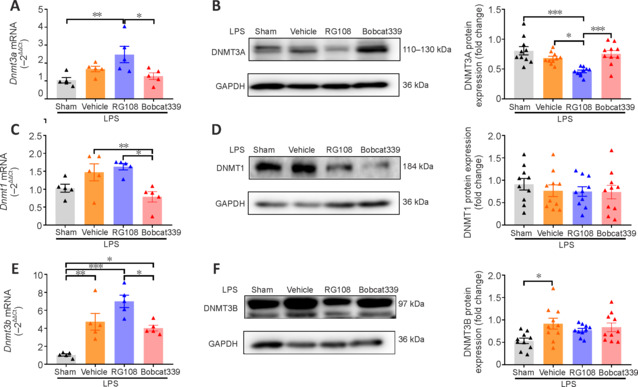
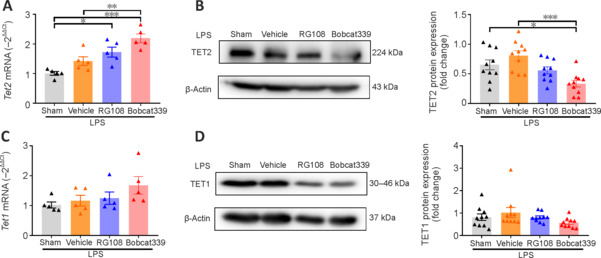
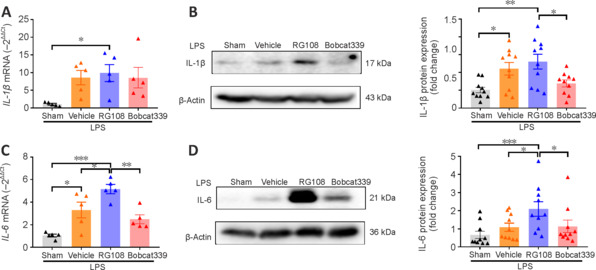
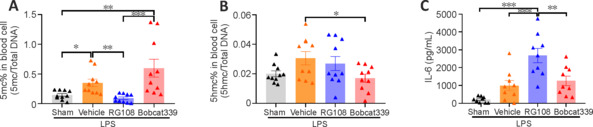
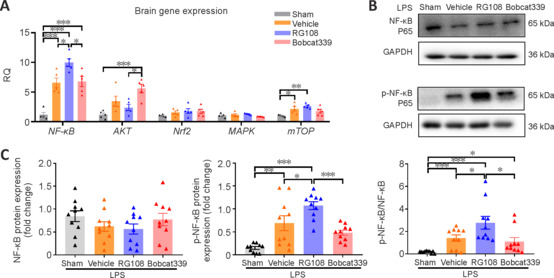
JOURNAL/nrgr/04.03/01300535-202410000-00024/figure1/v/2024-02-06T055622Z/r/image-tiff Inflammation is closely related to stroke prognosis, and high inflammation status leads to poor functional outcome in stroke. DNA methylation is involved in the pathogenesis and prognosis of stroke. However, the effect of DNA methylation on stroke at high levels of inflammation is unclear. In this study, we constructed a hyperinflammatory cerebral ischemia mouse model and investigated the effect of hypomethylation and hypermethylation on the functional outcome. We constructed a mouse model of transient middle cerebral artery occlusion and treated the mice with lipopolysaccharide to induce a hyperinflammatory state. To investigate the effect of DNA methylation on stroke, we used small molecule inhibitors to restrain the function of key DNA methylation and demethylation enzymes. 2,3,5-Triphenyltetrazolium chloride staining, neurological function scores, neurobehavioral tests, enzyme-linked immunosorbent assay, quantitative reverse transcription PCR and western blot assay were used to evaluate the effects after stroke in mice. We assessed changes in the global methylation status by measuring DNA 5-mc and DNA 5-hmc levels in peripheral blood after the use of the inhibitor. In the group treated with the DNA methylation inhibitor, brain tissue 2,3,5-triphenyltetrazolium chloride staining showed an increase in infarct volume, which was accompanied by a decrease in neurological scores and worsening of neurobehavioral performance. The levels of inflammatory factors interleukin 6 and interleukin-1 beta in ischemic brain tissue and plasma were elevated, indicating increased inflammation. Related inflammatory pathway exploration showed significant overactivation of nuclear factor kappa B. These results suggested that inhibiting DNA methylation led to poor functional outcome in mice with high inflammation following stroke. Further, the effects were reversed by inhibition of DNA demethylation. Our findings suggest that DNA methylation regulates the inflammatory response in stroke and has an important role in the functional outcome of hyperinflammatory stroke.
Copyright © 2024 Copyright: © 2024 Neural Regeneration Research.
Conflict of interest statement
Figures
Similar articles
-
Interleukin-19 alleviates brain injury by anti-inflammatory effects in a mice model of focal cerebral ischemia.Brain Res. 2016 Nov 1;1650:172-177. doi: 10.1016/j.brainres.2016.09.006. Epub 2016 Sep 5. Brain Res. 2016. PMID: 27608956
-
Electroacupuncture of scalp acupoint alleviates cerebral ischemic inflammatory injury by down-regulating RORγt and promoting balance of IL-17A+Th17/FOXP3+Treg in MCAO rats.Zhen Ci Yan Jiu. 2024 Feb 25;49(2):135-144. doi: 10.13702/j.1000-0607.20221062. Zhen Ci Yan Jiu. 2024. PMID: 38413034 Chinese, English.
-
Xueshuantong injection alleviates cerebral microcirculation disorder in middle cerebral artery occlusion/reperfusion rats by suppressing inflammation via JNK mediated JAK2/STAT3 and NF-κB signaling pathways.J Ethnopharmacol. 2022 Nov 15;298:115592. doi: 10.1016/j.jep.2022.115592. Epub 2022 Aug 3. J Ethnopharmacol. 2022. PMID: 35931304
-
Acacetin protects against cerebral ischemia-reperfusion injury via the NLRP3 signaling pathway.Neural Regen Res. 2019 Apr;14(4):605-612. doi: 10.4103/1673-5374.247465. Neural Regen Res. 2019. PMID: 30632500 Free PMC article.
-
Downregulation of Nogo-B ameliorates cerebral ischemia/reperfusion injury in mice through regulating microglia polarization via TLR4/NF-kappaB pathway.Neurochem Int. 2023 Jul;167:105553. doi: 10.1016/j.neuint.2023.105553. Epub 2023 May 23. Neurochem Int. 2023. PMID: 37230196 Review.
Cited by
-
How epigenetics impacts stroke risk and outcomes through DNA methylation: A systematic review.J Cereb Blood Flow Metab. 2025 Feb 27:271678X251322032. doi: 10.1177/0271678X251322032. Online ahead of print. J Cereb Blood Flow Metab. 2025. PMID: 40012472 Free PMC article. Review.
-
Neuroprotective potential for mitigating ischemia-reperfusion-induced damage.Neural Regen Res. 2025 Aug 1;20(8):2199-2217. doi: 10.4103/NRR.NRR-D-23-01985. Epub 2024 Jul 29. Neural Regen Res. 2025. PMID: 39104164 Free PMC article.
-
Modular assembled biomimetic nanobubbles for synergistic therapy of ischemic stroke via cascade modulation thrombo-inflammatory network.Bioact Mater. 2025 Jul 1;52:753-772. doi: 10.1016/j.bioactmat.2025.06.054. eCollection 2025 Oct. Bioact Mater. 2025. PMID: 40688064 Free PMC article.
-
From genes to epigenes: DNA methylation in the pathogenesis of Moyamoya disease.EXCLI J. 2025 Mar 10;24:430-432. doi: 10.17179/excli2025-8206. eCollection 2025. EXCLI J. 2025. PMID: 40166424 Free PMC article. No abstract available.
-
Advances in moyamoya disease: pathogenesis, diagnosis, and therapeutic interventions.MedComm (2020). 2025 Jan 14;6(2):e70054. doi: 10.1002/mco2.70054. eCollection 2025 Feb. MedComm (2020). 2025. PMID: 39822761 Free PMC article. Review.
References
-
- Boyko M, Zlotnik A, Gruenbaum BF, Gruenbaum SE, Ohayon S, Kuts R, Melamed I, Regev A, Shapira Y, Teichberg VI. Pyruvate’s blood glutamate scavenging activity contributes to the spectrum of its neuroprotective mechanisms in a rat model of stroke. Eur J Neurosci. 2011;34:1432–1441. - PubMed
-
- Chamorro Á, Dirnagl U, Urra X, Planas AM. Neuroprotection in acute stroke: targeting excitotoxicity, oxidative and nitrosative stress, and inflammation. Lancet Neurol. 2016;15:869–881. - PubMed
LinkOut - more resources
Full Text Sources
