. 2024 Jan 2:13:giae005.
doi: 10.1093/gigascience/giae005.

Data processing solutions to render metabolomics more quantitative: case studies in food and clinical metabolomics using Metabox 2.0

Affiliations

Data processing solutions to render metabolomics more quantitative: case studies in food and clinical metabolomics using Metabox 2.0

Kwanjeera Wanichthanarak et al. Gigascience. .

Abstract

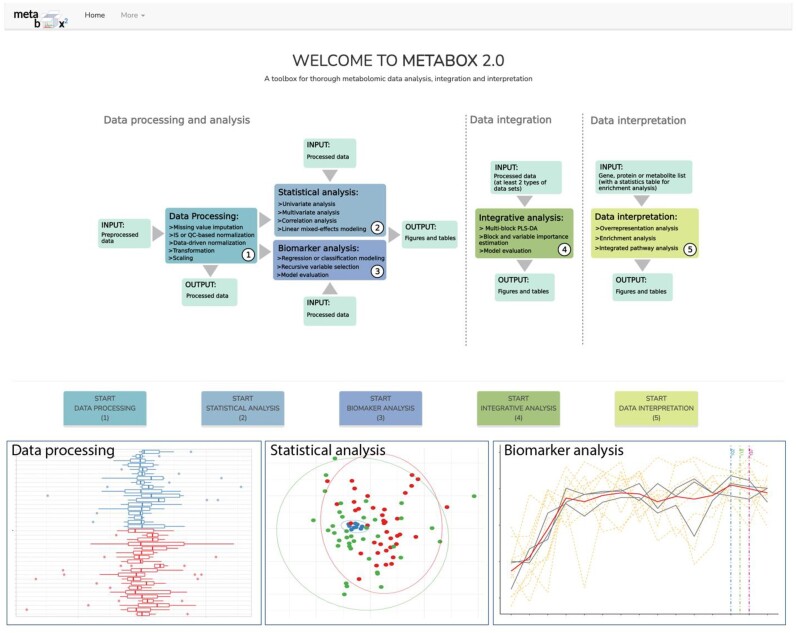
In classic semiquantitative metabolomics, metabolite intensities are affected by biological factors and other unwanted variations. A systematic evaluation of the data processing methods is crucial to identify adequate processing procedures for a given experimental setup. Current comparative studies are mostly focused on peak area data but not on absolute concentrations. In this study, we evaluated data processing methods to produce outputs that were most similar to the corresponding absolute quantified data. We examined the data distribution characteristics, fold difference patterns between 2 metabolites, and sample variance. We used 2 metabolomic datasets from a retail milk study and a lupus nephritis cohort as test cases. When studying the impact of data normalization, transformation, scaling, and combinations of these methods, we found that the cross-contribution compensating multiple standard normalization (ccmn) method, followed by square root data transformation, was most appropriate for a well-controlled study such as the milk study dataset. Regarding the lupus nephritis cohort study, only ccmn normalization could slightly improve the data quality of the noisy cohort. Since the assessment accounted for the resemblance between processed data and the corresponding absolute quantified data, our results denote a helpful guideline for processing metabolomic datasets within a similar context (food and clinical metabolomics). Finally, we introduce Metabox 2.0, which enables thorough analysis of metabolomic data, including data processing, biomarker analysis, integrative analysis, and data interpretation. It was successfully used to process and analyze the data in this study. An online web version is available at http://metsysbio.com/metabox.

Keywords: R package; data processing; metabolomics; normalization; quantitative analysis; scaling; semiquantitative analysis; transformation.


Conflict of interest statement

The authors declare that they have no competing interests.

Figures

Figure 1:
Figure 1:
Analysis workflow. Different DP schemes were performed in this study, including (A) no processing, (B) transformation, (C) scaling, (D) transformation followed by scaling, (E) normalization by ccmn, and (F) consisting of ccmn + transform, ccmn + scale, and ccmn + transform + scale. The methods of each DP scheme are listed, and the number shown represents all combinations of these methods. The DP schemes were applied to semiquantitative or peak area data (blue), and the method evaluations were then performed. This included effects on data properties and PLS-DA. For each dataset, the resulting VIPs from PLS-DA were compared to those of the quantitative data (red).
Figure 2:
Figure 2:
PCA score plots based on the data properties of absolute concentration, unprocessed (raw area), and processed milk data. (A) Major separation based on DP schemes and (B) major separation based on transformation methods. The data properties included normality, skewness, and coefficient of variation.
Figure 3:
Figure 3:
Comparisons of selected DP schemes to absolute concentration and the raw milk area data represented by (A) clustering of VIPs and (B) PCA plots.
Figure 4:
Figure 4:
Effects of the ccmn and nomis normalization methods on the (A) milk data and (B) urine data. Color coding indicates sample groups, including the types of milk, the urine samples from healthy subjects (N), and patients with lupus nephritis (LN).
Figure 5:
Figure 5:
Metabox 2.0 GUI and example outputs from the data processing, statistical analysis, and biomarker analysis modules.

Similar articles

Cited by

References

    1. Kim S, Kim J, Yun EJ, et al. Food metabolomics: from farm to human. Curr Opin Biotechnol. 2016;37:16–23. 10.1016/j.copbio.2015.09.004. - DOI - PubMed
    1. Khoomrung S, Wanichthanarak K, Nookaew I, et al. Metabolomics and integrative omics for the development of Thai traditional medicine. Front Pharmacol. 2017;8:474. 10.3389/fphar.2017.00474. - DOI - PMC - PubMed
    1. Wishart DS. Metabolomics for investigating physiological and pathophysiological processes. Physiol Rev. 2019;99(4):1819–75. 10.1152/physrev.00035.2018. - DOI - PubMed
    1. Tebani A, Afonso C, Bekri S. Advances in metabolome information retrieval: turning chemistry into biology. Part I: analytical chemistry of the metabolome. J Inher Metab Dis. 2018;41(3):379–91. 10.1007/s10545-017-0074-y. - DOI - PMC - PubMed
    1. Noack S, Wiechert W. Quantitative metabolomics: a phantom?. Trends Biotechnol. 2014;32(5):238–44. 10.1016/j.tibtech.2014.03.006. - DOI - PubMed

Publication types