. 2024 Mar;532(3):e25599.
doi: 10.1002/cne.25599.

Illuminating the terminal nerve: Uncovering the link between GnRH-1 neuron and olfactory development

Affiliations

Illuminating the terminal nerve: Uncovering the link between GnRH-1 neuron and olfactory development

Enrico Amato Jr et al. J Comp Neurol. 2024 Mar.

Abstract

During embryonic development, the olfactory placode (OP) generates migratory neurons, including olfactory pioneer neurons, cells of the terminal nerve (TN), gonadotropin-releasing hormone-1 (GnRH-1) neurons, and other uncharacterized neurons. Pioneer neurons from the OP induce olfactory bulb (OB) morphogenesis. In mice, GnRH-1 neurons appear in the olfactory system around mid-gestation and migrate via the TN axons to different brain regions. The GnRH-1 neurons are crucial in controlling the hypothalamic-pituitary-gonadal axis. Kallmann syndrome is characterized by impaired olfactory system development, defective OBs, secretion of GnRH-1, and infertility. The precise mechanistic link between the olfactory system and GnRH-1 development remains unclear. Studies in humans and mice highlight the importance of the prokineticin-2/prokineticin-receptor-2 (Prokr2) signaling pathway in OB morphogenesis and GnRH-1 neuronal migration. Prokr2 loss-of-function mutations can cause Kallmann syndrome (KS), and hence the Prokr2 signaling pathway represents a unique model to decipher the olfactory/GnRH-1 connection. We discovered that Prokr2 is expressed in the TN neurons during the critical period of GnRH-1 neuron formation, migration, and induction of OB morphogenesis. Single-cell RNA sequencing identified that the TN is formed by neurons distinct from the olfactory neurons. The TN neurons express multiple genes associated with KS. Our study suggests that the aberrant development of pioneer/TN neurons might cause the KS spectrum.

Keywords: GnRH neurons; Kallmann syndrome; migratory mass; olfactory bulb; pioneer neurons; prokineticin receptor-2; terminal nerve.


Conflict of interest statement

Competing Interests: All authors declare no conflicts of interest.

Figures

Figure 1.
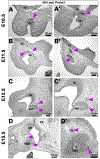
Figure 1.. Prokr2 mRNA detected in cells of the migratory mass.
A-A’) In situ hybridization at E10.5, coronal section, highlights Prokr2 mRNA expression within cells (Arrowheads) near the olfactory placode (OP) and proximal to the forebrain (FB). B-B’) Prokr2 expressing cells at E11.5 (parasagittal) were found in the olfactory epithelium (OE) and proximal to the FB. C-C’) At E12.5 (parasagittal) Prokr2 is expressed in cells in and migrating out from the developing vomeronasal (VNO). D-D’) At E15.5, Prokr2 expression was detected in cells within the ventral portion of the developing vomeronasal organ and in clusters of cells outside of the VNO. Scale bars in A-A’, B-B’, C, D’, 100 μm; C’, 50 μm; D, 250 μm.
Figure 2.
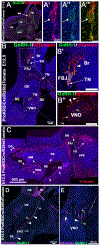
Figure 2.. Prokr2 tracing highlights TN/pioneer neurons.
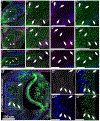
A-A”’) Immunofluorescent staining of HuCD (green) reveals a migratory mass (MM) (arrows) of Prokr2 traced neurons (red) at E11.5. These neurons could be the putative terminal nerve or pioneer neurons of the olfactory bulb. A’-A”’ show a magnification of the boxed area. B-B”) At E12.5, GnRH-1 neurons (green) negative for Prokr2 tracing (arrows) can be seen migrating along terminal nerve (TN) axons traced for Prokr2 into the brain (Br). B’ is a magnification of the area within the white box, and B” is a magnification of the boxed area within the grey box. B”) Prokr2 traced neurons (white arrows) and GnRH-1 neurons (grey arrows) can be seen within and leaving the vomeronasal organ (VNO). C) Arrows indicate Prokr2 traced cells in Grueneberg ganglion (GG), respiratory epithelium (RE), migratory mass (MM), vomeronasal organ (VNO), olfactory epithelium (OE), forebrain junction (FBJ) at E13.5. Traced TN projections access the brain ventral to the olfactory bulb (OB), reaching the basal forebrain (BFB). D-E) At E1.5 the GnRH-1 neurons (green, grey arrows) can be seen migrating along the axons of the traced neurons (magenta, white arrows) projecting from the nose to the brain. Scale bars in A’-A”’ 50 μm; A, B-B’, D, E 100 μm; C, 500 μm.
Figure 3.
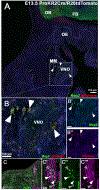
Figure 3.. Prokr2 traced neurons express Map2 and are positive for cCasp3.
A-B”) Double immunostaining of Map2 (green) with Prokr2 tracing (red) at E13.5 shows that both Prokr2 traced neurons, positive for Map2 expression (white arrows), within the VNO (traced with dotted lines) and migrating out of the VNO. B-B” show magnifcations of the boxed area in A. Map2 immunolabelling was found in neurons of the migratory mass (MM) and in neurons of the olfactory bulb (OB) and forebrain (FB) Arrowheads indicate co-expression of Map2 and Prokr2 traced neurons. C-C”’) Immunostaining for Cleaved Caspase 3 (green) on Prokr2 traced (magenta) animals at E13.5 reveals that many apoptotic cells are in the forebrain junction (FBJ), including Prokr2 traced- cells (grey arrows) and Prokr2 traced+ cells (white arrows). C’-C”’ are magnifications of the boxed area in C. Scale bars in A-A’, B-B”, C, 100 μm; C’-C”’, 50 μm.
Figure 4.
Figure 4.. Single cell RNA-sequencing of embryonic noses.
A) UMAP showing cell clusters isolated from E14.5 embryonic noses. A large cluster of cells were identified as mesenchyme, while a smaller, separate cluster was identified to belong to the olfactory pit, both neurogenic and non-neurogenic portions. B-I) Feature plots highlighting the expression of various marker genes used to group clusters into different populations of cells within the nose.
Figure 5.
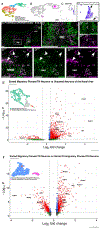
Figure 5.. TN/pioneer neurons have a distinct transcriptome from other neurons in the nose.
A) UMAP showing clusters present within the olfactory pit of embryonic E14.5 noses. B) Volcano plot showing the enriched genes of the putative migratory pioneer/TN neuron cluster (right) compared to the enriched genes of the cluster identified as differentiated neurons (left).C-N) Feature plots for marker genes used to identify the different regions of the olfactory area. O-W) In situ hybridization data at E14.5 from GenePaint showing the expression of select genes at E14.5. X-AC) Feature plots showing the enriched genes within cells of the putative pioneer/TN neurons’ cluster. AD-AE) ISH for Ndn and Pcsk1n shows their mRNA expression in migratory cells (arrows) outside the VNO.
Figure 6.
Figure 6.. FACS sorted Prokr2iCre/ R26tdTomato embryos have a heterogenous population of TN/pioneer neurons.
A) UMAP of olfactory pit clusters isolated from wild-type unsorted E14.5 noses. B) UMAP with unsorted (grey) and sorted (magenta) cells merged. The box indicates cells of the terminal nerve (TN). C-C’) Feature plot of Bcl11b in the sorted cells, shown to be enriched in the sorted premigratory pioneer/TN neurons. C’ is a magnification of the box in C. D-D”’) Bcl11b immunostaining (green) on E13.5 ProkriCre traced animals reveals that traced migratory neurons (magenta) are negative for Bcl11b expression (white arrowheads) and resident pre-migratory within the VNO (traced with dotted lines) and olfactory epithelium (OE) are positive for Bcl11b expression (black arrowheads). D’-D”’ are magnifications of the are within the grey box and D””-D””” are magnifications of the area within the white box. Red blood cells are marked with an asterisk. E) Volcano plot comparing enriched genes of the sorted migratory cells with all unsorted neurons. The UMAP represents the cell clusters compared. F) Volcano plot comparing enriched genes of the two largest sorted clusters: the putative migratory pioneer/TN neuron cluster (right) and the putative pre-migratory pioneer/TN neuron cluster (left). The UMAP represents the cell clusters compared. Scale bars in D’-D””” 50 μm; D 100 μm.
Figure 7.
Figure 7.. Prokr2 traced neurons express Lhx2 but not Isl1.
A-A”’) Prokr2cre tracing at E13.5 with Isl1 immunofluorescent staining reveals two populations of migratory cells leaving the vomeronasal organ (VNO) (traced with dotted lines): cells positive for Isl1 (green, white arrowheads) and cells negative for Isl1 that are positive for Prokr2 tracing (magenta, clear arrowheads). A’-A”’ are magnifications of the boxed area in A. B) Volcano plot comparing the enriched genes of the Prokr2+ cells (right) and the Isl1+ cells (left). C-C”’) Lhx2 immunostaining (red) on E13.5 Prokr2cre traced embryos reveals that many traced neurons (magenta) of the olfactory epithelium (OE), VNO (traced with dotted lines), and migratory mass (MM) express Lhx2 (white arrows). C’-C”’ are magnifications of the boxed area in C. Scale bars in A-A”’, C-C”’, 100 μm.
Figure 8.
Figure 8.. Prokr2 traced neurons are distinct from VSNs during embryonic development.
A-C) Developmental time-course of the Prokr2 expression within the VNO from E13.5-E18.5. Immunostaining for VSN markers: AP2-ε (blue) and Meis2 (green) against Prokr2 lineage tracing (magenta) reveals that Prokr2 traced neurons are prevalent within the VNO. Arrows indicate Prokr2 traced neurons that are negative AP2-ε and Meis2 expression. The amount of neurons that are Prokr2 traced and negative for AP2-ε and Meis2 expression within the VNO appears to decrease over time. The boxed region indicates magnifications in the proceeding panels. D-D”’) Prokr2iCre tracing at P10. Coronal sections of the VNO immunoassayed for AP2-ε and Meis2 reveal that the Prokr2 traced neurons present in postnatal animals are positive for the two VSN markers. Arrows indicate Prokr2 traced neurons that are positive for AP2-ε and Meis2 expression. D’-D”” are magnifications of the area within the box of D. Scale bars in A-C, 100 μm; C’-C””, 50 μm.
Figure 9.
Figure 9.. Calb1 is expressed by Prokr2 traced neurons but not Isl1 or GnRH-1 neurons.
A-A”’) C57 BL WT E13.5 immunofluorescent staining for Isl1 (green) and Calb1 (magenta). Both Isl1 positive (clear arrowhead) and Calb1 positive (white arrowhead) cells can be seen leaving the VNO (traced with dotted lines), as two separate populations of migratory cells. A’-A”’ are magnifications of the boxed region in A. B-B”’) Immunofluorescent staining for GnRH-1 (green) (clear arrowhead) shows two distinct populations of migratory neurons Isl1 positive (Including the GnRH-1 neurons) and Calb1 positive (white arrowhead). C) Immunohistochemistry of Calb1 reveals many neurons within the VNO positive for Calb1 expression at E13.5(black arrows). C’-C”’) Prokr2iCre tracing reveals co-expression of Calb1 with Prokr2 traced neurons (white arrows) in the VNO (traced with dotted lines), autofluorescent red blood cells (asterisks). Scale bars in A-A”’, B, 100 μm; B’-B”’, C-C”’, 50 μm.

Update of

References

    1. Abreu AP, Kaiser UB. 2016. Pubertal development and regulation. Lancet Diabetes Endocrinol 4: 254–264. - PMC - PubMed
    1. Afonso Lopes L, Benador D, Wacker P, Wyss M, Sizonenko PC. 1995. Turner’s syndrome and hypogonadotrophic hypogonadism: thalassemia major and hemochromatosis. J Pediatr Endocrinol Metab 8: 73–77. - PubMed
    1. Alsters SI, Goldstone AP, Buxton JL, Zekavati A, Sosinsky A, Yiorkas AM, Holder S, Klaber RE, Bridges N, van Haelst MM, le Roux CW, Walley AJ, Walters RG, Mueller M, Blakemore AI. 2015. Truncating Homozygous Mutation of Carboxypeptidase E (CPE) in a Morbidly Obese Female with Type 2 Diabetes Mellitus, Intellectual Disability and Hypogonadotrophic Hypogonadism. PLoS One 10: e0131417. - PMC - PubMed
    1. Auyeung B, Taylor K, Hackett G, Baron-Cohen S. 2010. Foetal testosterone and autistic traits in 18 to 24-month-old children. Mol Autism 1: 11. - PMC - PubMed
    1. Avbelj Stefanija M, Jeanpierre M, Sykiotis GP, Young J, Quinton R, Abreu AP, Plummer L, Au MG, Balasubramanian R, Dwyer AA, Florez JC, Cheetham T, Pearce SH, Purushothaman R, Schinzel A, Pugeat M, Jacobson-Dickman EE, Ten S, Latronico AC, Gusella JF, Dode C, Crowley WF Jr., Pitteloud N. 2012. An ancient founder mutation in PROKR2 impairs human reproduction. Hum Mol Genet 21: 4314–4324. - PMC - PubMed

Publication types

Substances