. 2024 Mar 15;150(3):129.
doi: 10.1007/s00432-024-05645-1.

Global analysis of T-cell groups reveals immunological features and common antigen targets of digestive tract tumors

Affiliations

Global analysis of T-cell groups reveals immunological features and common antigen targets of digestive tract tumors

Xiaoxue Li et al. J Cancer Res Clin Oncol. .

Abstract

Background: T cells are key players in the tumor immune microenvironment (TIME), as they can recognize and eliminate cancer cells that express neoantigens derived from somatic mutations. However, the diversity and specificity of T-cell receptors (TCRs) that recognize neoantigens are largely unknown, due to the high variability of TCR sequences among individuals.

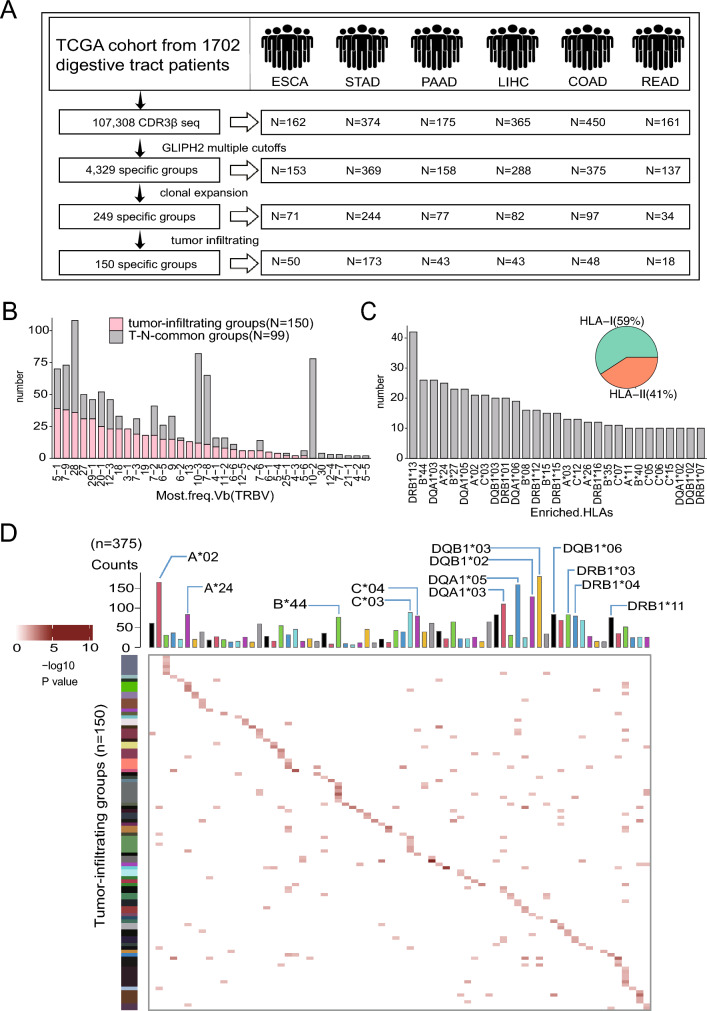
Methods: To address this challenge, we applied GLIPH2, a novel algorithm that groups TCRs based on their predicted antigen specificity and HLA restriction, to cluster the TCR repertoire of 1,702 patients with digestive tract cancer. The patients were divided into five groups based on whether they carried tumor-infiltrating or clonal-expanded TCRs and calculated their TCR diversity. The prognosis, tumor subtype, gene mutation, gene expression, and immune microenvironment of these groups were compared. Viral specificity inference and immunotherapy relevance analysis performed for the TCR groups.

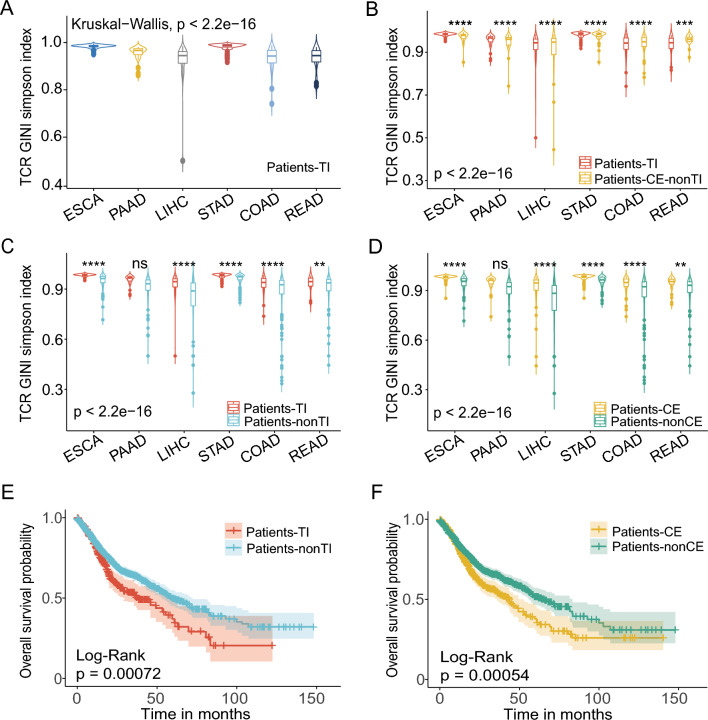
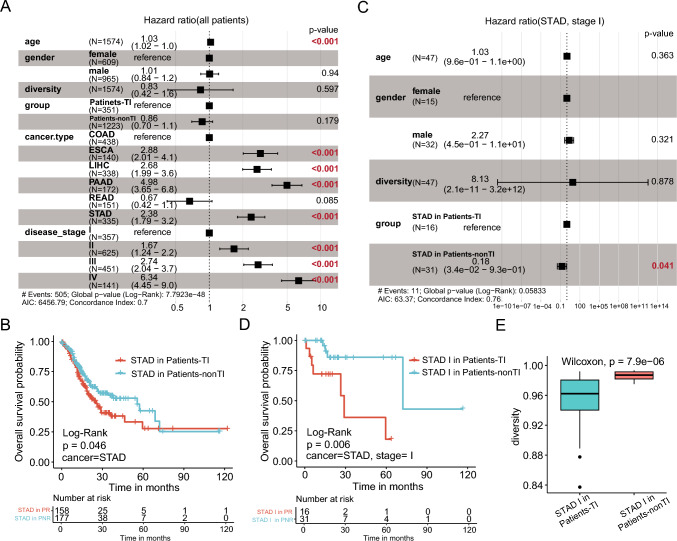
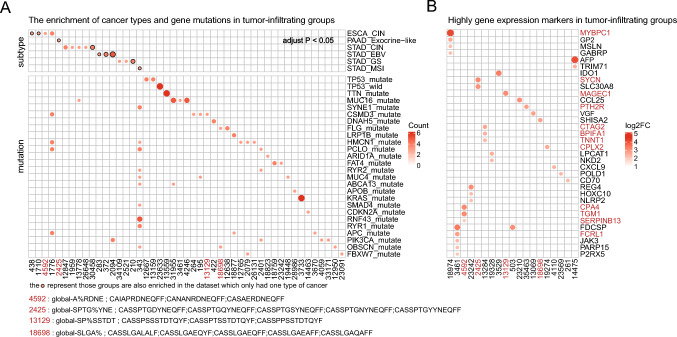
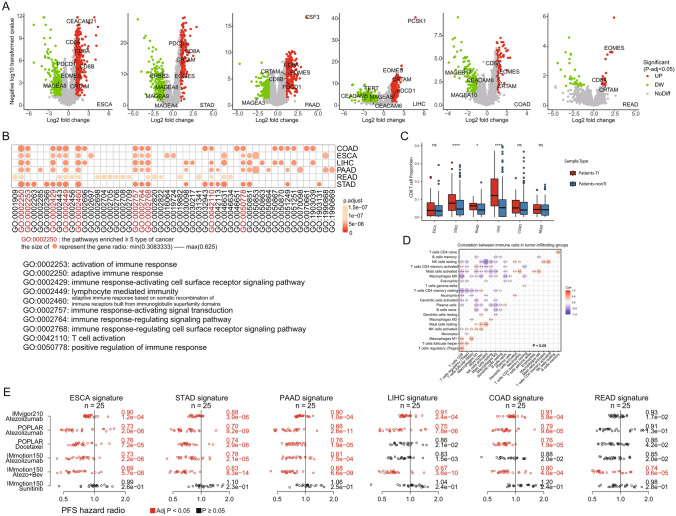
Results: This approach reduced the complexity of TCR sequences to 249 clonally expanded and 150 tumor-infiltrating TCR groups, which revealed distinct patterns of TRBV usage, HLA association, and TCR diversity. In gastric adenocarcinoma (STAD), patients with tumor-infiltrating TCRs (Patients-TI) had significantly worse prognosis than other patients (Patients-nonTI). Patients-TI had richer CD8+ T cells in the immune microenvironment, and their gene expression features were positively correlated with immunotherapy response. We also found that tumor-infiltrating TCR groups were associated with four distinct tumor subtypes, 26 common gene mutations, and 39 gene expression signatures. We discovered that tumor-infiltrating TCRs had cross-reactivity with viral antigens, indicating a possible link between viral infections and tumor immunity.

Conclusion: By applying GLIPH2 to TCR sequences from digestive tract tumors, we uncovered novel insights into the tumor immune landscape and identified potential candidates for shared TCRs and neoantigens.

Keywords: Cross-reactivity; Digestive tract cancer; GLIPH2; Immunotherapy; TCR; Tumor antigen; Tumor immune microenvironment.


Conflict of interest statement

Authors declare that they have no conflict of interests.

Figures

Fig. 1
Fig. 1
Identification of tumor-infiltrating CDR3β sequences from digestive tract cancer patients. A Schematic diagram of the pipeline for identifying tumor-infiltrating groups in six digestive tract cancers. B Distribution of the most frequent TRBV gene in each clone expansion group. The y axis shows the number of groups. The x axis shows the TRBV genes shared by those groups. C The number of HLAs enriched in the tumor-infiltrating group. The enriched HLA in each group is not unique. We counted the enriched HLA in all groups. D Heatmap of the enriched HLAs in each tumor-infiltrating group. The bar on the top shows all the HLAs in the tumor-infiltrating groups. The groups which was cluster together based on the enrichment p value is the minimum value in the group
Fig. 2
Fig. 2
Diversity and prognosis of different cohorts. A The GINI Simpson index of six cancer in Patients-TI group. (Wilcox-test: *: p ≤ 0.05; **: p ≤ 0.01; ***: p ≤ 0.001; ****: p ≤ 0.0001); ****: ESCA and PAAD/LIHC/COAD/READ; STAD and PAAD/LIHC/COAD/READ; ***: PAAD and LIHC; **: PAAD and COAD; *: PAAD and READ. BD The GINI Simpson index of different cohorts (Wilcox-test: ns: p > 0.05; *: p ≤ 0.05; **: p ≤ 0.01; ***: p ≤ 0.001; ****: p ≤ 0.0001). EF Kaplan–Meier survival curves of different cohorts. Log-rank test was used to calculate p value
Fig. 3
Fig. 3
Cox proportional-hazards model and survival analysis of different cohorts. A and C Forest plot of hazard ratio of Cox proportional-hazards model adjusted for age, gender, diversity, group, cancer type and disease stage. Figure C does not include cancer type and disease stage. Log-rank p < 0.05 and HR < 1 indicate protective factors while HR > 1 indicate risk factors. B and D Kaplan–Meier survival curve of STAD patients. E Diversity comparison between two groups (Patients-TI and Patients-nonTI)
Fig. 4
Fig. 4
Signature of six cancer types associated with the shared groups. A A heatmap of gene mutations and subtype enrichment, where the columns correspond to the clustering results of GLIPH2 and the rows show the tumor subtypes (upper) and the mutated genes (down). Each dot in the heatmap indicates a significant enrichment of a subtype or gene in a cluster. The size of the dots reflects the number of enriched samples in that group. The dots with black edge represent subtypes that were also significantly enriched in individual cancer datasets. B A heatmap of gene markers in the tumor-infiltrating groups. markers that found used both methods were highlighted in red. Each TCR group is assigned a unique code (e.g., 4592) and consists of TCR sequences that share a common motif (e.g., A%RDNE) within their CDR3 region. The motif represents the amino acid sequence or pattern that is enriched in the TCR group relative to a reference set of naive TCRs. The percentage sign (%) indicates a position where any amino acid is allowed. The clustering method (global or local) indicates whether the TCR group is based on global similarity or local motif enrichment. Global similarity means that the TCR sequences in the group have the same length and differ at the same position, while local motif enrichment means that the TCR sequences in the group have a motif that is restricted within 3 amino acids in the CDR3 region
Fig. 5
Fig. 5
The DEG of Patients-TI and Patients-nonTI groups. A Differentially expressed genes (DEGs) between the Patients-TI and Patients-nonTI (|log2FC|> 1 and p < 0.05). B GO enrichment of the DEGs in all six cancers. The size of the dots in the heatmap represents the gene ratio; The larger the dot, the larger is the gene ratio. The top 20 enriched pathways are shown for each cancer type. C Comparison of CD8 T cell percentage between Patients-TI and Patients-nonTI groups. D Cell correlation analysis (p < 0.05) of patients in tumor-infiltrating groups (Patients-TI). E Gene hazard ratios. Each gene signature for a digestive cancer (columns) is represented by hazard ratios in the treatment arms (rows) after dichotomization within the clinical trial. Vertical jitter distinguishes the overlapping dots. Hazard ratio < 1 (left of vertical lines) indicates greater PFS. The mean hazard ratio and one-sided p values are shown from a one-sample z-test of hazard ratios for genes in the signature, highlighted with associated data in red when Bonferroni-adjusted p < 0.05
Fig. 6
Fig. 6
The virus annotation of those clone expansion groups. A Network analysis of 249 specificity groups annotated with tumor-infiltrating groups, CDR3β sequences that from HLA tetramers and tumor subtypes. Each dot represents a specificity group, and the edges indicate the presence of identical CDR3β sequence(s) shared across the two specificity groups. B Statistical plot of annotation to the tetramer data. EBV (green), CMV (blue), influenza (pink) and SARS-CoV-2 (red) antigens. C The annotated antigen from homo. D Percentage (%) of HLA-A*02, HLA-A*11 or HLA-B*08, HLA-B*35 tetramer-annotated specificity groups with significantly enriched the HLA-A*02, HLA-A*11 or HLA-B*08 and HLA-B*35 supertype alleles, respectively. Specificity groups annotated with tetramers of other HLA alleles (other tetramers) were included for comparisons

Similar articles

References

    1. Ascierto PA, Marincola FM, Fox BA et al (2020) No time to die: the consensus immunoscore for predicting survival and response to chemotherapy of locally advanced colon cancer patients in a multicenter international study. Oncoimmunology 9:1826132 - PMC - PubMed
    1. Atkins D, Breuckmann A, Schmahl GE et al (2004) MHC class I antigen processing pathway defects, ras mutations and disease stage in colorectal carcinoma. Int J Cancer 109:265–273 - PubMed
    1. Chiou SH, Tseng D, Reuben A et al (2021) Global analysis of shared T cell specificities in human non-small cell lung cancer enables HLA inference and antigen discovery. Immunity 54:586-602e8 - PMC - PubMed
    1. Collisson EA, Sadanandam A, Olson P et al (2011) Subtypes of pancreatic ductal adenocarcinoma and their differing responses to therapy. Nat Med 17:500–503 - PMC - PubMed
    1. Dash P, Fiore-Gartland AJ, Hertz T et al (2017) Quantifiable predictive features define epitope-specific T cell receptor repertoires. Nature 547:89–93 - PMC - PubMed

Substances