. 2024 Mar 15;196(4):369.
doi: 10.1007/s10661-024-12497-2.

Understanding vessel noise across a network of marine protected areas

Affiliations

Understanding vessel noise across a network of marine protected areas

Megan F McKenna et al. Environ Monit Assess. .

Abstract

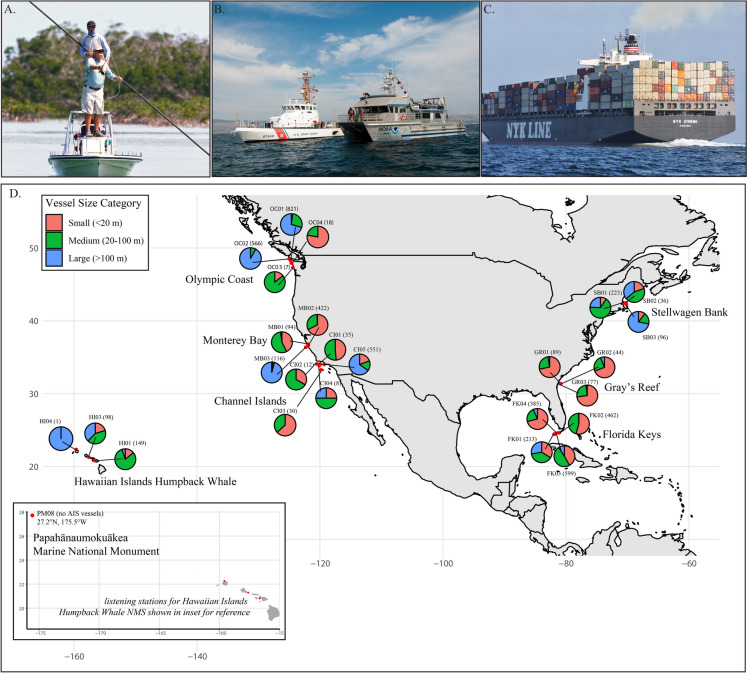
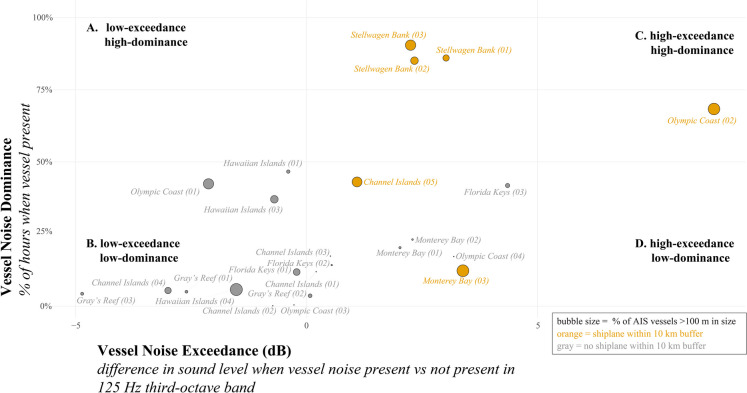
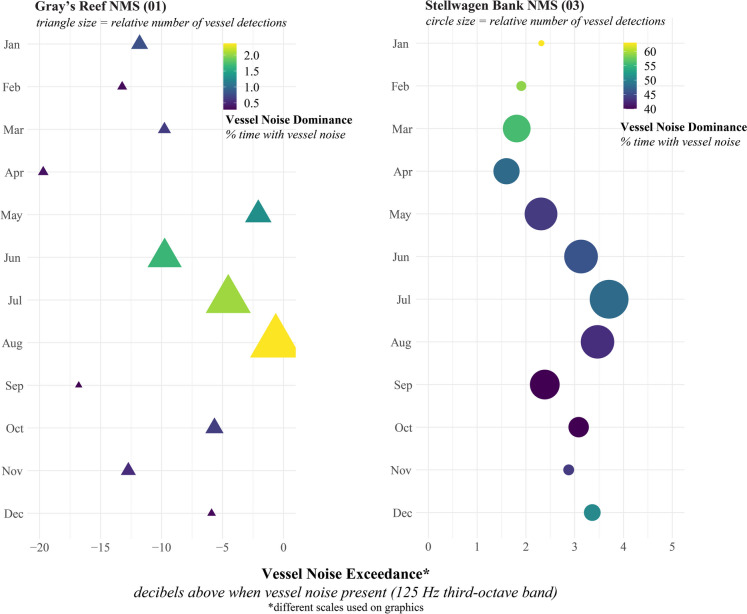
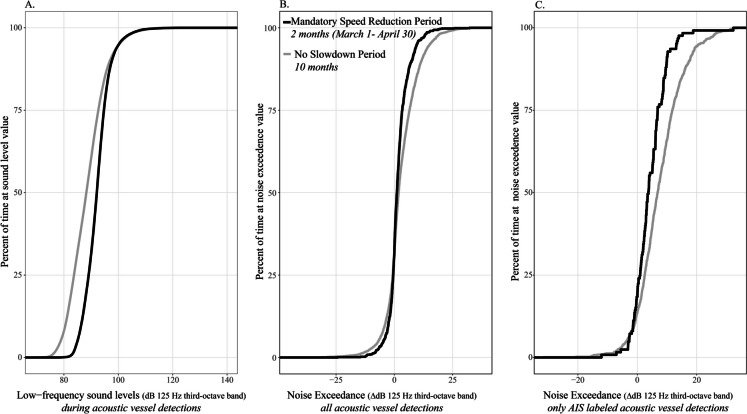
Protected areas are typically managed as a network of sites exposed to varying anthropogenic conditions. Managing these networks benefits from monitoring of conditions across sites to help prioritize coordinated efforts. Monitoring marine vessel activity and related underwater radiated noise impacts across a network of protected areas, like the U.S. National Marine Sanctuary system, helps managers ensure the quality of habitats used by a wide range of marine species. Here, we use underwater acoustic detections of vessels to quantify different characteristics of vessel noise at 25 locations within eight marine sanctuaries including the Hawaiian Archipelago and the U.S. east and west coasts. Vessel noise metrics, including temporal presence and sound levels, were paired with Automatic Identification System (AIS) vessel tracking data to derive a suite of robust vessel noise indicators for use across the network of marine protected areas. Network-wide comparisons revealed a spectrum of vessel noise conditions that closely matched AIS vessel traffic composition. Shifts in vessel noise were correlated with the decrease in vessel activity early in the COVID-19 pandemic, and vessel speed reduction management initiatives. Improving our understanding of vessel noise conditions in these protected areas can help direct opportunities for reducing vessel noise, such as establishing and maintaining noise-free periods, enhancing port efficiency, engaging with regional and international vessel quieting initiatives, and leveraging co-benefits of management actions for reducing ocean noise.

Keywords: Automatic Identification System; Marine vessel traffic; National Marine Sanctuary; Sanctuary soundscape project; Soundscape; Underwater radiated noise.


Conflict of interest statement

The authors declare no competing interests.

Figures

Fig. 1
Fig. 1
Comparison of AIS vessels operating in U.S. National Marine Sanctuaries (NMS). (A–C) Photographs of different vessel types operating in NMS: (A) small recreational fishing vessel in Florida Keys National Marine Sanctuary (credit NOAA), (B) research and military vessels operating just north of the Channel Islands National Marine Sanctuary (credit NOAA), (C) ocean-going container ships transiting Channel Islands National Marine Sanctuary (credit Cascadia Research Collective). (D) Composition of AIS vessel traffic by size categories in a 10 km buffer around each sanctuary listening station. Vessel size categories: small (red) <20 m, medium (green) = 20–100 m, and large (blue) >100 m. A single month in 2019 is shown for each location with count of unique AIS vessels in brackets; month was selected to match availability of acoustic data (Figure S1). AIS data analysis is further described in the Methods section. Due to scale of the map, NMS boundaries are not shown
Fig. 2
Fig. 2
Vessel noise categories across 24 listening stations, one site (PM08) did not have vessel noise detections. A single month in 2019 is shown for each listening station (see Fig. S1 for specific month). Vessel noise exceedance (dB) (x-axis) was calculated as the difference in hourly median sound level in the 125 Hz one-third octave band (decibels) when a vessel was acoustically detected vs not detected across all hours in a month; negative values occur when on average the acoustic environments were higher when no vessels were present. Vessel noise dominance (y-axis) was calculated as the percentage of the hours (in a month) vessel noise was detected in the soundscape. Four general categories of vessel noise are shown based on dominance and exceedance: (A) upper left includes listening stations with high vessel dominance but low-exceedance; (B) listening stations in upper right had both high-exceedance and dominance; (C) lower left shows listening stations with minimal vessel presence (low-exceedance and dominance); (D) lower right represents listening stations with high-exceedance but vessels not detected as often. The size of the bubbles is % of AIS vessels greater than 100 m in length (large size category, see Fig. 1); orange bubbles indicate a shipping lane was within the 10 km buffer, and gray bubbles indicate no shipping lane within the 10 km buffer around a listening station
Fig. 3
Fig. 3
For each month in 2019 at two listening stations, noise exceedance (x-axis, calculated as the difference in maximum low-frequency sound level at 125 Hz one-third octave band when vessel was detected compared to closest non-vessel period) and vessel noise dominance (color, percent of time with vessel noise present) are shown. Note different noise dominance scales for each site, represented by shapes. Relative number of vessel acoustic detections for each site (shape size) also varied by month, with highest numbers in summer months at both listening stations. At SB03 total number of monthly vessel acoustic detections ranged from 333 (Feb) to 583 (Jul) and at GR01 total number of monthly vessel detections ranged from 9 (Sep) to 78 (Aug)
Fig. 4
Fig. 4
Daily patterns in vessel noise dominance. Listening stations (A) SB03, (B) FK03, (C) CI05, and (D) MB02 all occurred in the high-exceedance category (Fig. 2), yet different daily patterns emerge when summarized as average minutes of the hour dominated by vessel noise. Standard error for each hour within a single month in 2019 (see Figure S1)
Fig. 5
Fig. 5
Comparisons of different vessel noise metrics between mandatory vessel speed reduction period and no vessel slowdown period in Stellwagen Bank NMS. All months in 2019 were analyzed. Empirical Cumulative Distributions, representing the percent of time (1-min samples) a specific x-axis variable occurs, are shown for (A) 1-min low-frequency sound levels (125 Hz third-octave band), only during acoustic vessel detections, (B) noise exceedance for all acoustic vessel detections within the two time periods, and (C) noise exceedance for acoustic vessel detection with known AIS vessel transiting within 10 km of the listening station. Noise exceedance quantifies the difference between maximum sound level during an acoustic vessel detection period compared to nearest non-vessel period
Fig. 6
Fig. 6
Vessel noise changes related to early COVID-19 pandemic shutdowns. A comparison of conditions in April 2019 compared to April 2020—arrow direction points from 2019 to 2020. The x-axis shows sound pressure level (not vessel noise exceedance) because a change in noise exceedance is not expected assuming vessels did not change routes in relation to the site. Further, we were interested in how the likely reduction in vessel traffic reduced median low-frequency sound levels at each site. Colors represent categories of how vessel noise presence changed: green=reduction in both, purple=reduction in noise dominance and increase in sound level, red=increase in noise dominance and reduction in sound level, black=no change. Bubble size is the proportion of vessel traffic in the month that were large vessels and size change for a given site indicates a shift in traffic composition

References

    1. Birchenough SE, Cooper PA, Jensen AC. Vessel monitoring systems as a tool for mapping fishing effort for a small inshore fishery operating within a marine protected area. Marine Policy. 2021;124:104325. doi: 10.1016/j.marpol.2020.104325. - DOI
    1. Boyd IL, Frisk G, Urban E, Tyack P, Ausubel J, Seeyave S, Cato D, Southall B, Weise M, Andrew R, et al. An International Quiet Oceans Experiment. Oceanography. 2011;24:174–181. doi: 10.5670/oceanog.2011.37. - DOI
    1. Breeze, H., Nolet, V., Thomson, D., Wright, A. J., Marotte, E., & Sanders, M. (2022). Efforts to advance underwater noise management in Canada: Introduction to the Marine Pollution Bulletin Special Issue. Marine Pollution Bulletin, 178, 113596. 10.1016/j.marpolbul.2022.113596 - PubMed
    1. Burnham RE, Vagle S, Thupaki P, Thornton SJ. Implications of wind and vessel noise on the sound fields experienced by southern resident killer whales Orcinus orca in the Salish Sea. Endangered Species Research. 2023;50:31–46. doi: 10.3354/esr01217. - DOI
    1. Buxton RTRT, McKenna MFMF, Mennitt D, Brown E, Fristrup K, Crooks KRKR, Angeloni LMLM, Wittemyer G. Anthropogenic noise in US national parks – Sources and spatial extent. Frontiers in Ecology and the Environment. 2019;17(10):559–564. doi: 10.1002/fee.2112. - DOI