. 2024 Mar 15;19(3):e0300075.
doi: 10.1371/journal.pone.0300075. eCollection 2024.

Stationary stable cross-correlation pattern and task specific deviations in unresponsive wakefulness syndrome as well as clinically healthy subjects

Affiliations

Stationary stable cross-correlation pattern and task specific deviations in unresponsive wakefulness syndrome as well as clinically healthy subjects

David E Apablaza-Yevenes et al. PLoS One. .

Abstract

Brain dynamics is highly non-stationary, permanently subject to ever-changing external conditions and continuously monitoring and adjusting internal control mechanisms. Finding stationary structures in this system, as has been done recently, is therefore of great importance for understanding fundamental dynamic trade relationships. Here we analyse electroencephalographic recordings (EEG) of 13 subjects with unresponsive wakefulness syndrome (UWS) during rest and while being influenced by different acoustic stimuli. We compare the results with a control group under the same experimental conditions and with clinically healthy subjects during overnight sleep. The main objective of this study is to investigate whether a stationary correlation pattern is also present in the UWS group, and if so, to what extent this structure resembles the one found in healthy subjects. Furthermore, we extract transient dynamical features via specific deviations from the stationary interrelation pattern. We find that (i) the UWS group is more heterogeneous than the two groups of healthy subjects, (ii) also the EEGs of the UWS group contain a stationary cross-correlation pattern, although it is less pronounced and shows less similarity to that found for healthy subjects and (iii) deviations from the stationary pattern are notably larger for the UWS than for the two groups of healthy subjects. The results suggest that the nervous system of subjects with UWS receive external stimuli but show an overreaching reaction to them, which may disturb opportune information processing.


Conflict of interest statement

The authors have declared that no competing interests exist.

Figures

Fig 1
Fig 1. 10-second EEG segments of 5 electrodes.
A) one representative UWS patient; B) one subject of the control group during rest; C) one healthy subject during deep sleep and D) during REM sleep (see [31] for the description of the sleep subjects). The electrodes were selected to provide a representative image of the scalp.
Fig 2
Fig 2. Different representations of probability densities as a histogram (upper row) and the corresponding cumulative probability distribution.
(a) shows a symmetric, (b) an asymmetric, and (c) a bimodal distribution.
Fig 3
Fig 3
(a) shows interrelation matrices of one subject of the control group during rest using zero-lag cross-correlations (upper matrix) and Spearman correlation (lower matrix). (b), (c) and (d) show cumulative probability distributions comparing both indices for one representative subject of the Control group (panel b), UWS group (panel c) during rest, as well as one subject during sleep (panel d). In all cases we show the stationary pattern, viz. the interrelation matrices averaged over the whole recording.
Fig 4
Fig 4
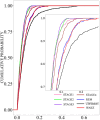
(a) Similarity ρ between correlation matrices averaged separately for each condition (res = resting, rhy = rhythmic, ar = arrhythmic as well as sleep stages 2, 4 and REM) and each subject: top row controls, centre UWS and bottom sleep. (b) Cumulated probability distributions of the similarity values ρ shown in panel (a). The red curve corresponds to the similarity values of the 13 participants of the control group, cyan to those of the 10 sleep EEGs and black to the 13 UWS. (c) Boxplots of the non-diagonal elements of the stationary pattern separately for each subject. Colours as in panel (b).
Fig 5
Fig 5
(a) Stationary correlation pattern of subject 1 of the control group. Electrodes are ordered in such a way that the upper left and lower right square of each matrix display intra-hemispheric cross-correlations of the left and right hemisphere respectively. The lower left and upper right square show inter-hemispheric correlations. The three-by-three central square contains the correlation coefficients between the central electrodes and the rectangles display the correlations between hemispheric and central contacts. The diagonal elements of each matrix are set to zero to improve visual impression. (b) Stationary correlation pattern of each subject considered in the present study. First row, control subjects, middle row UWS, bottom row sleep.
Fig 6
Fig 6. Comparison of stationary pattern within and between groups.
(a) Colour coded similarity Index ρ or intra- and inter-group comparisons, (b) cumulative distribution functions for intra-group comparison, colour coding is the same as in Fig 4, (c) same as (b) for inter-group comparisons, pink indicates the comparison of the control and sleep group, brown UWS and control and yellow sleep with the UWS-group.
Fig 7
Fig 7
(a) Cumulative distribution of the absolute values of non-diagonal elements of the stationary patterns. (b) Cumulative probability distribution of the non-diagonal elements of the deviation matrices. The UWS patients are shown in black, the cyan colour corresponds to the sleep EEGs, and the results of the control group are drawn in red.
Fig 8
Fig 8. Cumulative probability distribution of the non-diagonal elements of the deviation matrices for the 10 sleep EEGs, separately for the different sleep stages as well as for the UWS in the resting state condition.
UWS results are shown in black. Colour codes of the sleep stages are as follows: Awake condition (red), Stage 1 (pink), Stage 2 (green), Stage 3 (purple), Stage 4 (brown) and REM sleep (blue).
Fig 9
Fig 9
Cumulative probability distribution of the non-diagonal elements of the Deviation matrices for the Control (a) and the UWS group (b). Deviations for the Resting condition are drawn in green, those for the Rhythmic and Arrhythmic conditions are drawn in magenta and blue respectively.
Fig 10
Fig 10
Cumulative probability of the deviation matrices for the Resting (a) Rhythmic (b), and Arrhythmic (c) conditions. Control and UWS groups are displayed in red and black respectively.

References

    1. Kaplan AY, Fingelkurts AA, Fingelkurts AA, Borisova SV, Darkhovsky BS. Nonstationary nature of the brain activity as revealed by EEG/MEG: Methodological, practical and conceptual challenges. Signal Processing. 2005. Nov;85(11):2190–2212.
    1. Graziano MS. A system of multimodal areas in the primate brain. Neuron. 2001. Jul 5;29(1):4–6. doi: 10.1016/s0896-6273(01)00174-x - DOI - PubMed
    1. Schubotz RI. Prediction of external events with our motor system: towards a new framework. Trends Cogn Sci. 2007. May;11(5):211–218. doi: 10.1016/j.tics.2007.02.006 - DOI - PubMed
    1. Morillon B, Schroeder CE, Wyart V. Motor contributions to the temporal precision of auditory attention. Nat Commun. 2014. Oct 24;5(1):5255. - PMC - PubMed
    1. Beggs JM, Plenz D. Neuronal avalanches in neocortical circuits. J Neurosci. 2003. Sep 3;23(35):11167–11177. doi: 10.1523/JNEUROSCI.23-35-11167.2003 - DOI - PMC - PubMed