. 2024 Mar 15;9(93):eadj7238.
doi: 10.1126/sciimmunol.adj7238. Epub 2024 Mar 15.

Single-cell NAD(H) levels predict clonal lymphocyte expansion dynamics

Affiliations

Single-cell NAD(H) levels predict clonal lymphocyte expansion dynamics

Lucien Turner et al. Sci Immunol. .

Abstract

Adaptive immunity requires the expansion of high-affinity lymphocytes from a heterogeneous pool. Whereas current models explain this through signal transduction, we hypothesized that antigen affinity tunes discrete metabolic pathways to license clonal lymphocyte dynamics. Here, we identify nicotinamide adenine dinucleotide (NAD) biosynthesis as a biochemical hub for the T cell receptor affinity-dependent metabolome. Through this central anabolic role, we found that NAD biosynthesis governs a quiescence exit checkpoint, thereby pacing proliferation. Normalizing cellular NAD(H) likewise normalizes proliferation across affinities, and enhancing NAD biosynthesis permits the expansion of lower affinity clones. Furthermore, single-cell differences in NAD(H) could predict division potential for both T and B cells, before the first division, unmixing proliferative heterogeneity. We believe that this supports a broader paradigm in which complex signaling networks converge on metabolic pathways to control single-cell behavior.


Conflict of interest statement

Competing interests: JAB reports receiving research funding and materials from the NIH, Pfizer, Elysium Health and Metro International Biotech; and consulting fees from Pfizer, Elysium Health, and Cytokinetics. JAB holds a patent for using NAD precursors in liver injury (US 11,103,496 B2); WB and JAB hold a provisional patent (U.S. 63/582,577). All other authors declare no competing interests.

Figures

Figure 1:
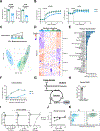
Figure 1:. NAD biosynthesis is a core component of the TCR affinity-dependent metabolome.
(A) Seahorse analysis of 24 hour peptide stimulated (G4 or N4) OT-I T cells. (B) Seahorse analysis was run on OT-I T cells prior to and after stimulation with either 1μg/mL of N4 or G4 peptide (added via analyzer port). LC-MS analysis of 24 hour peptide stimulated (G4, T4, Q4, or N4) OT-I T cells. C) PCA plot generated from metabolite abundance. (D) Heatmap of named peaks plotted as log10 fold change of normalized values above G4. (E) Pathway Analysis using all metabolites in Cluster 1. Shown is the percentage of significantly matched pathways corresponding to each metabolite. (F) Cellular NAD quantification by cycling assay of OT-I T cells stimulated with N4 or G4 peptide 24 hours post-activation. (G) Schematic of NAD biosynthesis pathways. (H) Cellular NAD quantification by cycling assay in peptide stimulated OT-I T cells treated with FK866 or vehicle control, 24 hours post-activation. (I) Cellular NAD quantification by cycling assay in peptide stimulated OT-I treated with vehicle control or FK866 in the presence of Trp, NA, or NR. (J) Nampt transcript expression after 24 hours of stimulation with the noted concentrations of anti-CD3ε antibody, with or without anti-CD28 antibody (5μg/mL). (K) Flow cytometry analysis of NAD(P)H autofluorescence and CD69 in peptide stimulated (G4 or N4) OT-I T cells. Statistical significance was determined using Student’s T-test (A), 2-way ANOVA (B) for the interaction of affinity and time in both ECAR and OCR (p < 0.0001), (F) of peptide affinity (p < 0.0001) and concentration (p < 0.0001), (J) for anti-CD3e levels (p = 0.0082) and CD28 stimulation (p = 0.0007) was (I) F test of non-zero slope Trp (p = 0.42), NA (p = 0.81), NR (p = 0.0005). ****p < 0.0001
Figure 2:
Figure 2:. Cellular NAD levels control affinity-driven T cell expansion dynamics.
(A) CD8+ T cells from Namptfl/fl x CD8α-Cre x OT-I mice or Cre controls were transferred into Lm-Ova infected CD45.1 recipients. The relative number of transferred cells was quantified at day 7 post-infection. WT or Nampt Tg x CD8a-Cre mice were infected with Lm-Ova and analyzed at day 7 post-infection. (B) Quantification of SIINFEKL-H2-Kb tetramer gMFI, normalized to TCRβ gMFI. (C) The number of SIINFEKL-H2-Kb tetramer+ cells. (D) Schematic of experimental design for E-I. CD8+ T cells were activated and treated with FK866 or vehicle control for 24 or 48 hours from the indicated time points. (E) Cell number and proliferation (48-hour treatment windows). (F) Cell cycle entry (24-hour treatment windows). CD8+ T cells were activated and treated with FK866 or vehicle control from either day 0–1 or 3–4. (G) NAD(P)H fluorescence lifetime in the mitochondria and cytoplasmic/nuclear compartments, plotting relative lifetime in FK866 versus vehicle controls. (H) Basal ECAR and OCR in activated CD8+ T cells treated with FK866 or vehicle control from day 0–1 or 1–2. Peptide (N4 or G4) stimulated OT-I T cells were treated with FK866 +/− NR at the indicated concentration. After 24 hours, (I) the frequency of Ki67+ cells and (J) Myc gMFI in G1 cells were quantified. K) Seahorse Mito Stress Test of WT CD8+ T treated with FK866 and NR at the indicated concentrations, 24 hours post-stimulation. Results from 2 (A) or 3 (B) independent experiments are shown. Statistical significance was calculated in (A-C and E-G) using multiple unpaired t-tests using Two-stage step-up (Benjamini, Krieger, and Yekutieli). (H) Multiple comparisons T test using Holm-Sidak correction was used for ECAR. Student’s T-test of fold change for OCR. EC 50 calculated for (I): N4 = 0.093μM NR, G4 = 0.197μM NR) and (J) N4 = 0.42μM NR, G4 = 0.43μM NR. **** p<0.0001
Figure 3:
Figure 3:. NAD biosynthesis governs a quiescence exit checkpoint.
(A) Schematic of “delayed NAD rescue” assay. (B) Peptide stimulated OT-I T cells were with FK866 for 24 hours and then acutely supplemented with 100μM NR (hereafter, the“delayed NAD rescue assay”). The frequency of Ki-67+ cells was quantified at the indicated time points post-NR treatment. Following 0.1μM or 100μM NR treatment of peptide (N4 or G4) stimulated OT-I T cells during the delayed NAD rescue assay, (C) the frequency of Ki67+ cells and (D) Myc gMFI in G1 cells was quantified. (E) Representative plots of Myc protein expression at 4 hours post-NR supplementation. (F) Seahorse Mito Stress Test on OT-I T cells following delayed NAD rescue assay, with maximal ECAR and OCR plotted. Untargeted LC-MS was performed on cells subjected to the delayed NAD rescue assay to quantify relative metabolite abundance pre- and post-NR supplementation (30, 60, 240 minutes). Peak areas were normalized to an internal standard. (G) Frequency of all detected metabolites that were NAD sensitive. (H) Schematic of glycolysis shown above graphs plotting the abundance of the bolded metabolites during the delayed NAD rescue assay. (I) Experimental schematic for J & K. The delayed NAD rescue assay was performed on OT-I T cells in either control media or media containing 0.03 mM glucose. After 24 hours, cultures were supplemented with NR and limiting glucose cultures were supplemented with 10 mM glucose and (J) cell cycle entry and (K) Myc gMFI in G1 cells were quantified. Dotted line denontes vehicle control levels at the time of NR addition. (L) Experimental schematic of M & N. The delayed NAD rescue assay was performed on OT-I T cells,treating with the indicated inhibitors 10 minutes before NR supplementation and (M) the frequency of Ki-67+ cells and (N) Myc gMFI in G1 cells were quantified. Significance was calculated using (B) multiple unpaired t-tests with Two-stage step-up (Benjamini, Krieger, and Yekutieli) (C and D) F-test comparing the slope of linear regression between 100μM NR and 0.1μM NR conditions. (F) 2-way ANOVA for dose and time interaction for max ECAR and max OCR. (G, M, and N) Multiple comparisons using Tukey’s correction. (J-K) Sidak’s multiple comparisons. All comparisons are significant except (M) 2DG and HA and (N) HA and FK866. ****p < 0.0001
Figure 4:
Figure 4:. Single-cell differences in NAD(H) underly lymphocyte heterogeneity.
OT-I T cells were stimulated with peptide for 24hrs and then CD8+CD69+ cells were sorted by NAD(P)H autofluorescence. (A) Experimental schematic and example gating strategy. (B) Basal ECAR and OCR of NAD(P)H high and low cells one day post-sort. N4 stimulated OT-I T cells were sorted by quartiles of NAD(P)H autofluorescence and evaluated for (C) cell cycle 12 hours post-sort or (D) proliferative capacity 24 hours post-sort. (E) Schematic of NAD(P)H normalization sorting strategy. (F) OT-I T cells were stimulated with N4 or G4 peptide for 24 hours and were then sorted using the same gates for NAD(P)H high and low cells. Shown is the frequency of divided cells in each population, 24 hours post-sort. WT CD8+ T cells were stimulated and sorted by NAD(P)H autofluorescence at ~20 hours post-stimulation. Three days post-sort, cells were restimulated and evaluated for (G) proliferation (CTY) and IFNγ production (H) TNFα and IFNγ. (I) After 24 hours, N4 stimulated 45.1 OT-I T cells were sorted by NAD(P)H and adoptively transferred into Lm-Ova infected, congenically marked recipients on day 1 post-infection. At days 7 and 35, the number of transferred splenic OT-I T cells were quantified. WT CD4+ T cells or B cells were stimulated with anti-CD3e and anti-CD28 plate bound antibodies or LPS respectively. Cells were sorted 20 hours post-stimulation based on NAD(P)H autofluorescence. Proliferation was determined 1 day post-sort for (J) CD4+ T cells and (K) B cells. Statistical significance was determined using (B, I, J, and K) Student’s t-test, (D) F-test of non-zero slope of the linear regression of the rank assigned data, (F) Two-way ANOVA which determined that NAD(P)H levels contributed to 93.8% of the variance in sorted conditions. * p < 0.05 ****p < 0.0001

References

    1. Chapman NM, Boothby MR, Chi H, Metabolic coordination of T cell quiescence and activation. Nature Reviews Immunology 2019 20:1 20, 55–70 (2019). - PubMed
    1. Geltink RIK, Kyle RL, Pearce EL, Unraveling the Complex Interplay Between T Cell Metabolism and Function. 36, 461–488 (2018). - PMC - PubMed
    1. Heinzel S, Marchingo JM, Horton MB, Hodgkin PD, The regulation of lymphocyte activation and proliferation. Current Opinion in Immunology 51, 32–38 (2018). - PubMed
    1. Allison KA et al., Affinity and dose of TCR engagement yield proportional enhancer and gene activity in CD4+ T cells. eLife 5, (2016). - PMC - PubMed
    1. Conley JM, Gallagher MP, Rao A, Berg LJ, Activation of the Tec Kinase ITK Controls Graded IRF4 Expression in Response to Variations in TCR Signal Strength. Journal of immunology (Baltimore, Md. : 1950) 205, 335–345 (2020). - PMC - PubMed

Publication types