. 2024 Mar 15;9(93):eadh5318.
doi: 10.1126/sciimmunol.adh5318. Epub 2024 Mar 15.

RORγt up-regulates RAG gene expression in DP thymocytes to expand the Tcra repertoire

Affiliations

RORγt up-regulates RAG gene expression in DP thymocytes to expand the Tcra repertoire

Abani Kanta Naik et al. Sci Immunol. .

Abstract

Recombination activating gene (RAG) expression increases as thymocytes transition from the CD4-CD8- double-negative (DN) to the CD4+CD8+ double-positive (DP) stage, but the physiological importance and mechanism of transcriptional up-regulation are unknown. Here, we show that a DP-specific component of the recombination activating genes antisilencer (DPASE) provokes elevated RAG expression in DP thymocytes. Mouse DP thymocytes lacking the DPASE display RAG expression equivalent to that in DN thymocytes, but this supports only a partial Tcra repertoire due to inefficient secondary Vα-Jα rearrangement. These data indicate that RAG up-regulation is required for a replete Tcra repertoire and that RAG expression is fine-tuned during lymphocyte development to meet the requirements of distinct antigen receptor loci. We further show that transcription factor RORγt directs RAG up-regulation in DP thymocytes by binding to the DPASE and that RORγt influences the Tcra repertoire by binding to the Tcra enhancer. These data, together with prior work showing RORγt to control Tcra rearrangement by regulating DP thymocyte proliferation and survival, reveal RORγt to orchestrate multiple pathways that support formation of the Tcra repertoire.


Conflict of interest statement

Competing interests: The authors declare no competing financial interests.

Figures

Figure 1.
Figure 1.
The DPASE directs RAG gene upregulation in DP thymocytes. (A) ASE region ATAC-seq peaks (GSE107076) in DN, DP, CD4SP and CD8SP thymocytes. (B) Quantification of thymocyte sub-populations in WT and ΔDPASE mice. Three pairs of WT and ΔDPASE littermate mice were analyzed in three independent experiments. Statistical significance was calculated using two-way ANOVA with Holm-Sidak’s correction for multiple comparisons. Each symbol represents an individual mouse; horizontal line represents the mean. (C) Quantification of positive selection in ΔDPASE mice. Five pairs of WT and DDPASE littermates were analyzed in five independent experiments. Statistical significance was evaluated by unpaired t-test. (D) Rag1 and Rag2 transcript levels in DN3a and DP thymocytes measured by qRT-PCR. Rag1 and Rag2 transcript levels were normalized to those for Actb. The data represent the mean and s.e.m. of three independent experiments analyzing DN3a thymocytes (one littermate pair per experiment) and five independent experiments analyzing DP thymocytes (one littermate pair per experiment). Statistical significance was calculated using two-way ANOVA with Holm-Sidak’s correction for multiple comparisons. **P<0.01, ***P<0.001, ****P<0.0001. (E) RAG1 and RAG2 protein abundance measured by immunoblot. Results are presented for sorted DP thymocytes from two pairs of WT and ΔDPASE littermates. Total thymus (Thy) and kidney (Kid) served as positive and negative controls, respectively. Numbers below each lane represent RAG protein expression normalized to that for β-actin.
Figure 2.
Figure 2.
The DPASE regulates RAG locus conformation and RNA polII loading in DP thymocytes. (A) 3C analysis showing interactions from the ASE viewpoint (left) and the Rag1p viewpoint (right) in WT and ΔDPASE thymocytes. The −104 fragment served as a negative control. Relative interactions were calculated using BAC standards and were normalized to those of a nearest neighbor restriction fragment. The data represent the mean and s.e.m of four independent experiments, each analyzing a littermate pair. Statistical significance was calculated by two-way ANOVA with Holm-Sidak’s correction for multiple comparisons. (B,C) ChIP analysis of RNA Pol II (B) and H3K4me3 (C) at the core ASE and RAG promoters in DP thymocytes of WT and ΔDPASE mice. Values were expressed relative to those displayed by the B2m promoter. The data represent the mean and s.e.m of three independent experiments, each analyzing a littermate pair. Statistical significance was calculated using two-way ANOVA with Holm-Sidak’s correction for multiple comparisons. *P<0.05, **P<0.01, ***P<0.001, ****P<0.0001.
Figure 3.
Figure 3.
The DPASE is essential to generate a complete Tcra repertoire. (A) Heatmaps show frequencies of Vα-Jα rearrangements in CD4+CD8+CD3εlo thymocytes as measured by 5’ RACE and high throughput sequencing. The data represent the results of one of two independent experiments, each analyzing a pair of WT and ΔDPASE littermates. (B) Relative usage of Jα segments in WT and ΔDPASE mice. The data represent mean of two independent experiments, each analyzing a pair of WT and ΔDPASE littermates (top). Statistical significance was calculated using two-way ANOVA with Holm-Sidak’s correction for multiple comparisons (Table S1). Aggregate usage (%) of the proximal 15, central 13, and distal 15 Jα segments in each genotype (bottom).
Figure 4.
Figure 4.
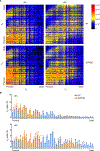
The DPASE is essential for normal kinetics of secondary Tcra recombination. (A). Heatmaps showing frequencies of Vα-Jα rearrangements in WT and ΔDPASE ZsG+ CD4+CD8+CD3εlo thymocytes 24h and 48h after tamoxifen injection. The data represent the results of one of two independent experiments per timepoint, each analyzing a pair of WT and ΔDPASE littermates. (B) Relative usage of Jα segments in WT and ΔDPASE mice. The data represent mean of two independent experiments per timepoint, each analyzing a pair of WT and ΔDPASE littermates. Statistical significance was calculated using two-way ANOVA with Holm-Sidak’s correction for multiple comparisons (Table S1).
Figure 5.
Figure 5.
RORγt regulates RAG expression by binding to the DPASE. (A) RORγt sequence logo (Jaspar, 9th release) aligned with DPASE sequence. (B) ChIP analysis of RORγt binding to the DPASE and Bcl2l1 in VL3–3M2 cells. The data are expressed as mean and s.e.m. fold-enrichment over control IgG ChIP in three independent experiments. Statistical significance was evaluated by two-way ANOVA with Holm-Sidak’s correction for multiple comparisons. (C) CRISPR-Cas9 was used to generate a VL3–3M2 mutant with distinct RORE deletions on the two alleles. The RORE is denoted by red lettering. Inserted nucleotides are denoted by blue lettering. (D) ChIP analysis of RORγt binding to the ΔRORE DPASE. The data are expressed as mean and s.e.m. binding (% input) in four independent experiments. Statistical significance was evaluated by two-way ANOVA with Holm-Sidak’s correction for multiple comparisons. (E and F) Rag1 and Rag2 expression in WT and ΔDPASE (E), and in WT and ΔRORE (F) VL3–3M2 cells, measured by qRT-PCR. Rag1 and Rag2 transcript levels were normalized to those for Actb. The data represent the mean and s.e.m. of three independent experiments, each analyzing a pair of littermates. Statistical significance was calculated using unpaired t-test. (G) ChIP analysis of RORγt binding in DP thymocytes obtained from anti-CD3ε injected Rag2−/− mice. The data represent the mean and s.e.m. fold-enrichment over control in three independent experiments, each analyzing a pair of littermates. Statistical significance was calculated by two-way ANOVA with Holm-Sidak’s correction for multiple comparisons. MageA2 served as a negative control. (H and I) Rag1 and Rag2 transcript levels in WT and Rorc(t)−/− DP (H) and DN (I) thymocytes measured by qRT-PCR with normalization to those for Actb. The data represent the mean and s.e.m. of four (H) and five (I) independent experiments, each analyzing a pair of littermates. Statistical significance was calculated by unpaired t-test. *P<0.05, **P<0.01, ***P<0.001, ****P<0.0001.
Figure 6.
Figure 6.
Both proximal and distal Jα rearrangements are impaired in Rorc(t)−/− DP thymocytes. (A) Trav12 family rearrangements to different Jα segments were measured by qPCR of genomic DNA samples of CD3−/low (left) or CD71+ (right) DP thymocytes. Rearrangement values for WT and Rorc(t)−/− were initially normalized to Cd14 after which average values for mutant were expressed relative to WT (average value set to 1) for each Jα segment. The data for CD3−/low DP thymocytes represent the mean and s.e.m. of three independent experiments, each analyzing a pair of littermates, with the exception that only two experiments were performed for the Traj61 datapoint. The data for CD71+ DP thymocytes represent the mean and s.e.m. of three independent experiments analyzing four littermate pairs. (B) Trav12 family rearrangements to different Jα segments in CD3−/low (left) or CD71+ (right) DP thymocytes of WT and ΔDPASE mice, analyzed as in (A). The data represent the mean and s.e.m. of three independent experiments, each analyzing a pair of littermates. Statistical significance was calculated using two-way ANOVA with Holm-Sidak’s correction for multiple comparisons. (C, D) Rag1 and Rag2 transcript levels in WT and Rorc(t)−/− CD71+ DP thymocytes (C) or in WT and ΔDPASE CD71+ DP thymocytes, measured by qRT-PCR with normalization to those for Actb. The data represent the mean and s.e.m. of four (C) or three (D) independent experiments, each analyzing a pair of littermates. Statistical significance was calculated by unpaired t-test. *P<0.05, **P<0.01, ***P<0.001, ****P<0.0001.
Figure 7.
Figure 7.
RORγt regulates the Tcra repertoire by direct binding to the Tcra locus. (A) ChIP analysis of RORγt binding to the Tcra locus in DP thymocytes of anti-CD3-injected Rag2−/− mice. Magea2 served as a negative control. The data are expressed as mean and s.e.m. fold-enrichment over control IgG ChIP in four independent experiments. Statistical significance was evaluated by two-way ANOVA with Holm-Sidak’s correction for multiple comparisons. (B) CRISPR-Cas9 disruption of two overlapping predicted ROREs situated immediately upstream of Eα. The ROREs are denoted by red lettering; a small insertion is denoted by blue lettering. (C) Disruption of RORγt binding to Eα measured by ChIP. Bcl2l1 and Magea2 served as positive and negative controls, respectively. The data are expressed as mean and s.e.m. fold-enrichment over control IgG ChIP in three independent experiments, each analyzing a littermate pair. Statistical signifiance was evaluated by two-way ANOVA with Holm-Sidak’s correction for multiple comparisons. (D) Thymocyte populations in WT and EαΔRORE mice. Four pairs of littermates were analyzed in four independent experiments. Statistical significance was calculated using two-way ANOVA with Holm-Sidak’s correction for multiple comparisons. (E) Trav12 family rearrangement to different Jα segments measured by qPCR of DP thymocyte genomic DNA samples, with values for WT and EαΔRORE normalized as in Fig 6A. The data represent the mean and s.e.m. of three independent experiments, each analyzing a pair of littermates. Statistical significance was calculated using two-way ANOVA with Holm-Sidak’s correction for multiple comparisons. (F) Tcra germline transcription in DP thymocytes of anti-CD3 injected mice measured by qRT-PCR. Values for Tcra germline transcripts were normalized to those for Hprt and the average value for Trac in WT was then set to 1. The data represent the mean and s.e.m. of three independent experiments, each analyzing a pair of mice. Statistical significance was calculated using two-way ANOVA with Holm-Sidak’s correction for multiple comparisons. *P<0.05, **P<0.01, ***P<0.001.

References

    1. Schatz DG, Spanopoulou E, Biochemistry of V(D)J recombination. Curr Top Microbiol Immunol 290, 49–85 (2005). - PubMed
    1. Teng G, Maman Y, Resch W, Kim M, Yamane A, Qian J, Kieffer-Kwon KR, Mandal M, Ji Y, Meffre E, Clark MR, Cowell LG, Casellas R, Schatz DG, RAG Represents a Widespread Threat to the Lymphocyte Genome. Cell 162, 751–765 (2015). - PMC - PubMed
    1. Kuo TC, Schlissel MS, Mechanisms controlling expression of the RAG locus during lymphocyte development. Curr Opin Immunol 21, 173–178 (2009). - PMC - PubMed
    1. Wayne J, Suh H, Misulovin Z, Sokol KA, Inaba K, Nussenzweig MC, A regulatory role for recombinase activating genes, RAG-1 and RAG-2, in T cell development. Immunity 1, 95–107 (1994). - PubMed
    1. Barreto V, Marques R, Demengeot J, Early death and severe lymphopenia caused by ubiquitous expression of the Rag1 and Rag2 genes in mice. Eur J Immunol 31, 3763–3772 (2001). - PubMed

Publication types

Substances